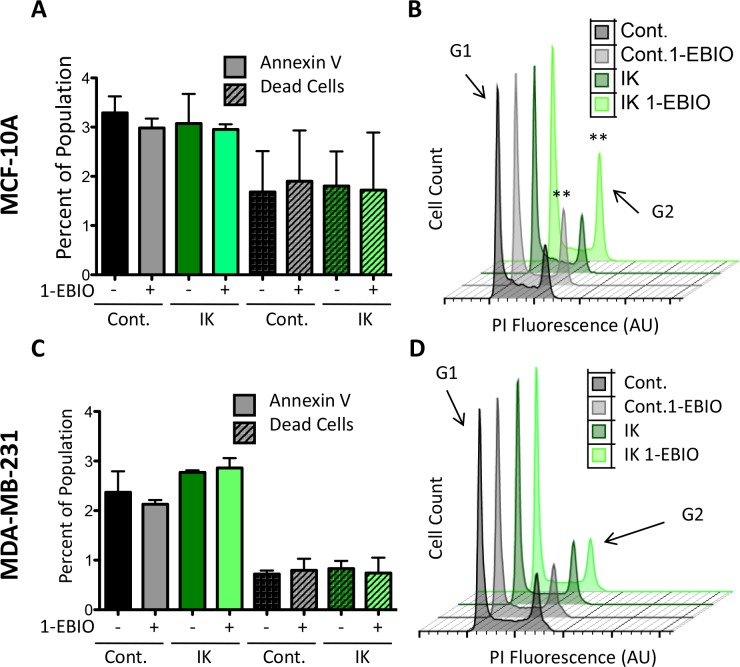
Figure 5. 1-EBIO treatment increased G2 phase accumulation in MCF-10A but had no effect on MDA-MB-231.
Control and IK over-expressing MCF-10A (A) and MDA-MB-231 (C) cells were treated with vehicle control or 1-EBIO for 24 h, stained with annexin-FITC and violet dead stain, and analyzed by flow cytometry to quantify the percentage of positively stained cells (no significant difference in annexin-V or dead stained cells across any condition, 1-way ANOVA). (B, D) Plot of cell count versus propidium iodide (PI) fluorescence to analyze cell cycle. Arrow marks fluorescence intensity corresponding to G2 phase. Plot is representative of three independent replicates (MCF-10A **p < 0.01, MDA-MB-231 p = 0.29, 1-way ANOVA). All data presented as mean with SEM of three independent replicates.

