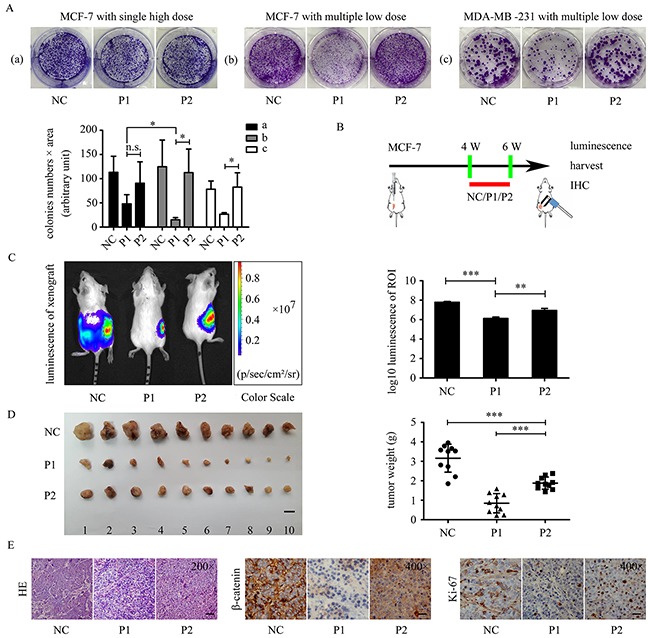
Figure 6. WVLGE-containing polypeptide suppresses growth of breast cancer cells.

(A) Colony formation assay in MCF-7 and MDA-MB-231 cells. ‘Single high dose’ stands for adding the polypeptides to 1.0 μM once at the beginning of incubation, and ‘multiple low dose’ stands for adding the polypeptides to 0.10 μM 5 times every 3 days. The number of cells in the colonies multiplied by the area of the colonies are plotted at the lower left panel (n = 3, mean ± SD). (B) The schematic graph shows the experimental design of the in vivo study. Four weeks after MCF-7 cells were transplanted, the tumor xenografts were treated with P1-polypeptide, P2-polypeptide, or negative control for 2 weeks, followed by observation. (C) Tumor xenografts of MCF-7 luc+ cells were treated as described in (B). The bioluminescence of the tumor xenografts were recorded as pseudo-color images according to the color scale presented. Red dotted lines delineate the region of interest (ROI). The luminescence intensities of the ROI were quantified and normalized by log10 (n = 3, mean ± SD). (D) Tumor weights were plotted as indicated. Scale bar is 1 cm (n = 10, mean ± SD). (E) The representative images of HE staining and IHC of β-catenin and Ki-67. Scale bar is 100 μm for HE and 50 μm for IHC images. P1-treated tumor xenograft possesses fewer tumor parenchymal cells compared with P2 and negative control groups. IHC were performed on adjacent 5-μm sections for β-catenin and Ki-67. Quantitative data of IHC are provided in Supplementary Figure 2. *P<0.05, **P<0.01, and ***P<0.001; n.s.: not significant.
