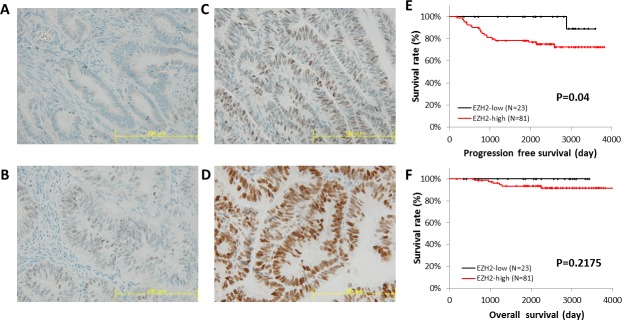
Figure 3. Immunohistochemical staining of EZH2 in a tissue microarray.
EZH2 protein expression in endometrial cancer was identified using tissue microarray (TMA) data for 104 cases. The intensity of EZH2 expression in TMA was graded as (A) 0, negative intensity; (B) 1, weak intensity; (C) 2, medium intensity; and (D) 3, strong intensity. Scale bar, 100 μm. The median intensity of EZH2 expression was used as a threshold. PFS (E) and OS (F) were analyzed by the Kaplan-Meier method and log-rank test.

