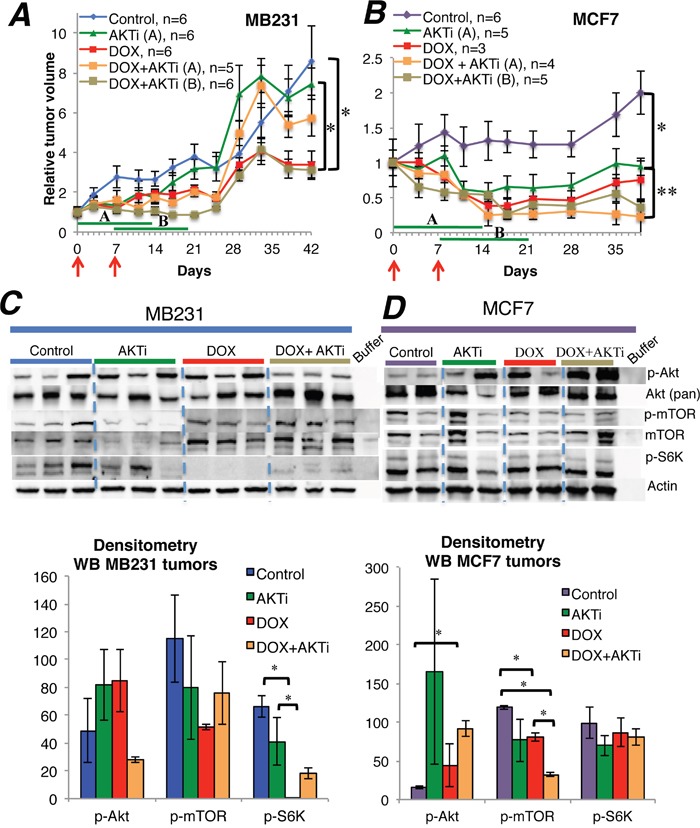
Figure 4. The influence of A-443654 and doxorubicin on tumor growth in vivo.

(A-B) Tumor growth of MB231 and MCF7 breast cancer in NOD/SCID mice, given doxorubicin (DOX) 1.25 mg/kg i.p. qW twice (red arrows), Akt inhibitor A-443654 (AKTi) 3.75 mg mg/kg BID 14 days (green lines) or the combination. AKTi treatment commenced either at the first (A) or at the second (B) doxorubicin injection. Tumor volume is displayed as the mean ± SEM for each group, relative to tumor volume on the day treatment started. *p<0.05, **p<0.01. (C-D) Western blots for PTEN and Akt-mTOR-S6K signaling in MB231 (C) and MCF7 (D) tumors, harvested the last day of A-443654 treatment. Whole cell lysate, 30 μg protein loaded per lane. The sample order on the blot pictures has been rearranged to enhance readability. Densitometries for western blots (C-D) depict the relative protein expression, normalized to actin. Phosphorylated Akt (p-Akt) and mTOR (p-mTOR) were normalized to actin and thereafter to total Akt and mTOR, respectively. Bars represent the mean protein expression for experiments performed in duplicate (D) or triplicate (C) ± SEM. *p<0.05
