

Abstract
Background
Age-related memory decline has been well-documented; however, some individuals reach their 8th–10th decade while maintaining strong memory performance.
Objective
To determine which demographic and biomarker factors differentiated top memory performers (aged 75+, top 20% for memory) from their peers and whether top memory performance was maintained over 3 years.
Methods
Clinically normal adults (n = 125, CDR = 0; age: 79.5 ± 3.57 years) from the Harvard Aging Brain Study underwent cognitive testing and neuroimaging (amyloid PET, MRI) at baseline and 3-year follow-up. Participants were grouped into Optimal (n = 25) vs. Typical (n = 100) performers using performance on 3 challenging memory measures. Non-parametric tests were used to compare groups.
Results
There were no differences in age, sex, or education between Optimal vs. Typical performers. The Optimal group performed better in Processing Speed (p = 0.016) and Executive Functioning (p < 0.001). Optimal performers had larger hippocampal volumes at baseline compared with Typical Performers (p = 0.027) but no differences in amyloid burden (p = 0.442). Twenty-three of the 25 Optimal performers had longitudinal data and16 maintained top memory performance while 7 declined. Non-Maintainers additionally declined in Executive Functioning but not Processing Speed. Longitudinally, there were no hippocampal volume differences between Maintainers and Non-Maintainers, however Non-Maintainers exhibited higher amyloid burden at baseline in contrast with Maintainers (p = 0.008).
Conclusions
Excellent memory performance in late life does not guarantee protection against cognitive decline. Those who maintain an optimal memory into the 8th and 9th decades may have lower levels of AD pathology.
Keywords: memory, amyloid, SuperAging
1. Introduction
Age-related memory decline occurs throughout the life span (Evans et al., 2011; Salthouse, 2004) and is often considered an unavoidable aspect of “normal aging”. Despite these observations, there are documented cases of individuals who maintain excellent memory performance in later life (Harrison et al., 2012). Interestingly, many successful agers among the “oldest old” who continue to perform normally up until the time of their death have brain pathology that is indistinguishable from those with Alzheimer’s disease (AD) (Balasubramanian et al., 2012). This suggests that some individuals are more resilient to cognitive decline in the setting of AD pathology. However, there are more recent studies suggesting that SuperAgers have a lower frequency of the ApoE-4 allele and fewer surrogate markers for AD (Harrison et al., 2012; Rogalski et al., 2013). Furthermore, greater amyloid burden has been associated with cognitive decline in the oldest-old (age 90+) (Kawas et al., 2013; Snitz et al., 2013). Thus, it remains unclear to what extent optimal cognitive aging in late life reflects resilience to AD pathology or absence of AD pathology.
The advent of in vivo imaging of AD biomarkers, including amyloid Positron Emission Tomography (PET), allow for the examination of AD pathology in living individuals. We were interested in examining a subset of older individuals in the Harvard Aging Brain Study (HABS) who outperform their peers on memory measures to determine whether neuroimaging markers may be different from those with typical memory performance.
Multiple strategies have been used to operationalize optimal/successful aging, for example, characterizing according to physical functioning, self-reported ADLs, cognitive functioning, or life satisfaction (Depp & Jeste, 2006) as criteria for categorization. One particularly relevant example is SuperAging, which was originally defined as scoring 1) at or above a raw score of 9 on the delayed recall portion of the RAVLT and 2) performing at or above 1 SD average performance for age and education on non-memory measures according to published norms (Rogalski et al., 2013). Though not quite SuperAgers by definition, our Optimal Memory Performers consisted of a group of high functioning older adults aged 75+ who were performing in the top 20% on particularly challenging memory tests as compared to the remainder of the HABS sample. We compared the Optimal Memory Performers to their normally performing peers: Typical Memory Performers. We aimed to investigate whether the Optimal Memory Performers were less likely to be on the AD trajectory compared to their peers. In particular, we explored group differences in demographic, biomarker, and cognitive factors at baseline. We additionally examined Optimal Memory Performers who maintained their excellent performance at 3-year follow-up (n = 16) and those who declined (n = 7).
We hypothesized that Optimal Memory Performers may reflect a younger cohort within the 75+ range and may exhibit higher levels of education and higher socio-economic status given that these characteristics have been shown to be protective against cognitive decline (Karp et al., 2004; Scarmeas & Stern, 2003; Stern et al., 2012). Additionally, if Optimal Memory Performers are less at-risk for AD, we hypothesized that they would be more likely ApoE-4 allele non-carriers (Saunders et al., 1993) and exhibit lower amyloid-PET burden. They may additionally exhibit resilience to age-associated hippocampal atrophy (Mungas et al., 2005; Schuff et al., 2009). Finally, we were interested in whether optimal memory performance was mirrored in other cognitive domains, such as executive functioning and speed of processing. Better executive functioning may be associated with better performance on memory tasks, particularly challenging tasks that benefit from strategy development (Buckner, 2004; Grober et al., 2008).
2. Materials and Methods
2.1. Participants
Our sample consisted of 125 older adults (age: 79.5 ± 3.57 years, years of education: 15.54 ± 3.12, MMSE: 28.79 ± 1.07, 45% male) enrolled in the Harvard Aging Brain Study using previously described methods (Dagley et al., 2015) at the Massachusetts General Hospital. All participants signed an informed consent and the Partners Human Research Committee approved the study.
All participants were deemed clinically normal based on the (1) Mini Mental State Exam (MMSE) score (adjusted for age & education) (Folstein, Folstein, & McHugh, 1975), (2) scores above age and education adjusted cut-offs on the delayed paragraph recall (Logical Memory II) of the Wechsler Memory Scale-Revised (Wechsler, 1987), and (3) a Clinical Dementia Rating (CDR) (Morris, 1993) score of 0, as assessed by an experienced clinician. In addition, the American National Reading Test (AmNART) was used to derive an estimate of Verbal IQ with greater scores associated with higher intelligence (Paolo & Ryan, 1992). Clinical and neurological exams confirmed that participants had no history of alcoholism or drug abuse in the last two years, head trauma, or current serious medical or psychiatric illness. Participants were only included in this analysis if they were 75 years of age and older and had completed neuropsychological testing, structural MRI, amyloid PET scans and ApoE genotyping.
2.2. Neuropsychological Evaluation
The memory composite score was composed of outcomes from the Memory Capacity Test (MCT) (Papp et al., 2015; Rentz et al., 2010), the Face Name Associative Memory Exam (FNAME) (Amariglio et al., 2012; Rentz et al., 2011), and the 6-trial Selective Reminding Test (SRT) (Masur et al., 1989). These tests were chosen because they are cognitively challenging and have been shown to be sensitive markers of amyloid deposition in high functioning individuals (Papp et al., 2015; Rentz et al., 2010). Two outcomes for each measure (delayed free-recall and delayed cued recall for MCT, delayed recall of names and occupations on the FNAME, and delayed recall and delayed multiple choice on the SRT) were z-transformed (using the mean and standard deviation of the whole HABS sample at baseline). The mean of these z-scores constituted the memory performance composite score. Participants were separated into two groups based on their memory composite score with high performers scoring in the top 20% (n = 25; performing ≥0.5 SD above the mean), and typical performers scoring < 0.5 z-scores (n = 100). Three-year follow-up data was available on 23 of the original 25 Optimal Memory Performers. Based on their follow-up performance, participants were grouped into Optimal Maintainers and Optimal Non-Maintainers, described in detail in the Results section.
2.2.1. Executive Functioning and Speed of Processing
Previously validated factor scores from the HABS cohort were used for analysis of Executive Functions and Speeded Processing (Hedden et al., 2012). The Executive function score included the sum of words for letter fluency (F-A-S) produced in 60 seconds (Benton et al., 1983) production of animals, fruits and vegetables in 60 seconds (Monsch et al., 1992), Letter-Number sequencing of the Wechsler Scale-III (Wechsler, 1997), Digit Span Backward (adapted from Petrides and Milner, 1982 and Shimamura and Jurica,1994), a switching score from the Number-Letter task (adapted from Miyake et al., 2000 and Rogers and Monsell, 1995), the Flanker test (adapted from Eriksen and Eriksen, 1974 and Ridderinkhof et al., 1999) and Trail Making Test B minus A (Reitan, 1979). Processing Speed consisted of the Number Letter non-switching task, Trail Making Test A, and the Digit Symbol subtest of WAIS-R (Wechsler, 1981).
2.3. Biomarkers
2.3.1. Structural MRI data acquisition and analysis
MRI was completed on a Siemens Trio-TIM 3T scanner with a 12-channel phased-array whole-head coil. Structural T1 weighted images were acquired as magnetization-prepared rapid gradient-echo (MPRAGE) with the following acquisition parameters: TR/TE/TI = 2300/2.95/900ms, flip angle = 9°, 1.1x1.1x1.2mm resolution, 2X (GRAPPA) acceleration. Hippocampal volumes were collapsed across hemispheres and intracranial volume (ICV) controlled using: raw HV—b (ICV —mean ICV), b = unstandardized coefficient when HV is regressed against ICV. Region of interest labeling was derived using FreeSurfer v5.1 (Fischl, 2012). MRI was collected at baseline and 3-year follow-up.
2.3.2. PET data acquisition and analysis
PET imaging was completed at the MGH PET facility. Fibrillar amyloid binding was measured with the radiotracer Pittsburgh Compound B-PiB (Klunk et al., 2004; Mathis et al., 2003) using a Siemens ECAT EXACT HR+ PET scanner. After injection of 8.5–15 mCi PiB, 60-mins of dynamic data were acquired in 3D acquisition mode. PiB data were analyzed using the distribution volume ratio (DVR) created using the Logan graphical analysis method with cerebellar cortex as reference tissue (Logan et al., 1996; Price et al., 2005). PiB PET was collected at baseline and 3-year follow-up.
2.3.3. ApoE e4 Status
Blood samples were collected from all the participants using standard procedures to evaluate ApoE polymorphisms. Participants were categorized as carriers and non-carriers based on whether or not they carried the e4 allele.
2.4. Statistical Analyses
Two sets of analyses were conducted with baseline data: differences between (1) Optimal Memory Performers and Typical Memory Performers and (2) Optimal Maintainers and Optimal Non-Maintainers. Non-parametric measures (i.e., Mann-Whitney U Test) were used to compare groups to account for the disproportionate sample size at baseline and reduced sample size when examining the Optimal Maintainers vs. Non-Maintainers. Differences in sex and e4 status (+/−) between groups were determined using Fisher’s Exact Test (2-sided). To determine whether Optimal Maintainers vs. Non-Maintainers declined in Processing Speed or Executive Functioning, exhibited more amyloid accumulation or reduced hippocampal volume over 3 years, change scores were calculated and Mann-Whitney U Tests were used to determine whether there were significant differences between groups.
3. Results
3.1. Differences Between Optimal Memory Performers and Typical Memory Performers
3.1.1. Demographic Factors
There were no significant group differences between Optimal Memory Performers (n = 25) vs. Typical Memory Performers (n = 100) in terms of age, educational attainment, estimated verbal intelligence, or in distribution of sex (Table 1) at baseline. However, Optimal Memory Performers scored significantly higher on the baseline cognitive screening measures including the MMSE (U = 1610, z = 2.34, p = 0.02) and Logical Memory delayed recall (U = 1640, z = 2.62, p = 0.009) compared with Typical Memory Performers.
Table 1.
Group Differences between Optimal Agers and Typical Agers at Baseline.
| Optimal Performers (n = 25) Mdn (IQR) | Typical Performers (n = 100) Mdn (IQR) | Significance Testing | p-value | |
|---|---|---|---|---|
| Demographic | ||||
| Age (yrs) | 77.5(6.75) | 78.89 (5.5) | U= 1061, z = −1.17 | 0.242 |
| Sex (M/F) | 9/16 | 47/53 | 0.374 | |
| Education (yrs) | 16 (6) | 16 (5) | U=1298, z = 0.30 | 0.762 |
| Verbal IQ | 125 (11) | 124 (13) | U=1500, z = 1.64 | 0.101 |
| Biomarkers | ||||
| Amyloid-PET(DVR) | 1.16(0.29) | 1.11 (0.25) | U=1375, z = 0.77 | 0.442 |
| Hipp. Vol. (mm3) | 7293(750) | 6883 (1190) | U=1546, z = 2.21 | 0.027* |
| ApoE-4 (+/−) | 4/20 (16% e4+) | 30/67 (30% e4+) | 0.209 | |
| Memory Measures | ||||
| MMSE | 29(1) | 29(1) | U = 890, z = −2.34 | 0.020 |
| Logical Memory II | 15(6) | 13(4) | U = 5940, z = −2.62 | 0.009 |
| Cognitive (z-scores) | ||||
| Executive Func. | 0.26 (0.82) | −0.34 (1.17) | U = 1825, z = 3.89 | 0.000** |
| Proc. Speed | −0.04 (0.70) | −0.24 (1.15) | U = 1592, z = 2.41 | 0.016** |
Notes: Mdn = median, IQR = interquartile range,
p < 0.01
p < 0.05; For Biomarker data only 96/100 Typical Performers had data available.
3.1.2. Biomarker Factors
At baseline, Optimal Memory Performers had significantly larger hippocampal volumes compared with the Typical Memory Performers (p = 0.027) (Table 1, Figure 2). In the combined sample of Optimal and Typical memory performers with longitudinal hippocampal volume (n = 83), there was no differential rate of atrophy between groups (U = 516, z = −0.99, p = 0.319) with Optimal and Typical performers losing volume equivalently.
Figure 2. Hippocampal Volume by Group.

At baseline, Optimal Memory Performers (n = 25) exhibited larger hippocampal volumes compared with Typical Memory Performers (n = 100). Both Optimal Maintainers (n = 16) and Non-Maintainers (n = 7) exhibited hippocampal atrophy over 3 years; however, rates of decline did not differ between groups.
There were no significant group differences in level of amyloid burden between the Optimal and Typical groups (p = 0.442). A total of 16% of the Optimal Memory Performers were e4 carriers compared with 30% of the Typical Performers, however this difference was not significant (p = 0.209).
3.1.3. Cognitive Factors
At baseline, Optimal Memory Performers outperformed Typical Memory Performers on both composites of Executive Functioning (p < 0.001) as well as Processing Speed (p = 0.016) (Table 1).
3.2. Longitudinal Trajectories of the Optimal Memory Performers
Follow-up data on the original 25 Optimal Memory Performers revealed a nonsignificant trend for memory decline at the group level, z = −1.89 p = 0.059 (Figure 1). A total of 16 individuals maintained their optimal status (Maintainers) by continuing to perform ≥ 0.5 SD above the mean for the Memory Composite while 7 declined compared with their initial performance (Non-Maintainers). Two Optimal Memory Performers did not have follow-up data because they discontinued study participation. Of the 23 initial optimal performers with follow-up cognitive data, 19 had biomarker data for longitudinal PiB PET and hippocampal volume (2 discontinued participation in the imaging portion of the study because of medical restrictions).
Figure 1. Optimal Memory Performance over Time.

Memory composites scores at baseline for Optimal Memory Performers (n = 25) and 3-year follow-up showing Optimal Maintainers (n = 15, scoring > 0.5 SD’s above the mean) and Optimal Non-Maintainers (n = 7).
3.2.1. Demographic Factors
There were no demographic differences (i.e., sex, age, education, or estimated verbal IQ) between Optimal Maintainers (n = 16) versus Optimal Non-Maintainers (n = 7) (Table 2).
Table 2.
Group Differences between Optimal Maintainers and Optimal Non-Maintainers at Baseline.
| Optimal Maintainer (n = 16) Mdn (IQR) | Optimal Non-Maintainer (n = 7) Mdn (IQR) | Significance Testing | p-value | |
|---|---|---|---|---|
| Demographic | ||||
| Age (yrs) | 77(6.38) | 81(6.75) | U = 45, z = −0.74 | 0.492 |
| Sex (M/F) | 4/11 | 4/4 | 0.182 | |
| Education (yrs) | 16(6) | 18(8) | U = 47, z = −0.62 | 0.579 |
| Verbal IQ | 123(11) | 129(5) | U = 37.5, z = −1.24 | 0.222 |
| Biomarkers | ||||
| Amyloid-PET (DVR) | 1.11(0.16) | 1.43(0.26) | U = 13, z = −2.58 | 0.008* |
| Hipp. Vol. (mm3) | 7530(896) | 6966(431) | U = 70, z = 0.35 | 0.376 |
| ApoE-4 (+/−) | 2/13 (13% e4+) | 2/5 (29% e4+) | 0.565 | |
| Memory Measures | ||||
| MMSE | 29(1) | 29(2) | U = 46, z = −0.718 | 0.535 |
| Logical Memory II | 15(6) | 14(9) | U = 49.5, z = −0.436 | 0.671 |
| Cognitive (z-scores) | ||||
| Executive Func. | 0.28(0.76) | 0.42(1.95) | U = 45, z = −0.74 | 0.492 |
| Proc. Speed | −0.06(0.62) | −0.03(2.09) | U = 23, z = −0.20 | 0.871 |
Notes: Mdn = median, IQR = interquartile range,
p < 0.05
p < 0.01; For Biomarker data only 14/16 Maintainers and only 5/7 Non-Maintainers had data available.
3.2.2. Biomarker Factors
Unlike baseline group differences in hippocampal volume observed between the Optimal and Typical groups, there was no difference in baseline hippocampal volume between Optimal Maintainers vs. Non-Maintainers (Table 2, Figure 2). There was no difference in hippocampal atrophy over 3 years between Maintainers and Non-Maintainers, U = 42, z = −0.23, p = 0.850 (Figure 2).
Optimal Memory Maintainers exhibited lower amyloid burden at baseline compared with Non-Maintainers (p = 0.008). Non-Maintainers did not accumulate amyloid at a faster rate compared with the Maintainers, U = 22, z = −1.20, p = 0.257 (Figure 3). There were no group differences in e4 carriage between Maintainers and Non-Maintainers (Table 2).
Figure 3. Amyloid PET Deposition by Group.

There was no difference in amyloid burden between Optimal and Typical Memory Performers at Baseline. Optimal Non-Maintainers exhibited higher levels of amyloid burden at baseline and follow-up compared with Optimal Maintainers.
3.2.3. Cognitive Factors
Unlike lower performance in Executive Functioning and Processing Speed observed in Typical vs. Optimal performers at baseline, there were no group differences in performance in these non-memory domains between Optimal Maintainers versus Non-Maintainers at baseline (Table 2). Optimal Non-Maintainers exhibited greater decline in Executive Functioning over time compared with the Optimal Maintainers, U = 100, z = 2.94, p = 0.002 (Figure 4). However, there were no group differences in Processing Speed over time, U = 66, z = 0.67, p = 0.535 (Figure 4).
Figure 4. Non-Memory Cognitive Decline in Optimal Maintainers versus Non-Maintainers.
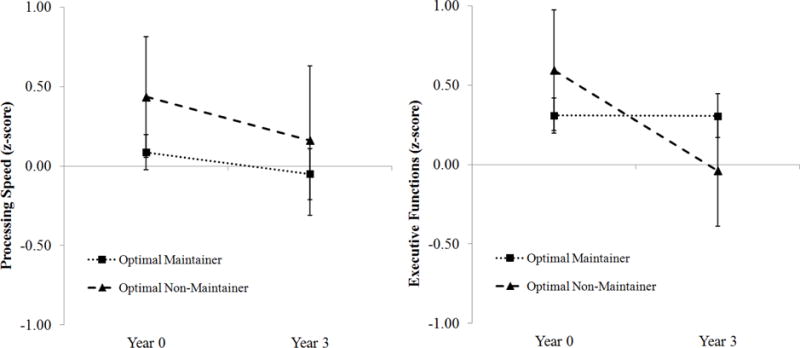
Optimal Non-Maintainers exhibited greater decline in Executive Functions longitudinally (right) compared with Optimal Maintainers. No group differences were observed in Processing Speed (left).
4. Discussion
Our finding that Optimal Memory Performers had larger hippocampal volumes compared with their Typically-performing peers is consistent with recent work showing that SuperAgers exhibit more “youthful” paralimbic and limbic structures (Sun et al., 2016) and less age-related cortical atrophy (Harrison et al., 2012). While there was no association between Optimal vs. Typical performance and amyloid burden cross-sectionally, maintenance of optimal memory performance over 3 years was associated with lower amyloid burden at baseline. Combined, these findings support the notion that while excellent memory performance in late life may be associated with more robust memory-related anatomy, reduced evidence for Alzheimer’s risk markers is only associated with maintenance of that optimal memory performance. Thus, simply possessing optimal memory performance in late life does not guarantee a continued benign cognitive aging trajectory.
The lack of a difference in cross-sectional amyloid burden between Optimal and Typical Performers is not surprising. Growing evidence suggests that the cross-sectional relationship between amyloid burden and cognition in clinically normal older adults is somewhat tenuous (Hedden et al., 2013; Mormino et al., 2014). This is consistent with the hypothetical model of Alzheimer’s disease whereby amyloid accumulation represents an early precipitating event (Sperling et al., 2011) that initiates a cascade leading to neuronal injury and subsequent cognitive decline. Our finding that lower amyloid burden at baseline was associated with maintenance of optimal memory performance over 3 years is consistent with this hypothetical model. More specifically, optimal non-maintainers may represent a group that is progressing on the preclinical trajectory compared with Maintainers. It is important to note, however, that only 2 of the 7 “non-maintainers” declined more than one standard deviation below the sample mean. Additionally, Evans et al. (2011) noted that even if two 80 year olds get the same score on a memory measure, one may be declining, while the other is not. This is why it is imperative to collect longitudinal follow-up data even on those who are deemed Optimal Memory Performers at baseline in order to determine whether non-maintenance of optimal memory has clinically meaningful repercussions.
Previous work observing SuperAgers over 1.5 years showed stability of cognitive performance over that time frame (Gefen et al., 2014). This discrepancy in findings between our Optimal Memory Performers and previously reported SuperAgers is likely influenced by different selection criteria and measures employed, as well as different follow-up periods. We used multiple challenging memory measures to define our Optimal and Typical Performers in order to fully capture excellent memory performance across a range of memory tests. Within a challenging memory composite, the Optimal Memory Performers scored at or above 0.5 SDs on the memory composite score with the highest performer scoring only 1.2 SDs above the mean. This more limited range in performance is consistent with a highly educated and high functioning cohort. We employed the ≥ 0.5 SD cut-off rather than comparing performance to normative data, because of the unavailability of normative data on two of the challenging memory tests. Despite the sampling differences between the two studies, the 3-year longitudinal follow up of our Optimal Performers suggests that over this time frame, not everyone will retain their high performance, whereas stability of performance may be maintained over a shorter time frame.
While our Optimal performers exhibited larger hippocampal volumes, it remains unclear whether larger hippocampal volumes in Optimal Memory Performers reflect a developmental advantage (i.e., they always had larger hippocampi) or resilience to age-related hippocampal atrophy. Hippocampal atrophy has multiple etiologies including pathologic TDP43 (Josephs et al., 2015) and cerebrovascular disease (Mungas et al., 2002) in addition to AD.
The lack of a difference between groups and carriage of the ApoE-4 allele is not entirely surprising given that the peak effect of e4 seems to occur for those in their 60s, and that a majority of ε4 carriers demonstrate clinical progression to MCI or AD dementia prior to 75 years of age (Blacker & Tanzi, 1998; Caselli et al., 2009). Thus, it is likely that ε4 carriers who are over 75 years of age and remain clinically normal may not be representative of the ε4 carrier population at large. The small number of individuals belonging to this group (n = 4) limits their characterization.
The Optimal Memory Performers were initially defined by their performance on highly challenging tasks of memory but they also outperformed their Typical peers on measures of executive function and speed of processing. It is likely that the Optimal group’s superior memory performance could be reflected by strengths in other cognitive domains, such as executive functions and processing speed. The memory measures used to define Optimal Agers are particularly challenging, and good attention and strategic skills are required to bolster performance (Buckner, 2004). Optimal Non-Maintainers declined at a faster rate in Executive Functioning compared with the Maintainers. This suggests that decline among initially Optimal Memory Performers is not necessarily specific to the memory domain.
A limitation of this study is the small sample size. We selected the top 20% cut-off for Optimal Memory Performers to maximize our sample size rather than examining only the top SuperAgers. Despite the small sample, we believe that this finding contributes to the field, and aligns with other studies, which also report small sample sizes (Rogalski et al., 2013). Our cohort consists of very high functioning individuals for their age who were selected based on normal cognition and therefore may not be representative of the young elderly or oldest old population at large. Furthermore, individuals who reach age 75+ while remaining cognitively normal may, by definition, have particularly robust brain health. Survival bias may also play a role in the lack of differences in cognitive reserve (i.e., educational achievement, estimated IQ) observed between groups. Previous studies showing protective effects of high educational achievement and cognitive engagement had a much wider array of educational and socioeconomic statuses in their samples (Koster et al., 2005).
In sum, greater hippocampal volumes at the cross-section contributed to optimal memory performance at age 75+, however, maintenance of that excellent performance over 3 years was associated with lower amyloid burden suggesting that 1) excellent memory performance in late life does not guarantee protection against cognitive decline, and 2) those who remain cognitively optimal over time may have less AD-specific pathology. These findings also speak to the larger question of the concept of “normal aging.” Observational studies consistently observe a negative correlation between cognitive performance across multiple domains and age (Hedden, 2004; Salthouse, 2004) and neuropsychologists rely on age-corrected normative data to identify “normal” versus worrisome cognitive decline. Previous SuperAger findings combined with our own finding of biomarker differences among Optimal versus Typical Memory Performers and Optimal Maintainers versus Non-Maintainers suggests that a certain proportion of what is considered “normal age-related decline” is in fact potentially pathological. In vivo imaging of amyloid and more recently tau, provides an unprecedented opportunity to improve normative data by incorporating biomarker-corrected normative data (Hassenstab et al., 2016).
Supplementary Material
Highlights.
Optimal Memory Performance is associated with larger baseline hippocampal volumes.
Optimal Memory retention is associated with lower baseline amyloid levels.
There were no demographic differences between Optimal and Typical Performers.
Acknowledgments
K. Papp was supported by NIA grant K23 AG053422-01 and the Alzheimer’s Association.
H. Jacobs was supported by Alzheimer Nederland fellowship (WE.15-2014-06).
R. Buckley was supported by the Australian National Health and Medical Research Council and Australian Research Council Dementia Research Fellowship APP1105576.
R. Sperling was supported by NIH grants U01 AG032438, U01 AG024904, R01 AG037497, R01 AG034556, K24 AG035007, P50 AG005134, U19 AG010483, R01 AG027435 and P01 AG036694, Alzheimer’s Association, Fidelity Biosciences, Harvard NeuroDiscovery Center, Janssen Pharmaceuticals, and Eli Lilly and Co.
A. Schultz was supported by NIA grant P01 AG036694.
K. Johnson was supported by NIH Grants R01-EB-014894, R21-AG-038994, R01-AG-026484, R01-AG-034556, P50-AG-00513421, U19-AG-10483, P01-AG-036694, R13-AG-042201174210, R01-AG-027435, and R01-AG-037497; and Alzheimer’s Association Grant ZEN-10–174210.
D. Rentz was supported by NIA (P01 AG036694, RO1 AG037497, RO1EB014894) and the Alzheimer’s Association (IIRG-08-90,934).
Footnotes
Publisher's Disclaimer: This is a PDF file of an unedited manuscript that has been accepted for publication. As a service to our customers we are providing this early version of the manuscript. The manuscript will undergo copyediting, typesetting, and review of the resulting proof before it is published in its final citable form. Please note that during the production process errors may be discovered which could affect the content, and all legal disclaimers that apply to the journal pertain.
Disclosures
M. Dekhtyar has no disclosures to report.
K. Papp has served as a paid consultant for Biogen Idec.
H. Jacobs has no disclosures to report.
R. Buckley has no disclosures to report.
R. Sperling has served as a paid consultant for Abbvie, Biogen, Bracket, Genentech, Lundbeck, Roche, and Sanofi. She has served as a co-investigator for Avid, Eli Lilly, and Janssen Alzheimer Immunotherapy clinical trials. She has spoken at symposia sponsored by Eli Lilly, Biogen, and Janssen. R. Sperling receives research support from Janssen Pharmaceuticals, and Eli Lilly and Co. These relationships are not related to the content in the manuscript.
A. Schultz has served as a paid consultant for and Janssen Alzheimer Immunotherapy clinical trials and Biogen.
K. Johnson has served as paid consultant for Bayer, Bristol-Myers Squibb, GE Healthcare, Janssen Alzheimer’s Immunotherapy, Siemens Medical Solutions, and Genzyme. He is a site coinvestigator for Lilly/Avid, Bristol-Myers Squibb, Pfizer, Janssen Immunotherapy, and Navidea. He has spoken at symposia sponsored by Janssen Alzheimer’s Immunotherapy and Pfizer. T. Benzinger has served on an advisory board for Eli Lilly and has received research funding from Avid Radiopharmaceuticals. These relationships are not related to the content in the manuscript.
D. Rentz has served as a paid consultant for Eli Lilly, Lundbeck Pharmaceuticals, Janssen Alzheimer Immunotherapy, Biogen, Idec and Neurotrack. These relationships are not related to the content in the manuscript.
References
- Amariglio RE, Frishe K, Olson LE, Wadsworth LP, Lorius N, Sperling RA, Rentz DM. Validation of the Face Name Associative Memory Exam in cognitively normal older individuals. Journal of clinical and experimental neuropsychology. 2012;34(6):580–587. doi: 10.1080/13803395.2012.666230. [DOI] [PMC free article] [PubMed] [Google Scholar]
- Balasubramanian AB, Kawas CH, Peltz CB, Brookmeyer R, Corrada MM. Alzheimer disease pathology and longitudinal cognitive performance in the oldest-old with no dementia. Neurology. 2012;79(9):915–921. doi: 10.1212/WNL.0b013e318266fc77. [DOI] [PMC free article] [PubMed] [Google Scholar]
- Blacker D, Tanzi RE. The genetics of Alzheimer disease: current status and future prospects. Archives of Neurology. 1998;55(3):294–296. doi: 10.1001/archneur.55.3.294. [DOI] [PubMed] [Google Scholar]
- Benton AL, Hamsher K, Varney NR, Spreen O. Contributions to neuropsychological assessment: a clinical manual. Oxford UP, New York; 1983. [Google Scholar]
- Buckner RL. Memory and executive function in aging and AD: multiple factors that cause decline and reserve factors that compensate. Neuron. 2004;44(1):195–208. doi: 10.1016/j.neuron.2004.09.006. [DOI] [PubMed] [Google Scholar]
- Caselli RJ, Dueck AC, Osborne D, Sabbagh MN, Connor DJ, Ahern GL, Locke DE. Longitudinal growth modeling of cognitive aging and the APOE e4 effect. The New England journal of medicine. 2009;361(3):255. doi: 10.1056/NEJMoa0809437. [DOI] [PMC free article] [PubMed] [Google Scholar]
- Dagley A, LaPoint M, Huijbers W, Hedden T, McLaren DG, Chatwal JP, Johnson KA. Harvard aging brain study: dataset and accessibility. NeuroImage. 2015 doi: 10.1016/j.neuroimage.2015.03.069. [DOI] [PMC free article] [PubMed] [Google Scholar]
- Depp CA, Jeste DV. Definitions and predictors of successful aging: a comprehensive review of larger quantitative studies. The American Journal of Geriatric Psychiatry. 2006;14(1):6–20. doi: 10.1097/01.JGP.0000192501.03069.bc. [DOI] [PubMed] [Google Scholar]
- Eriksen BA, Eriksen CW. Effects of noise letters upon the identification of a target letter in a nonsearch task. Perception & psychophysics. 1974;16(1):143–149. [Google Scholar]
- Evans DA, Grodstein F, Loewenstein D, Kaye J, Weintraub S. Reducing case ascertainment costs in US population studies of Alzheimer’s disease, dementia, and cognitive impairment—Part 2. Alzheimer’s & Dementia. 2011;7(1):110–123. doi: 10.1016/j.jalz.2010.11.008. [DOI] [PMC free article] [PubMed] [Google Scholar]
- Fischl B. FreeSurfer. Neuroimage. 2012;62(2):774–781. doi: 10.1016/j.neuroimage.2012.01.021. [DOI] [PMC free article] [PubMed] [Google Scholar]
- Folstein MF, Folstein SE, McHugh PR. “Mini-mental state”: a practical method for grading the cognitive state of patients for the clinician. Journal of psychiatric research. 1975;12(3):189–198. doi: 10.1016/0022-3956(75)90026-6. [DOI] [PubMed] [Google Scholar]
- Gefen T, Shaw E, Whitney K, Martersteck A, Stratton J, Rademaker A, Rogalski E. Longitudinal neuropsychological performance of cognitive SuperAgers. Journal of the American Geriatrics Society. 2014;62(8):1598–1600. doi: 10.1111/jgs.12967. [DOI] [PMC free article] [PubMed] [Google Scholar]
- Grober E, Hall CB, Lipton RB, Zonderman AB, Resnick SM, Kawas C. Memory impairment, executive dysfunction, and intellectual decline in preclinical Alzheimer’s disease. Journal of the International Neuropsychological Society. 2008;14(02):266–278. doi: 10.1017/S1355617708080302. [DOI] [PMC free article] [PubMed] [Google Scholar]
- Harrison TM, Weintraub S, Mesulam M, Rogalski E. Superior memory and higher cortical volumes in unusually successful cognitive aging. Journal of the International Neuropsychological Society. 2012;18(06):1081–1085. doi: 10.1017/S1355617712000847. [DOI] [PMC free article] [PubMed] [Google Scholar]
- Hassenstab J, Chasse R, Grabow P, Benzinger TL, Fagan AM, Xiong C, Morris JC. Certified normal: Alzheimer’s disease biomarkers and normative estimates of cognitive functioning. Neurobiology of aging. 2016;43:23–33. doi: 10.1016/j.neurobiolaging.2016.03.014. [DOI] [PMC free article] [PubMed] [Google Scholar]
- Hedden T, Gabrieli JD. Insights into the ageing mind: a view from cognitive neuroscience. Nature reviews neuroscience. 2004;5(2):87–96. doi: 10.1038/nrn1323. [DOI] [PubMed] [Google Scholar]
- Hedden T, Mormino EC, Amariglio RE, Younger AP, Schultz AP, Becker JA, Rentz DM. Cognitive profile of amyloid burden and white matter hyperintensities in cognitively normal older adults. The Journal of Neuroscience. 2012;32(46):16233–16242. doi: 10.1523/JNEUROSCI.2462-12.2012. [DOI] [PMC free article] [PubMed] [Google Scholar]
- Hedden T, Oh H, Younger AP, Patel TA. Meta-analysis of amyloid-cognition relations in cognitively normal older adults. Neurology. 2013;80(14):1341–1348. doi: 10.1212/WNL.0b013e31828ab35d. [DOI] [PMC free article] [PubMed] [Google Scholar]
- Josephs KA, Nelson PT. Unlocking the mysteries of TDP-43. Neurology. 2015;84(9):870–871. doi: 10.1212/WNL.0000000000001322. [DOI] [PubMed] [Google Scholar]
- Karp A, Kåreholt I, Qiu C, Bellander T, Winblad B, Fratiglioni L. Relation of education and occupation-based socioeconomic status to incident Alzheimer’s disease. American journal of epidemiology. 2004;159(2):175–183. doi: 10.1093/aje/kwh018. [DOI] [PubMed] [Google Scholar]
- Kawas CH, Greenia DE, Bullain SS, Clark CM, Pontecorvo MJ, Joshi AD, Corrada MM. Amyloid imaging and cognitive decline in nondemented oldest-old: the 90+ Study. Alzheimer’s & Dementia. 2013;9(2):199–203. doi: 10.1016/j.jalz.2012.06.005. [DOI] [PMC free article] [PubMed] [Google Scholar]
- Koster A, Penninx BW, Bosma H, Kempen GI, Newman AB, Rubin SM, Kritchevsky SB. Socioeconomic differences in cognitive decline and the role of biomedical factors. Annals of epidemiology. 2005;15(8):564–571. doi: 10.1016/j.annepidem.2005.02.008. [DOI] [PubMed] [Google Scholar]
- Klunk WE, Engler H, Nordberg A, Wang Y, Blomqvist G, Holt DP, Långström B. Imaging brain amyloid in Alzheimer’s disease with Pittsburgh Compound B. Annals of neurology. 2004;55(3):306–319. doi: 10.1002/ana.20009. [DOI] [PubMed] [Google Scholar]
- Logan J, Fowler JS, Volkow ND, Wang GJ, Ding YS, Alexoff DL. Distribution volume ratios without blood sampling from graphical analysis of PET data. Journal of Cerebral Blood Flow & Metabolism. 1996;16(5):834–840. doi: 10.1097/00004647-199609000-00008. [DOI] [PubMed] [Google Scholar]
- Masur DM, Fuld PA, Blau AD, Thal LJ, Levin HS, Aronson MK. Distinguishing normal and demented elderly with the selective reminding test. Journal of Clinical and Experimental Neuropsychology. 1989;11(5):615–630. doi: 10.1080/01688638908400920. [DOI] [PubMed] [Google Scholar]
- Mathis CA, Wang Y, Holt DP, Huang GF, Debnath ML, Klunk WE. Synthesis and evaluation of 1 1C-labeled 6-substituted 2-arylbenzothiazoles as amyloid imaging agents. Journal of medicinal chemistry. 2003;46(13):2740–2754. doi: 10.1021/jm030026b. [DOI] [PubMed] [Google Scholar]
- Miyake A, Friedman NP, Emerson MJ, Witzki AH, Howerter A, Wager TD. The unity and diversity of executive functions and their contributions to complex “frontal lobe” tasks: A latent variable analysis. Cognitive psychology. 2000;41(1):49–100. doi: 10.1006/cogp.1999.0734. [DOI] [PubMed] [Google Scholar]
- Monsch AU, Bondi MW, Butters N, Salmon DP, Katzman R, Thal LJ. Comparisons of verbal fluency tasks in the detection of dementia of the Alzheimer type. Archives of Neurology. 1992;49(12):1253–1258. doi: 10.1001/archneur.1992.00530360051017. [DOI] [PubMed] [Google Scholar]
- Mormino EC, Betensky RA, Hedden T, Schultz AP, Amariglio RE, Rentz DM, Sperling RA. Synergistic effect of β-amyloid and neurodegeneration on cognitive decline in clinically normal individuals. JAMA neurology. 2014;71(11):1379–1385. doi: 10.1001/jamaneurol.2014.2031. [DOI] [PMC free article] [PubMed] [Google Scholar]
- Morris JC. The Clinical Dementia Rating Scale (CDR): current version and scoring rules. Neurology. 1993;43:2412–2414. doi: 10.1212/wnl.43.11.2412-a. [DOI] [PubMed] [Google Scholar]
- Mungas D, Reed BR, Jagust WJ, DeCarli C, Mack WJ, Kramer JH, Chui HC. Volumetric MRI predicts rate of cognitive decline related to AD and cerebrovascular disease. Neurology. 2002;59(6):867–873. doi: 10.1212/wnl.59.6.867. [DOI] [PMC free article] [PubMed] [Google Scholar]
- Mungas D, Harvey D, Reed BR, Jagust WJ, DeCarli C, Beckett L, Chui HC. Longitudinal volumetric MRI change and rate of cognitive decline. Neurology. 2005;65(4):565–571. doi: 10.1212/01.wnl.0000172913.88973.0d. [DOI] [PMC free article] [PubMed] [Google Scholar]
- Papp KV, Amariglio RE, Mormino EC, Hedden T, Dekhytar M, Johnson KA, Rentz DM. Free and cued memory in relation to biomarker-defined abnormalities in clinically normal older adults and those at risk for Alzheimer’s disease. Neuropsychologia. 2015;73:169–175. doi: 10.1016/j.neuropsychologia.2015.04.034. [DOI] [PMC free article] [PubMed] [Google Scholar]
- Paolo AM, Ryan JJ. Generalizability of two methods of estimating premorbid intelligence in the elderly. Archives of Clinical Neuropsychology. 1992;7(2):135–143. [PubMed] [Google Scholar]
- Petrides M, Milner B. Deficits on subject-ordered tasks after frontal-and temporal-lobe lesions in man. Neuropsychologia. 1982;20(3):249–262. doi: 10.1016/0028-3932(82)90100-2. [DOI] [PubMed] [Google Scholar]
- Price JC, Klunk WE, Lopresti BJ, Lu X, Hoge JA, Ziolko SK, Mathis CA. Kinetic modeling of amyloid binding in humans using PET imaging and Pittsburgh Compound-B. Journal of Cerebral Blood Flow & Metabolism. 2005;25(11):1528–1547. doi: 10.1038/sj.jcbfm.9600146. [DOI] [PubMed] [Google Scholar]
- Reitan RM. Manual for administration of neuropsychological test batteries for adults and children. Neuropsychology Laboratory, Indiana University medical Center; 1979. [Google Scholar]
- Rentz DM, Locascio JJ, Becker JA, Moran EK, Eng E, Buckner RL, Johnson KA. Cognition, reserve, and amyloid deposition in normal aging. Annals of neurology. 2010;67(3):353–364. doi: 10.1002/ana.21904. [DOI] [PMC free article] [PubMed] [Google Scholar]
- Rentz DM, Amariglio RE, Becker JA, Frey M, Olson LE, Frishe K, Sperling RA. Face-name associative memory performance is related to amyloid burden in normal elderly. Neuropsychologia. 2011;49(9):2776–2783. doi: 10.1016/j.neuropsychologia.2011.06.006. [DOI] [PMC free article] [PubMed] [Google Scholar]
- Ridderinkhof KR, Band GP, Logan GD. A study of adaptive behavior: Effects of age and irrelevant information on the ability to inhibit one’s actions. Acta psychologica. 1999;101(2):315–337. [Google Scholar]
- Rogalski EJ, Gefen T, Shi J, Samimi M, Bigio E, Weintraub S, Mesulam MM. Youthful memory capacity in old brains: anatomic and genetic clues from the Northwestern SuperAging Project. Journal of cognitive neuroscience. 2013;25(1):29–36. doi: 10.1162/jocn_a_00300. [DOI] [PMC free article] [PubMed] [Google Scholar]
- Rogers RD, Monsell S. Costs of a predictible switch between simple cognitive tasks. Journal of experimental psychology: General. 1995;124(2):207. [Google Scholar]
- Salthouse TA. What and when of cognitive aging. Current directions in psychological science. 2004;13(4):140–144. doi: 10.1177/0963721414535212. [DOI] [PMC free article] [PubMed] [Google Scholar]
- Saunders AM, Strittmatter WJ, Schmechel D, George-Hyslop PS, Pericak-Vance MA, Joo SH, Hulette C. Association of apolipoprotein E allele ∊4 with late-onset familial and sporadic Alzheimer’s disease. Neurology. 1993;43(8):1467–1467. doi: 10.1212/wnl.43.8.1467. [DOI] [PubMed] [Google Scholar]
- Scarmeas N, Stern Y. Cognitive reserve and lifestyle. Journal of clinical and experimental neuropsychology. 2003;25(5):625–633. doi: 10.1076/jcen.25.5.625.14576. [DOI] [PMC free article] [PubMed] [Google Scholar]
- Schuff N, Woerner N, Boreta L, Kornfield T, Shaw LM, Trojanowski JQ, Disease Neuroimaging Initiative MRI of hippocampal volume loss in early Alzheimer’s disease in relation to ApoE genotype and biomarkers. Brain. 2009;132(4):1067–1077. doi: 10.1093/brain/awp007. [DOI] [PMC free article] [PubMed] [Google Scholar]
- Shimamura AP, Jurica PJ. Memory interference effects and aging: Findings from a test of frontal lobe function. Neuropsychology. 1994;8(3):408. [Google Scholar]
- Snitz BE, Weissfeld LA, Lopez OL, Kuller LH, Saxton J, Singhabahu DM, Cohen AD. Cognitive trajectories associated with β-amyloid deposition in the oldest-old without dementia. Neurology. 2013;80(15):1378–1384. doi: 10.1212/WNL.0b013e31828c2fc8. [DOI] [PMC free article] [PubMed] [Google Scholar]
- Sperling RA, Aisen PS, Beckett LA, Bennett DA, Craft S, Fagan AM, Phelps CH. Toward defining the preclinical stages of Alzheimer’s disease: Recommendations from the National Institute on Aging-Alzheimer’s Association workgroups on diagnostic guidelines for Alzheimer’s disease. Alzheimer’s & dementia. 2011;7(3):280–292. doi: 10.1016/j.jalz.2011.03.003. [DOI] [PMC free article] [PubMed] [Google Scholar]
- Stern Y. Cognitive reserve in ageing and Alzheimer’s disease. The Lancet Neurology. 2012;11(11):1006–1012. doi: 10.1016/S1474-4422(12)70191-6. [DOI] [PMC free article] [PubMed] [Google Scholar]; Stern Y. Cognitive reserve. Neuropsychologia. 2009;47(10):2015–2028. doi: 10.1016/j.neuropsychologia.2009.03.004. [DOI] [PMC free article] [PubMed] [Google Scholar]
- Sun FW, Stepanovic MR, Andreano J, Barrett LF, Touroutoglou A, Dickerson BC. Youthful brains in older adults: Preserved neuroanatomy in the default mode and salience networks contributes to youthful memory in superaging. Journal of Neuroscience. 2016;36(37):9659–9668. doi: 10.1523/JNEUROSCI.1492-16.2016. [DOI] [PMC free article] [PubMed] [Google Scholar]
- Wechsler D. WAIS-R manual: Wechsler adult intelligence scale-revised. Psychological Corporation; 1981. [Google Scholar]
- Wechsler D. WMS-R: Wechsler memory scale-revised. Psychological Corporation; 1987. [Google Scholar]
- Wechsler D. WAIS-III: Wechsler adult intelligence scale. San Antonio, TX: Psychological Corporation; 1997. [Google Scholar]
Associated Data
This section collects any data citations, data availability statements, or supplementary materials included in this article.