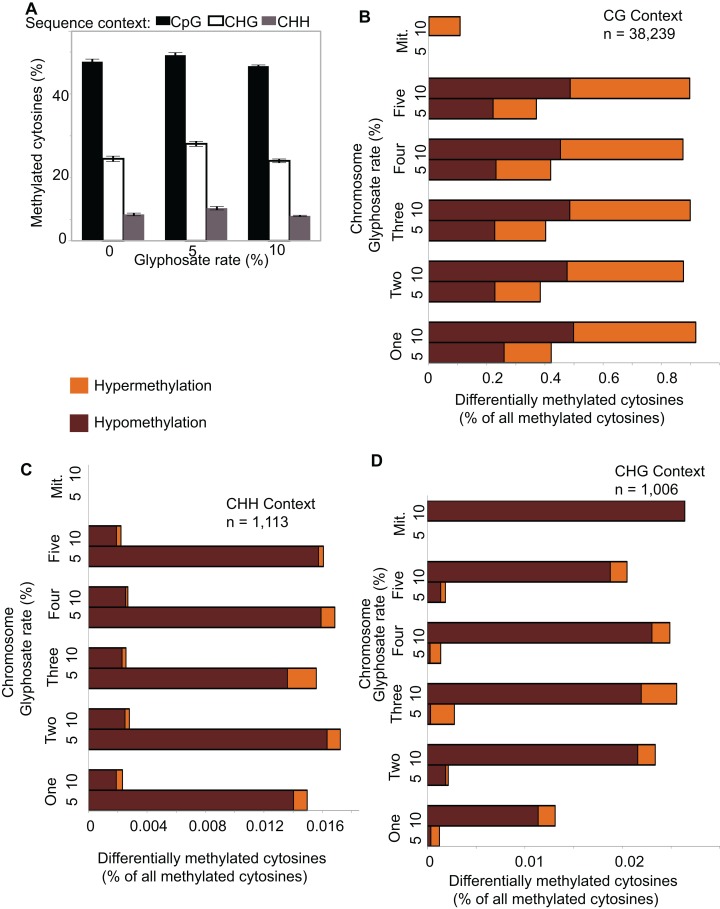
Figure 2. Global pattern of methylated cytosines (mCs) and differentially methylated cytosines (DmCs) following methylkit pipeline.
(A) Relative abundance of mCs in the three sequence contexts (CG, CHG, and CHH) following 0, 5%, or 10% of a 0.9 kg ae ha−1 glyphosate treatment to 4-week-old A. thaliana rosettes. N = 4 plants for each treatment. (B–D) Relative abundance of hyper- and hypo-methylated DmCs in the 5% and 10% glyphosate-treated samples compared to the 0% controls across all chromosomes in the CG (B), CHH (C), and CHG (D) sequence contexts. See Dataset S1 for list of all DmCs.

