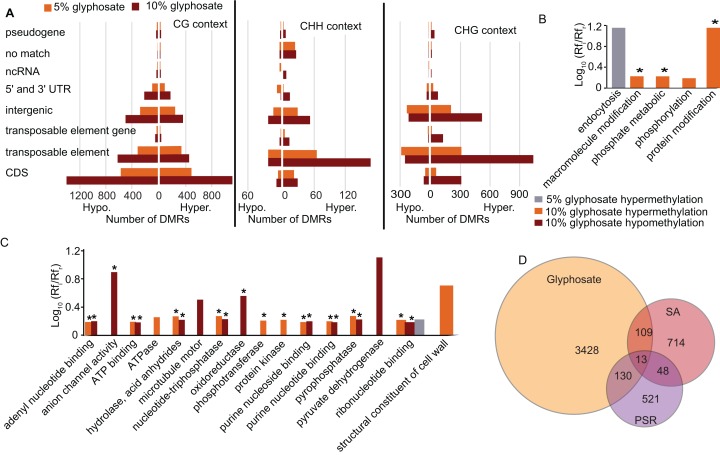
Figure 4. Location of DMRs in the A. thaliana genome and comparison to DMRs induced by other stresses.
(A) Prevalence of DMRs by annotation context in the A. thaliana genome. See Dataset S3 for annotated list of all DMRs. (B and C) Gene ontology (GO) terms for biological process (B) and molecular function (C) enriched (p < 0.05) in DMR associated genes. Rfi/Rfr represents the ratio of the relative frequency of GO terms in the input (glyphosate DMRs) to the reference (TAIR10 Arabidopsis genome) datasets. *indicates p < 0.01. Redundant GO terms excluded from the figure. See Dataset S6 for full list of GO terms with Rfi/Rfr > 1.5. (D) comparison of DMR-associated genes identified following glyphosate stress compared to DMR-associated genes previously identified as induced by biotic stress mimic (Dowen et al., 2012) or phosphate starvation (Yong-Villalobos et al., 2015). Dataset S8 lists all DMR-associated genes categorized by overlap (or lack thereof) among the three analyzed stresses.

