Abstract.
We present a fully automatic method for segmenting orbital structures (globes, optic nerves, and extraocular muscles) in CT images. Prior anatomical knowledge, such as shape, intensity, and spatial relationships of organs and landmarks, were utilized to define a volume of interest (VOI) that contains the desired structures. Then, VOI was used for fast localization and successful segmentation of each structure using predefined rules. Testing our method with 30 publicly available datasets, the average Dice similarity coefficient for right and left sides of [0.81, 0.79] eye globes, [0.72, 0.79] optic nerves, and [0.73, 0.76] extraocular muscles were achieved. The proposed method is accurate, efficient, does not require training data, and its intuitive pipeline allows the user to modify or extend to other structures.
Keywords: orbital critical structures, skull base surgery, CT imaging
1. Introduction
Recent advances in medical imaging have had a positive impact in many medical areas. In skull base surgery, the role of medical imaging is unavoidable due to the numerous vital structures in this region. Critical structures such as the optic nerve, eye globe, and extraocular muscles must be considered in the planning stage and during the surgery. Damage to these structures can cause significant patient harm from disfigurement, diplopia (or double vision) to blindness. Therefore, localization of these structures is essential pre- and intraoperatively. Preoperatively, it is important to incorporate this information into the surgical plan to minimize the disturbance to vital structures. This is critical when the surgical approach is in close proximity to these vital structures due to lesion location. Intraoperatively, identification of these structures will assist the surgeon to avoid the damage from surgical instruments, especially powered instruments such as the Microdebrider.
However, in current skull base surgeries, these structures are not segmented and surgeons use their anatomical knowledge and experiences to locate them on preoperative images or on the patient intraoperatively. This is because the available segmentation tools are limited and manual delineation of these small structures requires expert time. Although there have been many successful skull base surgeries without segmentation, damage to orbital structures is one of the common complications of these surgeries. Therefore, automated segmentation methods are preferable to better aid physicians and, more importantly, to improve the patients’ treatments and safety.
In skull base surgery and procedures such as orbital reconstruction, the CT images are the main image modality used (in planning stage and intraoperatively) due to the high intensity of the bone. In the navigated surgery, the bony structures can be used as landmarks to register and calibrate the accuracy of instruments tracking. Particularly, we are interested in the segmentation of the structures inside the orbital bone in CT. Fast delineation of these structures is beneficial in the planning stage to plan and examine different approaches and intraoperatively to avoid the chance of damage.
In CT, structures can be classified into two categories: (i) structures with distinct edges or region characteristics different from surrounding structures: examples include bony structures, (ii) structures with no clear distinct characteristics: examples include soft tissue structures.
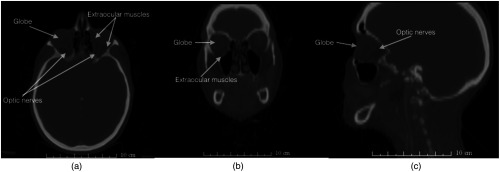
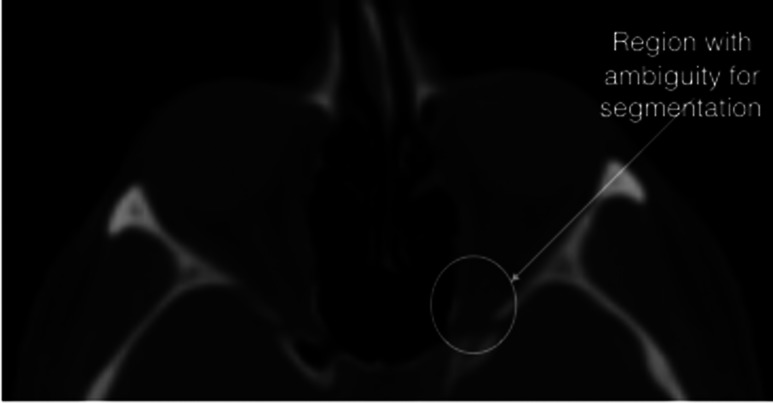
Segmentation of the soft tissue structures in CT is challenging, especially for structures with small sizes such as optic nerves (Fig. 1). Therefore, incorporating prior knowledge becomes essential. On the other hand, structures with distinct characteristics are relatively easy to segment and in cases where the image contains noise or artifacts, additional shape or intensity information can be used to accomplish the segmentation task.
Fig. 1.
Segmentation of orbital structures in CT images is challenging due to small size and low-tissue contrast (a) a representative CT axial slice (b) a representative CT coronal slice (c) a representative CT sagittal slice.
Therefore, structures with distinct characteristics can be used as stable features and prior knowledge to segment soft tissue. For instance, the spatial relationship of desired structures (with no distinct characteristics) to bony landmarks can be used as prior knowledge in the segmentation process of that structure.
Predefined rules that take into account prior information about the locations of the organs and their appearance in CT images can be used for segmentation. This rule-based approach uses anatomical context and prior knowledge, such as structures’ location and their extension for enhancing, improving, and automating the segmentation process. Furthermore, anatomical similarity allows exploitation of these rules by detecting predefined landmarks to segment the structures even where there is patient variability.
Different methods exist for the segmentation of eye globes and optic nerves. The method by Dobler et al.1 built a precise metric model of the eye for proton therapy, using ellipsoid and cylindrical shapes for different parts of the ocular system. The geometric model is adapted to the particular image volume using atlas-based image registration. Parameters for most objects are set via ultrasound measurements, and the rest is set to predetermined fixed values. In their model, the eye globe is an ellipsoid with variable length half axes and the optic nerves are not considered.
Bekes et al.2 proposed a geometric model-based method for segmentation of the eye globes, lenses, optic nerves, and optic chiasm in CT images. Sphere, cone, and cylinder shapes were used to model the above structures, respectively. To perform the segmentation, the user was required to provide seeds to define the center of eye globes and nerves.
The method by D’Haese et al.3 segments the organs of sight and some brain structures by applying predefined anatomical models that were deformed to segment the structures in target volume. The method was performed on MR images, where the contrast is better and separation of different tissue types is easier, compared to CT images.
Isambert et al.4 used single atlas registration method on MRI to segment the brain organs (including optic nerves and globes) at risk in radiation therapy. Although an excellent agreement was achieved for larger organs, for optic nerves the Dice similarity coefficient (DSC) of 0.4 to 0.5 was reported.
Gensheimer et al.5 showed that utilizing multiatlases where each atlas is registered to the target image separately improved the accuracy of the segmentation of smaller structures such as optic nerves.
Panda et al.6 used multiatlas registration method; the registration process had two steps: (1) bony structure affine registration and cropping the optic nerve regions in both target and atlases and (2) nonrigid registration of the cropped volumes. The DSC and Hausdorff distance (HD) of [0.7, 3.7] (optic nerves) and [0.8, 5.2] (for both globes and muscles) were reported.
Noble and Dawant7 proposed a segmentation method that combined the image registration techniques with structure’s shape information. The optic nerves and chiasm were modeled as a union of two tubular structures. Statistical model and image registration were used to incorporate a priori local intensity to complete the segmentation. The mean DSC of 0.8 was achieved when compared to manual segmentations over 10 test cases.
Chen and Dawant8 used a multiatlas registration method to segment the structures of head and neck. The proposed method had a global level (affine and nonrigid) registration that allowed for initial alignments of the target volume with atlases, followed by local level registration by defining a bounding box for each desired structure. For optic nerves, the average (left and right) DSC and HD of [0.6, 2.8] was reported with processing time of about 90 min.
Albrecht et al.9 used multiatlas registration followed by an active shape model fitting (for small structures) to refine the segmentation for individual organs. Rigid registration was done by detecting a set of obvious landmarks and then a nonrigid (DEEDS algorithm) for computing the deformable transformation. This transformation was used for initial alignment, then, the aim was to place the boundary points of the shape model at image points that have similar profiles. With this method, the average DSC and HD (left and right) of [0.6, 3.6] were reported and registration of target volume to each atlas took about 1 to 5 min.
With registration approaches, labeled training data are required to create an atlas or multiple atlases for improved results; labeling the data is time consuming and demands expert time. In addition, accurate registration of a test volume with the atlas depends on optimizing the large number of parameters that can be computationally expensive.
In this paper, we will describe an accurate and efficient method for segmenting the orbital structures inside the orbital bone in CT images. The process takes less than 5 min and does not require training data sets. The simple segmentation pipeline and utilizing anatomical features that are intuitive for the users (surgeons) allows them to modify and guide the result of each step in case of failure or abnormal anatomy.
The segmentation is achieved by combining multiple anatomical knowledge (geometric shape, relationship to other structures, and intensity information) with image processing techniques. Our method progressively locates anatomical landmarks to restrict the original volume to a smaller volume, which has a higher probability of containing the desired structure. Then, segmentation is performed in the smaller volume, which that makes the process more efficient and accurate.
2. Methods
The proposed technique is divided into two main parts: (1) given a patient data, find the smallest volume (which contains all desired structures) by detecting a set of anatomical landmarks and (2) on this volume, segment different structures according to predefined rules.
Based on the anatomy, the desired structures (optic nerve, globe, and extraocular muscles) are located and protected by the orbital bone. Therefore, the smallest volume containing these structures would be orbital volume (volume inside the eye socket). Furthermore, within this volume the structures are segmented in the following order: globes, optic nerve, and extraocular muscles.
In the next two sections, we describe the steps to accomplish each part of the segmentation pipeline, as shown in Fig. 2.
Fig. 2.
Two main parts of the segmentation method.
2.1. Part 1: Orbital Volume Detection
The goal of this part was to get the smallest volume (orbital volume) that contained all the desired structures. To achieve this goal, a set of landmarks were defined and the original data were updated to a smaller volume progressively. The following table summarizes the landmarks and the resulting updated volumes.
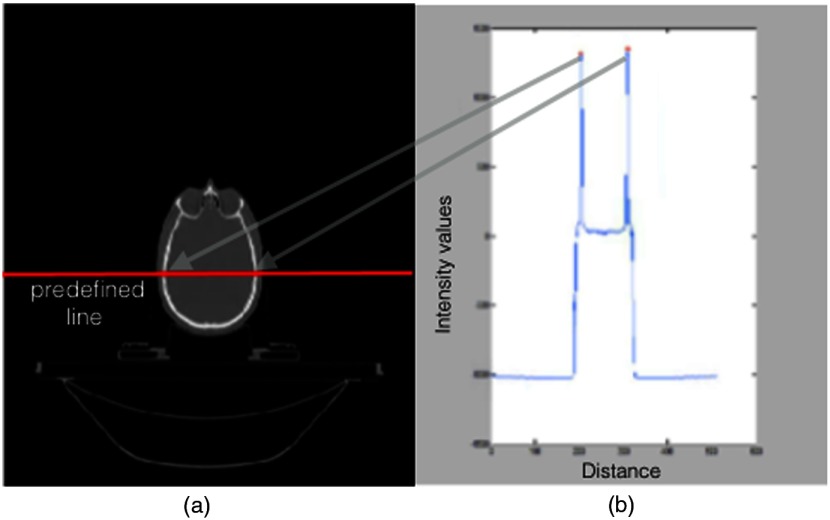
Simple thresholding using Hounsfield unit (HU) for bone and tissue produced reasonable results necessary to detect the initial landmarks. However, threshold values were verified for each data set by analyzing the intensity profile of the horizontal midline in all axial slices [Fig. 3(a)].
Fig. 3.
Threshold values were obtained by finding the local maximum (b) in intensity curve along the predefined midhorizontal line in all 2-D axial slices (a).
Intensity profile is the set of intensity values of regularly spaced points along a line segment [Fig. 3(b)]. The maximum value of the intensity curve for each slice represents the bone threshold value due to high density of the bone in CT images. In addition, the location of the maximum values on the intensity curve and their Euclidean distance represent the width of the skull in many slices (Fig. 3). If the calculated distance was not in the range of average skull width (152 to 178 mm), the intensity value of that slice was ignored. For instance, near mandible, the maximum values may be higher due to dental filling; in those slices, the distance check would be necessary to select the correct threshold. The accepted maximum intensity values of all slices was averaged and used as threshold. Verifying the HU number of the bone with the threshold value obtained by midline intensity curve would ensure that the threshold value is robust to different scanners.10 Next, the four steps of Table 1 are described in detail:
Table 1.
Segmentation steps for part 1.
| Steps | Detected landmarks | Analysis on | Input volume | Output (updated) volume |
|---|---|---|---|---|
| 1 | Nasal tip | 3-D soft tissue volume | Original patient data [Fig. 4(a)] | Skull base volume [Fig. 4(b)] |
| 2 | Nasal tip and frontal bone | 3-D bone volume | Skull base volume [Fig. 4(b)] | Subvolume: orbital floor to orbital roof [Fig. 4(c)] |
| 3 | Zygoma bone | 2-D axial bone | Subvolume: orbital floor to orbital roof [Fig. 4(c)] | Divided left and right subvolumes [Fig. 5(b)] |
| 4 | Orbital boundary bone | 2-D axial bone | Divided left and right subvolumes [Fig. 5(b)] | Left and right orbital volumes [Fig. 6(c)] |
-
•
Step 1: (input volume: original patient data; output volume: skull base volume)
The initial landmark (nasal tip) was detected by finding the intersection of an sliding plane and the point cloud representation of the soft tissue thresholded volume [Fig. 4(a)]. The skull base volume was obtained by updating the original volume using this nasal tip position.
-
•
Step 2: (input volume: skull base volume; output volume: subvolume: orbital floor to orbital roof)
Similar approach as step 1 was used to detect the nasal tip and frontal bone landmarks, except that the bone thresholded volume was used [Fig. 4(b)]. The volume between these two landmarks (output volume) was used for further processing [Fig. 4(c)].
-
•
Step 3: (input volume: subvolume: orbital floor to orbital roof; output volume: divided left and right subvolumes)
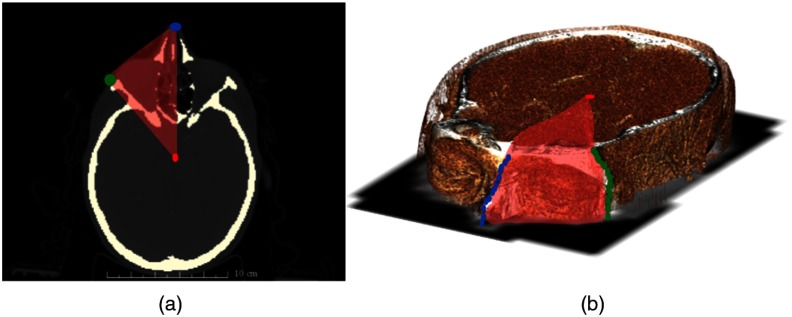
The goal of this step was to restrict volume 1 even more and divide it into the left and right sides. The Zygoma bone was detected using the bone thresholded volume 1 and determining the closest bone pixels to the top corners of the image on each two-dimensional (2-D) axial slice [Fig. 5(a)]. Therefore, the landmarks (Zygoma, nasal tip, and the center of mass) were used to form a pyramid volume to update the input volume and divide it into the left and right sides [Fig. 5(b)].
-
•
Step 4: (input volume: divided left and right subvolumes; output volume: orbital volume)
In order to get the orbital volume, the bone boundaries of the region inside the eye socket were detected in 2-D axial slices of the volume 1 (left and right) separately. On each slice, the boundaries were obtained by finding the first intersection point of the bone mask to the vertical lines parallel to image -axis and equal distances based on image resolution [Fig. 6(b)]. A cubic spline was fitted to the points for a smooth boundary on each 2-D slice [Fig. 6(c)]. Using these points, a binary mask was defined on each slice and the final orbital volume that contained all target structures (eye globe, optic nerve, and extraocular muscles) was constructed from pixels in each slice that overlapped with the binary mask.
Fig. 4.
Steps 1 and 2: (c) Initial volume of interest was obtained by restricting the original volume using anatomical landmarks such as nasal position and frontal bone represented by stars in (a) tissue and (b) bone thresholded volumes.
Fig. 5.
Step 3: Zygoma landmarks were detected on each 2-D axial slices (a). Zygoma, nasal tip, and center of mass were used to form a pyramid volume (red) and restrict the volume 1 to smaller volume (left and right) (b).
Fig. 6.
The volume obtained from a previous step [Fig. 5(b)] was restricted more by analyzing the 2D axial slices (a) a representative axial slice of the obtained volume (b) finding the intersection of the first bone pixels with equally distant vertical lines (c) fitting line to obtained points and creating a binary mask, represented by red convex plane. The final orbital volume was constructed from pixels in each slice over-lapped with binary mask.
2.2. Part 2: Extraction of Orbital Structures
The goal of part 2 was to extract each structure using the rules that incorporated the knowledge about intensity, neighborhood relations, and geometric shapes. The structures were segmented in a following order: globes, optic nerve, and extraocular muscles. After detecting each structure, the orbital volume (obtained from part 1) was updated and used to segment the next structure. The segmentation details of each structure are described now:
-
•
Eye globe segmentation: The globe segmentation was achieved in two steps: first, finding the approximate boundaries of the globe in 2-D axial slices. Second, two-dimensional (3-D) shape (sphere) fitting to the voxels (inside the approximated boundaries) for better refinement of the boundaries.
To approximate the globe boundaries: 2-D axial slices of the orbital volume were processed by analyzing the intensity distribution of the pixels along the horizontal and vertical lines parallel to image axis [Figs. 7(a) and 7(b)]. In CT images the boundary of the globe appears brighter than the surrounding tissue, therefore the derivative of each line intensity was used to detect the boundary by finding the pixel positions of the first and second peak points (maximum change in derivative). For instance, consider a horizontal intensity line the first two peak points represented the top and bottom of the globe boundary. On each slice, multiple points were obtained (two points for each line), these points were clustered with -means clustering (four clusters: top, bottom, left, and right sides of globe) [Fig. 7(c)].
While any edge detection technique (example: Canny edge detection) can be used to find the boundaries, additional processing was required to identify and separate the globe boundaries from other detected boundaries. Analyzing the intensity along the lines had the benefit of containing the extraposition information. Finally, on each 2-D axial slice, all pixels inside the detected boundaries were labeled as the approximation of the globe.
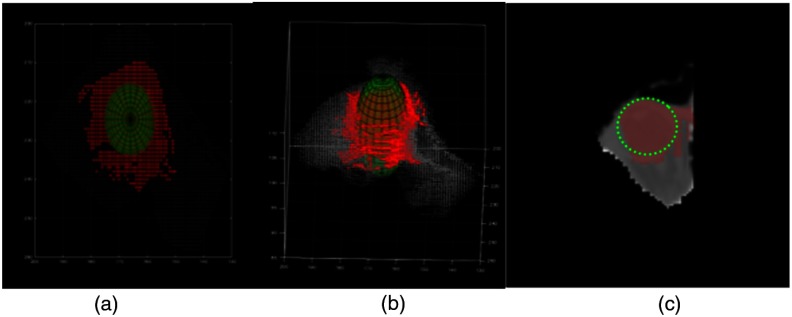
To improve the segmentation: Additional refinement was done by 3-D shape fitting. The approximated globe segmentation was converted into the point cloud representation. This step was necessary to remove regions that were not part of the globes as shown in Fig. 8(c). Due to the anatomical shape of the globe, a sphere was used to improve the segmentation [Figs. 8(a) and 8(b)]. The parameters of a sphere were found by minimizing the least square distance between the points on the surface of the sphere and globes’ voxels. Finally, the intersection of the axial plane to the sphere was labeled as final globe segmentation.
-
•
Optic nerve: To segment the optic nerve, information such as the spatial relationship to other structures, intensity, and shape was exploited. In addition, the orbital volume was updated by removing the globe segmentation, and the new volume contained the optic nerve and extraocular muscles. Hence, the goal was to detect these structures from the surrounding tissue (background) and then isolate the optic nerve from the extraocular muscles.
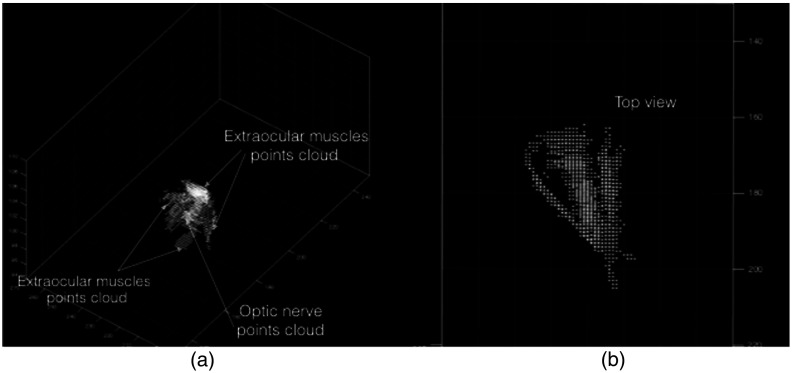
Since optic nerve and extraocular muscles had similar intensity distributions in the updated orbital volume, Otsu’s method was used to find the intensity threshold for separating the foreground (main structures) from the background (surrounding tissue). Foreground points (optic nerve and extraocular muscles) were converted to a 3-D point cloud for isolating the optic nerve (Fig. 9).
To isolate the optic nerve, the shape model and relationship with the surrounding muscles were used to define a constrained cost function.
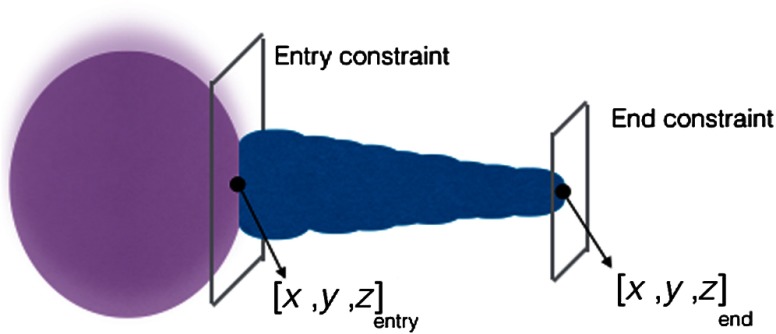
The geometric model was defined as a series of connected cylinders with decreasing radii to emphasize the optic nerve shape (Fig. 10). The shape was parameterized by two 3-D points (front and back of optic nerve) and with fixed exponential decay function () as radius.
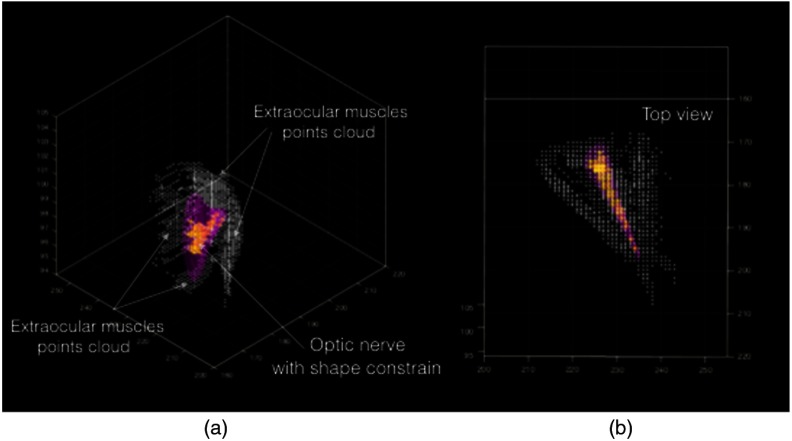
The cost function was defined as the number of foreground points inside the shape model. Having a fixed radius for the model and boundary constraints, the decision variables (the parameters of the model) would contain the foreground points of the optic nerve by maximizing the cost function. Nelder–Mead optimizer was used, which is a simplex method for multidimensional optimization without derivatives. The algorithm maintains a simplex that are approximations of an optimal point. The vertices are sorted according to the cost function values. Then, the algorithm attempts to replace the worst vertex with a new point, which depends on the worst point and the center of the best vertices.11 Figure 11(b) shows the final cylinder that maximized the cost function and foreground points inside the cylinder that was labeled as optic nerve voxels (Fig. 11).
-
•
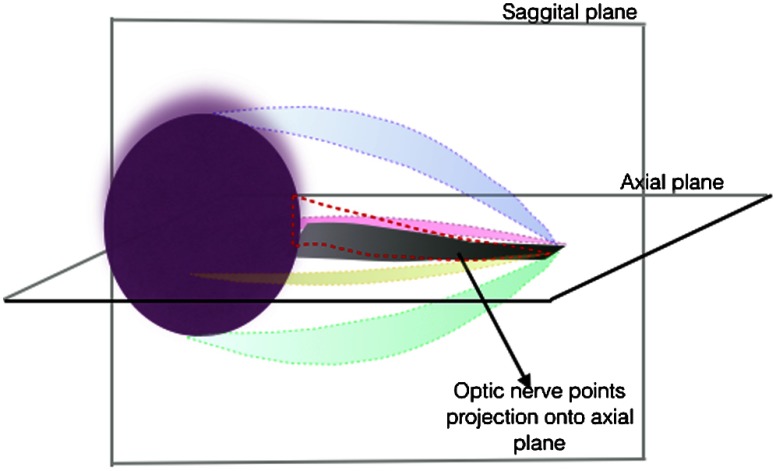
Extraocular muscles: To extract the extraocular muscles, the optic nerve points obtained from the previous step were removed from the 3-D point cloud foreground points (Fig. 11). For further segmentation of the muscles into superior, inferior, lateral, and medial rectus muscles, the relative location (above, bellow, right, and left) of remaining voxels (3-D points) relative to segmented optic nerve was considered. To improve the segmentation results, 2-D masks were created by projecting the optic nerve voxels onto the axial and sagittal planes (Fig. 12). Therefore, voxels that were above or below the optic nerve and their projection overlapped with the 2-D axial mask were labeled as superior and inferior rectus muscles, respectively. Similarly, voxels that were left or right of the optic nerve and their projection overlapped with the 2-D sagital mask were labeled as lateral and medial rectus muscles (Fig. 13).
Fig. 7.
Approximating the eye globe boundaries in 2-D slices of the orbital volume (a) analyzing the intensity profile of the image along the vertical lines (b) analyzing the intensity profile of the image along the horizontal lines (c) eye globe boundary approximation in a representative axial slice.
Fig. 8.
3-D sphere was fitted to eye globe voxels: (a) top view and (b) 3-D view. (c) 2-D visualization of eye globe pixels inside approximation boundary and slice of fitted sphere.
Fig. 9.
Point cloud representation of foreground structures (optic nerve and extraocular muscles) in orbital volume: (a) 3-D view and (b) top view.
Fig. 10.
Optic nerve model, decision variables, and constraint for optimization.
Fig. 11.
Final cylinder orientation that maximizes the number of foreground voxels (a) 3D view of the foreground point cloud and final cylinder (b) top view of the foreground point cloud and final cylinder.
Fig. 12.
Extraocular muscles.
Fig. 13.
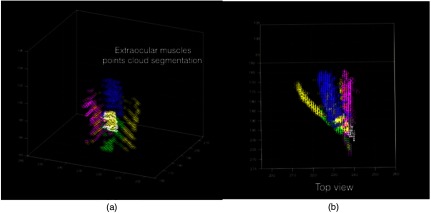
3-D point cloud representation of extra ocular muscles (a) 3-D view and (b) top view.
3. Results
3.1. Imaging Data
The imaging data used to test the described method was a subset (30 datasets) of a publicly available data set via the cancer imaging archive.12 CT images and manual segmentation of structures were in compressed NRRD format. For all datasets, the reconstructed matrix was . In-plane pixel spacing was isotropic and varied between and . The number of slices was in the range of 110 to 190 slices. The spacing in -direction was between 2 and 3 mm. Manual segmentation of globes and extraocular muscles was done by an otolaryngologist in our team. The segmentation of optic nerve was available with the data; however, it was updated to only contain the part of the optic nerve inside the orbital volume.
3.2. Evaluation Metrics
3.2.1. Dice similarity coefficient
The DSC measures the volumetric overlap between the automatic and manual segmentation.13 It is defined as
| (1) |
where and are the labeled regions that are compared. Volumes are represented by the number of voxels. The DSC can have values between 0 (no overlap) and 1 (perfect overlap).
3.2.2. Distance measure
HD measures the maximum distance of a point in a set A to the nearest point in a second set B. The distance measure we used was 95% HD, the calculation of the 95th percentile of the HD. The reason for using this metric is to measure the effect of a very small subset of inaccurate segmentation on the evaluation of the overall segmentation quality.14 The maximum and average HD were defined as
| (2) |
where
| (3) |
3.3. Numeric Results
The metrics were computed separately for left and right sides for all segmented structures. Tables 2–5 summarize the basic statistics for each metric (right and left). The full result is in Appendix A.
Table 2.
DSC statistics (right).
| Right | |||
|---|---|---|---|
| Statistics | Optic nerve | Globe | Extraocular muscle |
| Average | 0.72 | 0.81 | 0.75 |
| Std | 0.05 | 0.05 | 0.08 |
| Max | 0.83 | 0.88 | 0.90 |
| Min | 0.65 | 0.69 | 0.62 |
Table 5.
95% HD statistics in mm.
| Left | ||||||
|---|---|---|---|---|---|---|
| Statistics | Optic nerve | Globe | Extraocular muscles | |||
| Average | 5.73 | 4.24 | 3.02 | 2.62 | 3.19 | 2.44 |
| Std | 3.10 | 1.69 | 1.04 | 0.73 | 0.87 | 0.61 |
| Max | 12.87 | 8.93 | 5.00 | 4.18 | 4.75 | 4.1 |
| Min | 2.59 | 1.73 | 0.88 | 0.98 | 0.71 | 1.74 |
Table 3.
DSC statistics (left).
| Left | |||
|---|---|---|---|
| Statistics | Optic nerve | Globe | Extraocular muscle |
| Average | 0.79 | 0.79 | 0.76 |
| Std | 0.06 | 0.06 | 0.06 |
| Max | 0.92 | 0.92 | 0.84 |
| Min | 0.62 | 0.62 | 0.60 |
Table 4.
95% HD statistics in mm.
| Right | ||||||
|---|---|---|---|---|---|---|
| Optic nerve |
Globe |
Extraocular muscles |
||||
| Statistics | ||||||
| Average | 5.12 | 3.32 | 2.89 | 2.44 | 2.76 | 2.13 |
| Std | 3.00 | 1.55 | 0.73 | 0.48 | 0.97 | 0.47 |
| Max | 13.41 | 8.68 | 4.20 | 3.22 | 4.33 | 3.34 |
| Min | 2.31 | 1.73 | 0.48 | 1.39 | 0.82 | 1.29 |
4. Discussion
There is an increasing interest in the safety of endoscopic orbital and trans-orbital skull base surgery due to its less invasive approach. Navigation guidance is highly important in endoscopic surgery for pathway creation, target manipulation, and reconstruction of normal bone anatomy. A major challenge to orbital navigation is segmentation of orbital structures, such as the globe, optic nerve, and extraocular muscles. To ensure patients’ safety, localization of these critical structures would be a key step in preoperative planning and intraoperative operation. Chang et al.15 reported a case of sinus surgery in a patient with distorted anatomy during which the patient’s eye was inadvertently removed by a powered surgical instrument. Computer-assisted and automated segmentation of orbital structures provides a method for creating virtual “danger zones.” In concert with instruments that are continuously tracked in physical space, the defined danger zones would serve as an off limits boundary to shut off instrument power or deliver a warning signal for example. These cases motivate the need for efficient segmentation to save time and resources and to prevent complications.
Head and neck segmentation methods are often based on statistical models of shape/appearance or atlas-based segmentation. For both methods, large training data sets are required to create the atlas or create the models for different structures. Creating training data is time consuming and requires multiple experts time for high quality data. In addition, some of these methods have a long processing time and parameters that need to be set for acceptable results. On the other hand, for small structures such as optic nerves, results may not be accurate and therefore additional postprocessing must be considered.
Our segmentation approach was to define a set of stable landmarks relevant to desired structures. These landmarks were used to restrict the original volume to the smallest possible volume that contained that structure. Basic geometric shape models were defined and used in an optimization scheme to segment the structure. This rule-based approach was accurate and did not required training data.
Two metrics were used to evaluate the segmentation results. The DSC that measures the overlap between the segmented results and ground truth segmentation and the HD measured the maximum distance of all minimum distances of the segmented voxels to the ground truth voxels. The average DSC of [0.81, 0.72, and 0.73] (right) and [0.79, 0.79, and 0.76] (left) for eye globe, optic nerve, and extraocular muscles were achieved with our method. The average HD of [3.32, 2.44, and 2.13 mm] (right) and [4.24, 2.62, and 2.44 mm] (left) was obtained respectively for each structure.
It is generally accepted that DSC value represents excellent agreement.16 Based on this metric, all structures had a good overlap with manual segmentation (Fig. 14). In terms of accuracy, our approach is close to the work presented in Ref. 17, where mean DSC of 0.6 was reported with an average HD of 3.1 mm. The obtained results fulfilled the clinical requirements that originally motivated this work; in our case, the key points were the quick computation with minimum computational hardware for processing and training data.
Fig. 14.
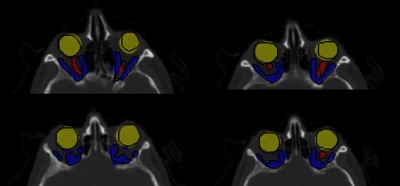
Representative slice: orbital structures segmentation with ground truth (black) boundaries.
The HD measure for globe and extraocular muscles was less than 5 mm; however, there were cases for optic nerves with large distances (). The following figure illustrated the comparison of the manual and automatic segmentation for one of these cases. The segmentation results were overlapping; however, due to low contrast in lower region, the automatic method did not capture the superior section.
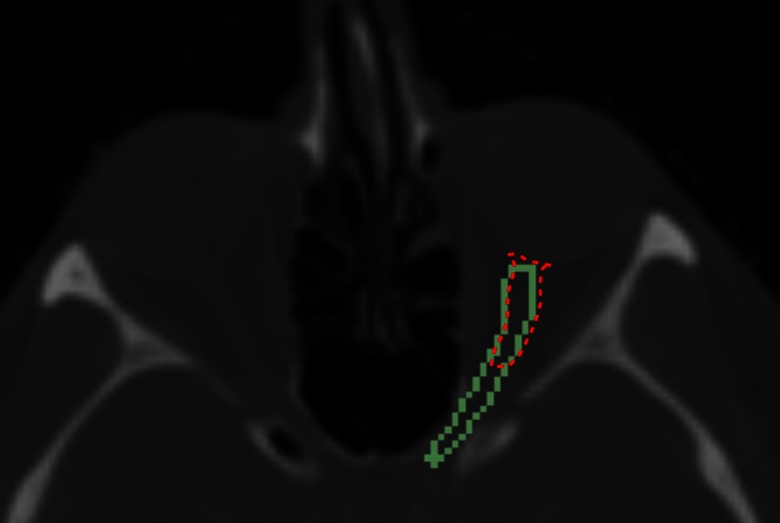
The difficulties with optic nerves segmentation were their low contrast with surrounding tissues in CT and also their small size (only present in few slices). Particularly, segmenting the optic nerves from extraocular muscles at the back of the orbit (just before orbital canal) was difficult. In this area, the optic nerves and extraocular muscles are merged. Although constraining the orbital shape with reducing radius improved the optic nerves separation, the same ambiguity was present for segmenting the extraocular muscles into different parts (Fig. 15). Our automated segmentation process is efficient (less than 5 min with MATLAB, which can be improved) and will save surgeons time from segmenting slice by slice to confirming or editing part of the results, for example, editing the optic nerve segmentation represented in Fig. 16 (data set 20 with ).
Fig. 15.
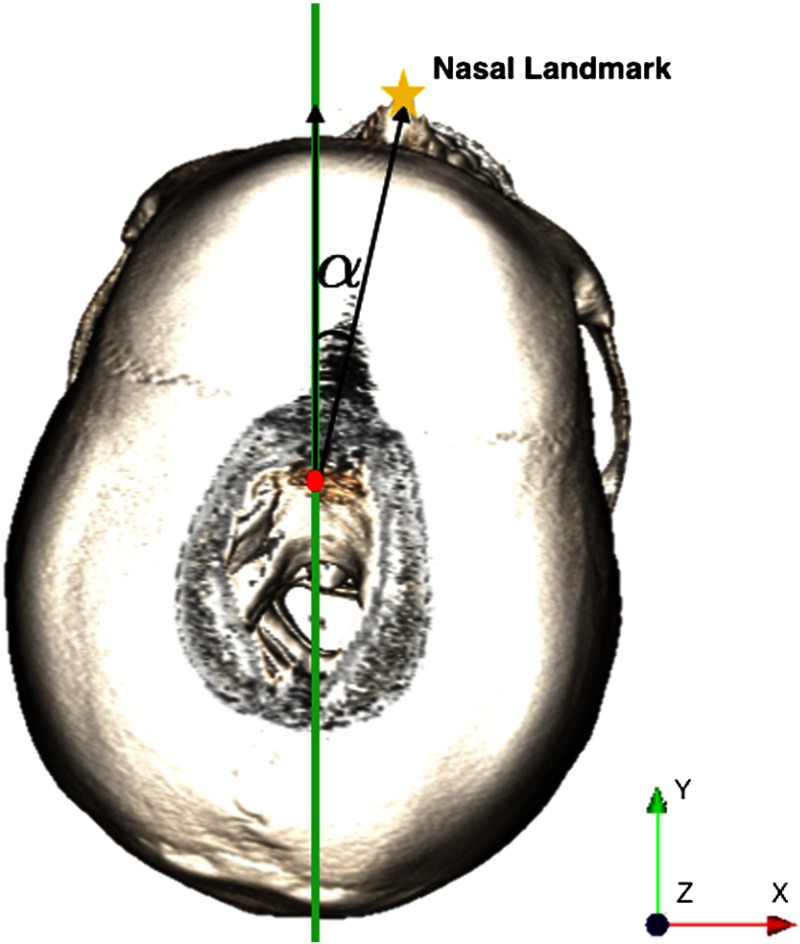
Finding the deviation angle necessary to reorienting the image.
Fig. 16.
Data set 20, comparison of manual (green) and automatic (red) segmentation
One limitation of our method is that if the patient had different orientations during the imaging, severely destructed or abnormal anatomy, the segmentation may not detect the landmarks successfully. In these cases, the segmentation must be guided by the user, for example, providing the right transformation for reorienting the image or selecting few landmarks.
However, for cases where the patient head is deviated from the midsagittal plane, the process can be automated. The angle between the midsagittal plane and the nasal position obtained from the 3-D point cloud representation of the tissue thresholded volume (in step 2 of part 1) can be used to reorient the image (Fig. 17). Therefore, the nasal position would be aligned with the mid sagittal plane.
Fig. 17.
Data set 20, (—contrast changed) in which the true length of the optic nerve is not clear.
For the cases where the angle of deviation from the midsagittal plane is large, methods such as iterative closest point can be used to find the rigid transformation of the target and a reference 3-D point cloud to reorient the target image. To get the transformation efficiently, using only one reference point cloud would be enough and in addition the bone thresholded, point clouds can be used due to its fewer number of points.
This approach can be used for segmenting other structures; however, the rules would be different for a particular structure and must be defined. The future work is to develop a software with an easy interface for surgeons to perform the segmentation by clicking through landmarks, selecting the geometric shapes, and defining simple rules. The system records and learns the landmarks, shapes, and rules to perform the segmentation for new data set. General and easy work flow allows surgeons to “demonstrate” the segmentation to the system while the system learns the process. The goal is to restrict the original volume to smaller volume by detecting the learned landmarks and performing the rules on the smallest volume.
5. Conclusion
In this paper, we illustrate a method to automatically segment the orbit and orbital structures including the globe, extraocular muscles, and optic nerve using anatomical knowledge. The segmentation process is efficient and does not require training data. Detection of reliable anatomical landmarks to restrict the original volume to smaller volume reduces the computational cost, sensitivity to image artifacts, and improves the precision.
Acknowledgments
This work was supported by the National Institutes of Health grant 5R21EB016122-02.
Biographies
Nava Aghdasi received her BS and PhD degrees in electrical engineering from the University of Washington, Seattle. Her current research interests include medical image processing, surgical pathway planning, optimization and surgical robot navigation.
Yangming Li received his BE and ME degrees from the Hefei University of Technology, China, and his PhD from the University of Science and Technology of China. Currently, he is a research associate with the Electrical Engineering Department, University of Washington, Seattle, Washington. His current research interests include mobile robots and surgical robot, navigation and manipulator control, and medical imaging processing and surgical planning.
Angelique Berens received her MD from Wayne State Medical School, Michigan. She is a resident physician in the Department of Otolaryngology–Head and Neck Surgery at the University of Washington. Her research interests include surgical motion analysis, multiportal skull base surgical planning and computer-aided orbital reconstruction. She plans to do a fellowship in facial plastic and reconstructive surgery at UCLA.
Richard A. Harbison is a resident physician in the Department of Otolaryngology–Head and Neck Surgery at the University of Washington with an interest in advancing patient safety and integrating technology into the operative theatre to improve surgical outcomes.
Kris S. Moe is a professor in the Department of Otolaryngology–Head and Neck Surgery and the Department of Neurological Surgery and chief of the Division of Facial Plastics and Reconstructive Surgery at the University of Washington, Seattle. He completed his subspecialty training at the University of Michigan, Bern and Zurich, Switzerland. Currently, his research interests include minimally invasive skull base surgery, surgical pathway planning and optimization, flexible robotics and medical instrumentation.
Blake Hannaford is a professor of electrical engineering, adjunct professor of bioengineering, mechanical engineering, and surgery at the University of Washington. He received his MS and PhD degrees in electrical engineering from the University of California, Berkeley. He was awarded the National Science Foundation’s Presidential Young Investigator Award, the Early Career Achievement Award from the IEEE Engineering in Medicine and Biology Society, and was named IEEE fellow in 2005. Currently, his active interests include surgical robotics, surgical skill modeling, and haptic interfaces.
Appendix A:
Tables 6 and 7 show the dice similarity coefficient and Hausdorff distance detailed results, respectively.
Table 6.
Dice coefficient details.
| Subjects | Right | Left | ||||
|---|---|---|---|---|---|---|
| Nerve | Globe | EO muscle | Nerve | Globe | EO muscle | |
| S1 | 0.83 | 0.81 | 0.62 | 0.67 | 0.65 | 0.77 |
| S2 | 0.81 | 0.79 | 0.63 | 0.85 | 0.85 | 0.83 |
| S3 | 0.81 | 0.84 | 0.85 | 0.72 | 0.84 | 0.60 |
| S4 | 0.8 | 0.81 | 0.71 | 0.69 | 0.78 | 0.80 |
| S5 | 0.78 | 0.84 | 0.80 | 0.66 | 0.76 | 0.70 |
| S6 | 0.78 | 0.73 | 0.65 | 0.68 | 0.77 | 0.76 |
| S7 | 0.78 | 0.82 | 0.85 | 0.65 | 0.80 | 0.80 |
| S8 | 0.77 | 0.83 | 0.70 | 0.66 | 0.81 | 0.79 |
| S9 | 0.77 | 0.77 | 0.73 | 0.79 | 0.92 | 0.80 |
| S10 | 0.74 | 0.82 | 0.65 | 0.77 | 0.81 | 0.81 |
| S11 | 0.74 | 0.79 | 0.66 | 0.74 | 0.80 | 0.75 |
| S12 | 0.72 | 0.83 | 0.72 | 0.65 | 0.70 | 0.80 |
| S13 | 0.72 | 0.77 | 0.63 | 0.74 | 0.81 | 0.76 |
| S14 | 0.72 | 0.87 | 0.70 | 0.67 | 0.82 | 0.70 |
| S15 | 0.70 | 0.77 | 0.66 | 0.67 | 0.81 | 0.76 |
| S16 | 0.70 | 0.80 | 0.90 | 0.72 | 0.83 | 0.84 |
| S17 | 0.70 | 0.81 | 0.80 | 0.75 | 0.77 | 0.67 |
| S18 | 0.70 | 0.69 | 0.80 | 0.64 | 0.85 | 0.71 |
| S19 | 0.69 | 0.78 | 0.70 | 0.76 | 0.86 | 0.65 |
| S20 | 0.69 | 0.84 | 0.79 | 0.65 | 0.82 | 0.81 |
| S21 | 0.69 | 0.83 | 0.78 | 0.72 | 0.78 | 0.72 |
| S22 | 0.74 | 0.79 | 0.71 | 0.65 | 0.80 | 0.81 |
| S23 | 0.68 | 0.85 | 0.75 | 0.67 | 0.78 | 0.66 |
| S24 | 0.68 | 0.86 | 0.85 | 0.66 | 0.78 | 0.80 |
| S25 | 0.67 | 0.87 | 0.78 | 0.70 | 0.77 | 0.81 |
| S26 | 0.67 | 0.85 | 0.78 | 0.68 | 0.80 | 0.81 |
| S27 | 0.66 | 0.82 | 0.82 | 0.61 | 0.77 | 0.79 |
| S28 | 0.68 | 0.88 | 0.80 | 0.72 | 0.85 | 0.71 |
| S29 | 0.66 | 0.71 | 0.78 | 0.67 | 0.62 | 0.72 |
| S30 | 0.65 | 0.73 | 0.79 | 0.66 | 0.76 | 0.80 |
Table 7.
95% Hausdorff distance details in mm.
| Subjects | Right () | Left () | ||||
|---|---|---|---|---|---|---|
| Nerve | Globe | Muscles | Nerve | Globe | Muscles | |
| S1 | 3.00 | 2.94 | 2.35 | 9.04 | 4.85 | 4.75 |
| S2 | 3.00 | 2.90 | 1.39 | 3.73 | 2.50 | 2.50 |
| S3 | 3.72 | 3.00 | 2.59 | 3.73 | 2.00 | 4.10 |
| S4 | 4.16 | 3.00 | 2.50 | 6.10 | 3.24 | 3.00 |
| S5 | 2.84 | 2.50 | 1.42 | 5.00 | 3.36 | 3.00 |
| S6 | 2.54 | 3.39 | 3.00 | 6.31 | 3.39 | 4.44 |
| S7 | 3.86 | 4.20 | 2.24 | 7.36 | 5.00 | 3.00 |
| S8 | 4.90 | 2.69 | 2.19 | 6.95 | 2.94 | 2.69 |
| S9 | 3.53 | 3.53 | 3.98 | 3.35 | 0.98 | 2.50 |
| S10 | 4.05 | 2.69 | 2.50 | 5.60 | 2.91 | 2.69 |
| S11 | 4.82 | 3.00 | 4.33 | 5.54 | 3.00 | 3.43 |
| S12 | 2.31 | 2.32 | 3.48 | 3.40 | 3.00 | 3.00 |
| S13 | 3.54 | 3.54 | 1.77 | 3.54 | 2.80 | 4.22 |
| S14 | 2.34 | 3.00 | 3.22 | 3.35 | 3.51 | 3.10 |
| S15 | 6.45 | 3.22 | 2.28 | 3.16 | 3.00 | 3.51 |
| S16 | 6.11 | 3.00 | 1.39 | 8.32 | 3.00 | 2.79 |
| S17 | 3.28 | 3.28 | 2.50 | 10.89 | 3.00 | 3.97 |
| S18 | 6.76 | 4.00 | 3.08 | 4.65 | 3.00 | 3.92 |
| S19 | 4.18 | 3.42 | 3.19 | 2.85 | 3.00 | 4.30 |
| S20 | 13.41 | 3.00 | 3.00 | 12.87 | 3.00 | 3.00 |
| S21 | 7.89 | 3.22 | 3.00 | 4.95 | 3.40 | 3.87 |
| S22 | 2.59 | 3.22 | 3.48 | 8.52 | 3.00 | 3.24 |
| S23 | 5.18 | 2.73 | 3.86 | 5.72 | 3.70 | 4.36 |
| S24 | 3.95 | 2.50 | 1.32 | 7.89 | 2.94 | 2.69 |
| S25 | 7.33 | 2.50 | 3.55 | 3.75 | 3.56 | 2.87 |
| S26 | 2.50 | 2.50 | 2.79 | 3.50 | 2.79 | 2.22 |
| S27 | 8.20 | 3.00 | 3.00 | 9.08 | 3.21 | 3.01 |
| S28 | 3.53 | 1.86 | 1.27 | 2.82 | 1.86 | 2.18 |
| S29 | 4.21 | 3.22 | 3.00 | 3.62 | 4.89 | 3.21 |
| S30 | 4.18 | 2.94 | 2.69 | 7.46 | 5.00 | 3.94 |
Disclosures
Authors have no competing interests to declare.
References
- 1.Dobler B., Bendl R., “Precise modelling of the eye for proton therapy of intra-ocular tumors,” Phys. Med. Biol. 47(4), 593–613 (2002). 10.1088/0031-9155/47/4/304 [DOI] [PubMed] [Google Scholar]
- 2.Bekes G., et al. , “Geometrical model-based segmentation of the organs of sight on ct images,” Med. Phys. 35(2), 735–743 (2008). 10.1118/1.2826557 [DOI] [PubMed] [Google Scholar]
- 3.D’Haese P., et al. , “Automatic segmentation of brain structures for radiation therapy planning,” Proc. SPIE 5032, 517 (2003). 10.1117/12.480392 [DOI] [Google Scholar]
- 4.Isambert A., et al. , “Evaluation of an atlas-based automatic segmentation software for the delineation of brain organs at risk in a radiation therapy clinical context,” Radiother. Oncol. 87(1), 93–99 (2008). 10.1016/j.radonc.2007.11.030 [DOI] [PubMed] [Google Scholar]
- 5.Gensheimer M., et al. , “Automatic delineation of the optic nerves and chiasm on CT images,” Proc. SPIE 6512, 651216 (2007). 10.1117/12.711182 [DOI] [Google Scholar]
- 6.Panda S., et al. , “Robust optic nerve segmentation on clinically acquired CT,” Proc. SPIE 9034, 90341G (2014). 10.1117/12.2043715 [DOI] [PMC free article] [PubMed] [Google Scholar]
- 7.Noble J. H., Dawant B. M., “Automatic segmentation of the optic nerves and chiasm in CT and MR using the atlas-navigated optimal medial axis and deformable-model algorithm,” Proc. SPIE 7259, 725916 (2009). 10.1117/12.810941 [DOI] [PMC free article] [PubMed] [Google Scholar]
- 8.Chen A., Dawant B. M., “A multi-atlas approach for the automatic segmentation of multiple structures in head and neck CT images,” Presented in Head and Neck Auto-Segmentation Challenge (MICCAI), Munich (2015). [Google Scholar]
- 9.Albrecht T., et al. , “Multi atlas segmentation with active shape model refinement for multi-organ segmentation in head and neck cancer radiotherapy planning,” Presented in Head and Neck Auto-Segmentation Challenge (MICCAI), Munich (2015). [Google Scholar]
- 10.Lamba R., et al. , “CT Hounsfield numbers of soft tissues on unenhanced abdominal CT scans: variability between two different manufacturers MDCT scanners,” IEEE Trans. Med. Imaging 203(5), 1013–1020 (2014). 10.2214/AJR.12.10037 [DOI] [PMC free article] [PubMed] [Google Scholar]
- 11.Nelder J. A., Mead R., “A simplex method for function minimization,” Comput. J. 7(4), 308–313 (1965). 10.1093/comjnl/7.4.308 [DOI] [Google Scholar]
- 12.University of Arkansas for Medical Sciences, “Cancer Treatment and Diagnosis,” National Cancer Institute, Cancer Imaging Archive; (2015). [Google Scholar]
- 13.Aljabar P., et al. , “Multi-atlas based segmentation of brain images: atlas selection and its effect on accuracy,” NeuroImage 46(3), 726–738 (2009). 10.1016/j.neuroimage.2009.02.018 [DOI] [PubMed] [Google Scholar]
- 14.Huttenlocher D. P., Klanderman G. A., Rucklidge W. J., “Comparing images using the Hausdorff distance,” IEEE Trans. Pattern Anal. Mach. Intell. 15(9), 850–863 (1993). 10.1109/34.232073 [DOI] [Google Scholar]
- 15.Chang J. R., Grant M. P., Merbs S. L., “Enucleation as endoscopic sinus surgery complication,” JAMA Ophthalmol. 133(7), 850–852 (2015). 10.1001/jamaophthalmol.2015.0706 [DOI] [PubMed] [Google Scholar]
- 16.Zijdenbos A. P., et al. , “Morphometric analysis of white matter lesions in MR images: method and validation,” Am. J. Roentgenol. 13(4), 716–724 (1994). 10.1109/42.363096 [DOI] [PubMed] [Google Scholar]
- 17.Raudaschl P. F., et al. , “Evaluation of segmentation methods on head and neck CT: auto-segmentation challenge 2015,” Med. Phys. 44(5), 2020–2036 (2017). 10.1002/mp.12197 [DOI] [PubMed] [Google Scholar]


