

Abstract
SNPs&GO is a machine learning method for predicting the association of single amino acid variations (SAVs) to disease, considering protein functional annotation. The method is a binary classifier that implements a Support Vector Machine algorithm to discriminate between disease-related and neutral SAVs. SNPs&GO combines information from protein sequence with functional annotation encoded by Gene Ontology terms. Tested in sequence mode on more than 38,000 SAVs from the SwissVar dataset, our method reached 81% overall accuracy and an area under the receiving operating characteristic curve (AUC) of 0.88 with low false positive rate.
In almost all the editions of the Critical Assessment of Genome Interpretation (CAGI) experiments, SNPs&GO ranked among the most accurate algorithms for predicting the effect of SAVs. In this paper we summarize the best results obtained by SNPs&GO on disease related variations of four CAGI challenges relative to the following genes: CHEK2 (CAGI 2010), RAD50 (CAGI 2011), p16-INK (CAGI 2013) and NAGLU (CAGI 2016). Result evaluation provides insights about the accuracy of our algorithm and the relevance of GO terms in annotating the effect of the variants. It also helps to define good practices for the detection of deleterious SAVs.
INTRODUCTION
Large-scale genomic experiments are generating a huge amount of genetic variants whose effect is still unknown (Capriotti, et al., 2012). Among all possible genetic alterations, Single Nucleotide Variants (SNVs) are the most frequent type of variants between individual genomes (Durbin, et al., 2010) and nonsynonymous SNVs (inducing single amino acid variants in the encoded protein) are the variant class most frequently associated with disease. Despite the improvements in the characterization of the human genome, the relationship between genotype and phenotype is still an open problem. In this context, the development of more accurate methods for the detection and annotation of SNVs becomes one of the key challenges for personalized medicine (Fernald, et al., 2011). During the last few years, several initiatives have been established to promote, disseminate, and evaluate research in the field of disease-associated phenomics. International consortiums have collected data from thousands of individuals for defining functional regions of the human genome (Consortium, 2012; Durbin, et al., 2010) and for characterizing the landscape of genetic alterations associated to human pathologies (Cancer Genome Atlas Research, et al., 2013; International Cancer Genome, et al., 2010). At the same time, many meetings contributed to the dissemination of the increasing number of computational methods (Niroula and Vihinen, 2016) for the identification and annotation of the genetic variants (Bromberg, et al., 2016; Oetting, 2011). Finally, in silico experiments with different computational challenges were organized to evaluate the available tools for predicting the impact of genetic variants and/or the association between genotype and phenotype (Brownstein, et al., 2014; Saez-Rodriguez, et al., 2016). Among the computational experiments, the Critical Assessment for Genome Interpretation (CAGI) provided several blind datasets for testing the accuracy of the predictive algorithms (https://genomeinterpretation.org/). The Bologna Biocomputing Group and the BioFolD Unit, as active members of this community, participated in all the CAGI editions since 2010 submitting predictions for many challenges adopting SNPs&GO (Calabrese, et al., 2009; Capriotti, et al., 2013). SNPs&GO is a Support Vector Machine-based approach to predict the impact of single amino acid variations (SAVs). Our method takes in input information extracted from the protein sequence profile and functional information encoded through the Gene Ontology terms. In a previous independent evaluation, SNPs&GO was scored among the most accurate methods for predicting the impact of SAVs (Thusberg, et al., 2011). In this work, we analyze the best predictions submitted using two versions of SNPs&GO, trained on data sets of different size and performing among the state-of-the-art predictors (Calabrese, et al., 2009; Capriotti, et al., 2013). The assessment of the results of the four challenges of the CAGI experiments confirmed that SNPs&GO consistently scores among the best methods for predicting the impact of SAVs.
MATERIAL AND METHODS
SNPs&GO predictions
SNPs&GO is a Support Vector Machine-based approach that takes in input information from protein sequence and function. SNPs&GO internally runs a BLAST (Altschul, et al., 1997) search against the UniRef90 database (Suzek, et al., 2007) to build the protein sequence profile. Functional information encoded by Gene Ontology (GO) terms are extracted from UniProt database (Magrane and UniProt, 2011). For each GO term, all the human proteins reported in SwissVar database (Mottaz, et al., 2010) are collected and a log-odd score (LGO) is calculated as the logarithm of the fraction of disease and neutral SAVs. Thus, the functional score of each protein is obtained by summing the LGO values of the associated GO terms and their parents in the Gene Ontology rooted graph. The SNPs&GO functional score contributes to the performance of our method providing an empirical estimation of the probability of having a deleterious SAV in a protein, given the associated GO terms.
The prediction output of SNPs&GO is a score ranging between 0 and 1 that represents the probability of a SAV to be pathogenic. By construction, a threshold (t) of 0.5 is selected to discriminate between benign (t≤0.5) and pathogenic (t>0.5) SAVs. Depending on the score, a Reliability Index ranging from 0 to 10 is defined to estimate the level of confidence of the prediction. In this paper we considered two versions of SNPs&GO: the first version (SNPs&GO09) implemented before 2009 (Calabrese, et al., 2009) used by the Biocomputing Group and the updated version (SNPs&GO13) used and maintained by the BioFolD Unit (Capriotti, et al., 2013). With respect to the older version of SNPs&GO, the new one has been trained on an updated version of the SwissVar database (Mottaz, et al., 2010) including ~4,700 more SAVs (~14%). Furthermore, the conservation and functional scores are calculated using updated versions of the UniRef90 database and Gene Ontology which correspond to ~8,900 more sequences with at least one associated GO term (32%).
CHEK2 challenge (CAGI 2010)
For the CHEK2 challenge, predictors were asked to classify variants as occurring in breast cancer cases or controls and to provide an estimation of the probability of a given variant to be in the case set (fcase).
We focused our analysis on the subset of 32 SAVs (MUT-CHEK2). We predicted the probability fcase with SNPs&GO09 (fpcase), considering both the binary prediction (Disease/Neutral) and the Reliability index (RI); predictions were transformed into probability with a linear function so that fpcase = 1 corresponds to Disease predictions with RI=10, and fpcase = 0 corresponds to Neutral predictions with RI = 10. The list of MUT-CHEK2 variants with the experimental values of fcase (fecase) was released (Le Calvez-Kelm, et al., 2011) and it is reported in Table S1, along with predictions performed with SNP&GO09, SIFT (Ng and Henikoff, 2003), and AlignGVGD (Mathe, et al., 2006). To evaluate quality of the predictions, we transformed the experimental fcase (fecase) in a binary classification (Pathogenic/Benign), by applying a threshold equal to 0.7 (which represents the median of the optimal fecase using the default prediction thresholds). If fecase >0.7, the variation is classified as Pathogenic, otherwise Benign (see Supplementary Materials). For the predicted fcase (fpcase), the thresholds were selected by maximizing the performance of each method (see Supplementary Materials). With this assumption, the MUT-CHEK2 dataset is divided, on the basis of fecase, in 21 pathogenic and 11 benign SAVs and the performance of the algorithms was calculated using the standard evaluation measures for binary classifiers (see Supplementary Materials). For the CHEK2 challenge, we compared the performance of SNPs&GO09 (Calabrese, et al., 2009) with SIFT (Ng and Henikoff, 2003) and AlignGVGD (Mathe, et al., 2006) which have been used by the assessors as baseline methods. More information about the CHEK2 challenge is available in Supplementary Materials and at http://goo.gl/2WIr6M.
RAD50 dataset (CAGI 2011)
As in the case of CHEK2, also for this challenge SNPs&GO09 was used to predict the probability of each variant to be in the case set. With SNPs&GO, we scored the pathogenicity of 35 SAVs (MUT-RAD50) carried by up to 20 individuals. The MUT-RAD50 list of variations and the associated predictions are reported in Table S2. This list of variants has been released in a recent publication (Damiola, et al., 2014). As we did for the CHEK2 challenge, we classified each variant according to the fraction of carriers in the case set (fecase) defined in Eq. S3. Using a threshold of 0.7 the MUT-RAD50 set splits in 17 pathogenic and 18 benign missense SNVs. More information about the RAD50 challenge is available in Supplementary Materials and at http://goo.gl/y4nwl1.
p16INK4A challenge (CAGI 2013)
For the p16 challenge in CAGI 2013, predictors were asked to estimate the proliferation rates (p) of mutation-like cells. Considering experimental results, a score of 0.50 was assigned to samples with same proliferation rate as the control; variations leading to an increase or decrease of the proliferation rate are labeled with a score higher (up to 1) or lower (down to 0) than 0.5, respectively. We predicted the proliferation rates with SNPs&GO13, using the raw output of the method, which represents the probability of a variant to be related to disease. The list of variations and the associated predictions are reported in Table S3. The data providers also included a set 19 proliferation rates from mutation-like cells as possible training set (TRAIN-P16). For the p16 challenge we compared the prediction submitted by the BioFolD Unit using SNPs&GO13 and Dr.Cancer (Capriotti and Altman, 2011) with the most accurate prediction in the CAGI assessment, developed by the SPARKS-Lab (http://sparks-lab.org/), and implementing a method specifically optimized on the TRAIN-P16 dataset. More information about the p16 challenge is available in Supplementary Materials and at http://goo.gl/51hGuZ.
NAGLU challenge (CAGI 2016)
For the NAGLU challenge, CAGI 2016 participants were asked to predict the relative change in enzymatic activity (RelAct) associated to each SAV. In this paper we perform the a posteriori comparison of the submitted predictions obtained with SNPs&GO09 (Calabrese, et al., 2009) with the most accurate predictions in the CAGI assessment, performed with MutPred (Li, et al., 2009). In this analysis we include the new predictions from the last version of SNPs&GO13 (Capriotti, et al., 2013), which were not submitted to the CAGI. The list of the NAGLU amino acid variations and the associated predictions are reported in Table S4. More information about the NAGLU challenge is available in the Supplementary Materials and at http://goo.gl/wp17aB.
Comparison with other methods
In this study, we compared two versions of SNPs&GO (SNPs&GO09, SNPs&GO13) with other computational methods. In detail, for the CHEK2 and RAD50 challenges we compared SNPs&GO09 predictions submitted by the Biocomputing Group with AlignGVGD (Mathe, et al., 2006) and SIFT (Ng and Henikoff, 2003). Align-GVGD, which has been used by the assessor as baseline method, is a program that combines the biophysical characteristics of amino acids and protein multiple sequence alignments. It is based on the calculation of Grantham score (Grantham, 1974) on a multiple sequence alignment. AlignGVGD classifies SAVs in 7 classes from C0 to C65, which correspond respectively to the lowest and highest level of enrichment for pathogenic variants. For the AlignGVGD predictions, we used the precalculated multiple sequence alignments including all the sequences from Homo sapiens to Sea urchin (see http://agvgd.hci.utah.edu/).
SIFT is one of the most popular tools for scoring the impact of genetic variants based on sequence homology. The algorithm is based on the assumption that important amino acids will be conserved in the protein family, and changes at well-conserved positions tend to be predicted as deleterious. SIFT returns a probabilistic score ranging from 0 to 1, which represents the normalized probability that an amino acid change is tolerated. In standard predictions, variations with score below 0.05 are classified as pathogenic. The predictions from SIFT algorithm were calculated using the web server http://sift.bii.a-star.edu.sg/ with default parameters.
Although AlignGVGD and SIFT are not among the most updated tools currently available for predicting the impact of the genetic variations, we included them is our analysis as baseline methods to compare with SNPs&GO. This is in agreement with the procedure followed by the assessor of CHEK2 and RAD50 challenges, who selected AlignGVGD as reference for benchmarking the different predictors.
For the p16INKA4 challenge we compared the predictions of SNPs&GO13 and Dr.Cancer (Capriotti and Altman, 2011) submitted by the BioFolD Unit with those from an ad hoc method implemented by the SPARK-LAB. Dr.Cancer is a modification of the SNPs&GO algorithm that is based on the slim version of the Gene Ontology (http://geneontology.org/page/go-slim-and-subset-guide). The disease-specific method has been trained and tested on a set of more than 3,000 cancer-causing variants. Similarly to SNPs&GO, Dr.Cancer returns in output a score from 0 to 1 representing the probability of a SAVs of being cancer-causing. The SPARK-LAB method used SVM with linear kernel trained on the TRAIN-P16 dataset. The input features of the algorithm include a combination of the Position Specific Scoring Matrix (PSSM) values for wild-type and mutant residues and the predicted free energy change upon single amino acid variation computed by ROSETTA3 (Leaver-Fay, et al., 2011) and dMutant (Zhou and Zhou, 2002).
For the NAGLU challenge, only the binary predictions derived from SNPs&GO09 were officially submitted by the Bologna Biocomputing Group. To better evaluate the accuracy of our algorithm, we compared the predictions from SNPs&GO09 with those from the latest version of SNPs&GO (SNPs&GO13) maintained by the BioFolD Unit and two versions of MutPred2 algorithm (Li, et al., 2009). In details, for MutPred2, we considered the predictions of the algorithm running in default mode (MutPred2) and the predictions without gene-level homology count features (MutPred2*). MutPred2 is a machine learning approach based on an ensemble of neural networks trained on a combination of features including the SIFT output, conservation scores and predicted structural and functional residue-properties. Similarly to SNPs&GO, MutPred2 output represents the probability that the amino acid substitution is deleterious.
For the NAGLU challenge, SNPs&GO13 and MutPred2 predictions were obtained subtracting the raw outputs to one.
Prediction evaluation
The evaluation of the accuracy of computational methods for variant annotation is a difficult task whose solution depends on the complexity of the prediction. For the CAGI challenges here discussed, we use two evaluation systems. The first evaluation is based on the regression between the experimental and predicted values (rPearson) and their ranking (rSpearman,rKendallTau). For this test, the Root Mean Square Error (RMSE) after linear fitting is also calculated. The second evaluation is based on the standard evaluation measures for binary classifiers reported in a recent paper (Vihinen, 2012; Vihinen, 2013). They are: true positive and negative rates (TPR, TNR – also referred as sensitivity and specificity), positive and negative predicted values (PPV, NPV) Overall Accuracy (Q2), Matthews Correlation coefficient (MC) and Area Under the Receiver Operating Characteristic Curve (AUC). The thresholds for the classification of the experimental and predicted data were optimized for each challenge. More details about the evaluation measures and classification thresholds used for the evaluation of the CHEK2, RAD50, p16 and NAGLU challenges are described in Supplementary Materials.
RESULTS
CHEK2 and RAD50 challenges
The CHEK2 and RAD50 challenges run in the first two editions of the CAGI experiments. For these challenges the predictors were asked to estimate the probability of a carrier of a specific single amino acid variation (SAV) to be in the case set (fcase). The predictions were evaluated by Sean Tavtigian (University of Utah), who also provided the experimental data for both challenges. According to his assessment, we compared the prediction performed with SNPs&GO09 with those performed with AlignGVGD and SIFT, by estimating the evaluation measures for binary classification (Q2, FPR, TPR, NPV, PPV, AUC, MC) and regression (RMSE, rPearson, rSpearman, rKendallTau) described in Supplementary Material. The performances of the three predictors for the CHEK2 and RAD50 challenges are summarized in Tables 1 and 2. SNPs&GO09 resulted in better performance than SIFT and AlignGVGD in the regression tests (RMSE, rPearson, rSpearman, rKendallTau). Although all the predictors achieved relatively low correlation coefficient values, SNPs&GO is the only one scoring with a consistently significant rKendall/Tau (p-value < 0.05). It must be noted that the experimental values of fecase are biased towards the extreme values: SAVs with of fecase either equal to 0 or 1 correspond to 78% and 74% of the CHEK2 and RAD50 datasets respectively. This bias can hamper the estimation of the correlation coefficients.
Table 1.
Performance of the predictors for the CHEK2 challenge (CAGI 2010).
| Method | Q2 | TPR | PPV | TNR | NPV | AUC | MC | RMSE | rPearman | rSpearman | rKendallTau |
|---|---|---|---|---|---|---|---|---|---|---|---|
| SNPs&GO09 | 0.72 | 0.81 | 0.77 | 0.55 | 0.60 | 0.73 | 0.36 | 0.46 | 0.29 | 0.32 | 0.25 |
| SIFT | 0.69 | 0.95 | 0.69 | 0.18 | 0.67 | 0.53 | 0.22 | 0.43 | 0.19 | 0.10 | 0.08 |
| AlignGVGD | 0.66 | 0.67 | 0.78 | 0.64 | 0.50 | 0.70 | 0.29 | 0.67 | 0.32 | 0.26 | 0.25 |
The Overall Accuracy (Q2), True Positive/Negative Rates (TPR/TNR), Positive/Negative Predicted Values (PPV/NPV), Area Under the ROC Curve (AUC) and Matthews Correlation coefficient (MC) are calculated using an fecase threshold of 0.70 for dividing cases from controls. The Positive and Negative classes refer to Pathogenic and Benign variations respectively. For SNPs&GO09, SIFT and AlignGVGD the fpcase thresholds are 0.35, 0.60 and C0, respectively. All the binary (Q2, TPR, TNR, PPV, NPV, AUC, MC) and regression (RMSE, rPearson, rSpearman, rKendallTau) evaluation measures are described in Supplementary Material. The confusion matrices for calculating the performance of the binary classifiers are reported in Table S5. Bold correlation coefficients correspond to p-values<0.05. The SNPs&GO09 p-value for the Spearman test is 0.07.
Table 2.
Performance of the predictors for the RAD50 challenge (CAGI 2011).
| Method | Q2 | TPR | PPV | TNR | NPV | AUC | MC | RMSE | rPearson | rSpearman | rKendallTau |
|---|---|---|---|---|---|---|---|---|---|---|---|
| SNPs&GO09 | 0.66 | 0.41 | 0.78 | 0.89 | 0.62 | 0.64 | 0.34 | 0.64 | 0.27 | 0.32 | 0.28 |
| SNPs&GO09* | 0.73 | 0.57 | 1.00 | 1.00 | 0.57 | 0.82 | 0.57 | 0.66 | 0.43 | 0.62 | 0.56 |
| SIFT | 0.63 | 0.65 | 0.61 | 0.61 | 0.65 | 0.57 | 0.26 | 0.49 | 0.12 | 0.23 | 0.19 |
| AlignGVGD | 0.57 | 0.12 | 1.00 | 1.00 | 0.55 | 0.55 | 0.25 | 0.68 | 0.08 | 0.08 | 0.07 |
SNPs&GO09* refers to the performance on the subset of 11 amino acid variations in the Zn hook and P-loop hydrolase domains. The Overall Accuracy (Q2), True Positive/Negative Rates (TPR/TNR), Positive/Negative Predicted Values (PPV/NPV), Area Under the ROC Curve (AUC) and Matthews Correlation coefficient (MC) are calculated using an fecase threshold of 0.70 for dividing cases from controls. The Positive and Negative classes refer to Pathogenic and Benign variations respectively. For SNPs&GO09, SIFT and AlignGVGD the fpcase thresholds are 0.10, 0.15 and C35 respectively. All the binary (Q2, TPR, TNR, PPV, NPV, AUC, MC) and regression (RMSE, rPearson, rSpearman, rKendallTau) evaluation measures are described in Supplementary Material. The confusion matrices for calculating the performance of the binary classifiers are reported in Table S5. Bold correlation coefficients correspond to p-values<0.05. The SNPs&GO09 p-value for the Spearman test is 0.06.
In a second test, we evaluated the performances of SNPs&GO09, SIFT and AlignGVGD as binary classifiers. For each method, we transformed the probability predictions into classes by optimizing the separating threshold. For each method and challenge, the threshold is the value maximizing the product among overall accuracy (Q2), area under the ROC curve (AUC) and Matthews correlation coefficient (MC), as described in Supplementary Materials. With this procedure, SNPs&GO09 reaches a good performance on the CHEK2 dataset showing an overall accuracy of 72%, a Matthews Correlation coefficient of 0.36 and an AUC of 0.73 when the output threshold is set to 0.35.
For the RAD50 challenge, SNPs&GO09 shows better performance than the other methods and the performance becomes significantly better when we focus on the variations in the Zn hook and P-loop hydrolase domains. On this subset of 11 SAVs, SNPs&GO09 achieves good performances both in the binary classification and regression tests. For the RAD50 challenge, SIFT resulted in better performance than AlignGVGD in terms of overall accuracy but both methods showed AUCs close to the those of the random predictors.
p16 challenge
For the p16 challenge, predictors were asked to estimate the proliferation rate of mutation-like cells with respect to wild-type cells (RelPro). In this experiment, a prediction near 0.5 indicates a proliferation rate similar to wild type cell while values close to 1 are associated to the highest proliferation rates in mutated cells. Here we compared the predictions of SNPs&GO13 and Dr.Cancer submitted by the BioFolD Unit with the most successful predictions submitted by the SPARK-LAB. With this comparison we show that the automatic methods (SNPs&GO13 and Dr.Cancer) can achieve similar level of accuracy with respect to the SPARK-LAB algorithm, which has been specifically developed for the p16 challenge. Our comparison based on a regression test (Table 3), reveals that SPARK-LAB predictions achieved better correlation coefficients. In details, SPARK-LAB results in 0.16 better rPearson, rSpearman, with respect to SNPs&GO13. The difference in the value of rKendallTau is ~0.09. After plotting the linear regression curves between predicted and experimental values (Fig. 1), we noticed that the difference in the performances is mainly due to the wrong prediction of the amino acid variation p.Gly23Ala. As shown in Fig. 1, removing prediction of the amino acid variation p.Gly23Ala in the calculation, the rPearson values, the SPARK-LAB method and SNPs&GO13 differ by 0.02. According to the suggestion of CAGI assessors, the predictors were also evaluated as binary classifiers (Carraro et al. 2017). In Table 3 we reported the performance considering all predictions with score higher than 0.75 as deleterious variants. With this assumption, we observed a decreasing level of accuracy going from SPARK-LAB to Dr.Cancer predictions. Despite of the differences in the scores, it is still remarkable that a general method like SNPs&GO resulted in good level of performance with respect to the problem specific method developed by the SPARK-LAB. The analysis of the assessors showed that SNPs&GO and Dr.Cancer score among the best predictors for this challenge.
Table 3.
Performance of the predictors for the p16 challenge (CAGI 2013).
| Method | Q2 | TPR | PPV | TNR | NPV | AUC | MC | RMSE | rPearson | rSpearman | rKendallTau |
|---|---|---|---|---|---|---|---|---|---|---|---|
| SPARK-LAB | 0.90 | 0.80 | 1.00 | 1.00 | 0.83 | 0.92 | 0.82 | 76 | 0.83 | 0.87 | 0.69 |
| SNPs&GO13 | 0.70 | 1.00 | 0.63 | 0.40 | 1.00 | 0.88 | 0.50 | 76 | 0.66 | 0.81 | 0.60 |
| Dr.Cancer | 0.60 | 1.00 | 0.56 | 0.20 | 1.00 | 0.84 | 0.33 | 76 | 0.58 | 0.67 | 0.47 |
The Overall Accuracy (Q2), True Positive/Negative Rates (TPR/TNR), Positive/Negative Predicted Values (PPV/NPV), Area Under the ROC Curve (AUC) and Matthews Correlation coefficient (MC) are calculated using an experimental Relative Proliferation (RelPro) rate threshold of 75 and a predicted threshold of 0.75. The Positive and Negative classes refer to Pathogenic and Benign variations respectively. All the binary (Q2, TPR, TNR, PPV, NPV, AUC, MC) and regression (RMSE, rPearson, rSpearman, rKendallTau) evaluation measures are described in Supplementary Material. The confusion matrices for calculating the performance of the binary classifiers are reported in Table S5. Bold correlation coefficients correspond to p-values<0.05.
Figure 1.
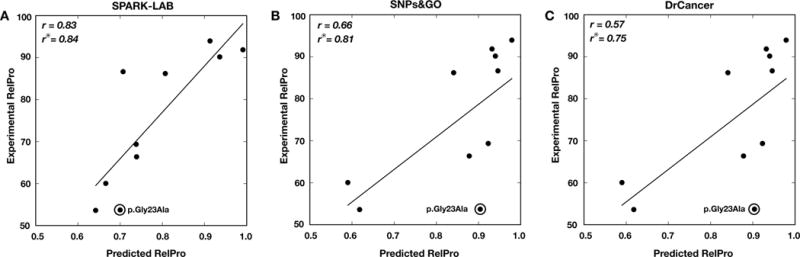
Comparison between predicted and experimental Relative Proliferation (RelPro) rates for the p16 challenge. Linear regression for SPARK-LAB (A), SNPs&GO13 (B) and Dr.Cancer (C) predictions. r and r° are the Pearson’s correlation coefficients with and without the amino acid variation p.Gly23Ala respectively.
NAGLU challenge
For the NAGLU challenge, the participants were asked to predict the value of the relative enzymatic activity (RelAct) of the mutated NAGLU with respect to the wild-type. In this experiment, predictions close to one correspond to SAV with similar enzymatic activity with respect to the wild-type. RelAct equal to zero is associated to the variants with no enzymatic activity. We used SNPs&GO by setting the relative enzymatic activity equal to 1 minus the probability for the variant to be related to disease.
In our analysis, we compared the performance of two versions of MutPred2 with the two versions of SNPs&GO (SNPs&GO09 and SNPs&GO13). The MutPred2 predictions were performed in default mode (MutPred2) and without gene-level homology count features (MutPred2*).
For SNPs&GO, the first set of predictions has been submitted by the Bologna Biocomputing Group using SNPs&GO09. The second set of predictions, which were not submitted to the CAGI experiments, have been directly derived from the raw output of the last version of SNPs&GO (SNPs&GO13), maintained by the BioFolD Unit. For the NAGLU challenge we reported the results of the regression and binary classification tests in Table 4. Our analysis shows that the accuracy of SNPs&GO13 is comparable to MutPred2*, which is the best method for this challenge. The average difference in the correlation coefficients between SNPs&GO13 and MutPred2* is ~0.02. The results of the binary classification test, performed by optimizing the RelAct thresholds for all the methods and by considering the same output classification threshold equal to 0.5, confirms the similarity between the performance of SNPs&GO13 and MutPred2*. Indeed, SNPs&GO13 and MutPred2* achieve the same overall accuracy and AUC (with RelAct thresholds equal to 0.28 and 0.34, respectively). In Fig. 2 we also show that the performance of SNPs&GO13 and MutPred2* in terms of Q2, AUC and MC are consistently similar at different RelAct threshold.
Table 4.
Performance of the predictors for the NAGLU challenge (CAGI 2016).
| Method | Q2 | TPR | PPV | TNR | NPV | AUC | MC | RMSE | rPearson | rSpearman | rKendallTau |
|---|---|---|---|---|---|---|---|---|---|---|---|
| MutPred2* | 0.80 | 0.88 | 0.80 | 0.70 | 0.81 | 0.85 | 0.60 | 0.30 | 0.60 | 0.61 | 0.43 |
| MutPred2 | 0.68 | 0.38 | 0.69 | 0.89 | 0.68 | 0.79 | 0.31 | 0.30 | 0.51 | 0.54 | 0.37 |
| SNPs&GO13 | 0.80 | 0.87 | 0.82 | 0.69 | 0.77 | 0.84 | 0.58 | 0.32 | 0.56 | 0.58 | 0.42 |
| SNPs&GO09 | 0.72 | 0.70 | 0.82 | 0.74 | 0.61 | 0.72 | 0.43 | 0.48 | 0.42 | 0.43 | 0.35 |
The Overall Accuracy (Q2), True Positive/Negative Rates (TPR/TNR), Positive/Negative Predicted Values (PPV/NPV), Area Under the ROC Curve (AUC) and Matthews Correlation coefficient (MC) are computed by choosing the threshold maximizing their product. The best performance for MutPred2*, MutPred2, SNPs&GO13 and SNPs&GO09 are obtained using an experimental Relative Activity (RelAct) threshold equal to 0.34, 0.55, 0.28 and 0.28 respectively. A threshold on the prediction equal to 0.5 is considered for all the methods. The Positive and Negative classes refer to Pathogenic and Benign variations respectively. All the binary (Q2, TPR, TNR, PPV, NPV, AUC, MC) and regression (RMSE, rPearson, rSpearman, rKendallTau) evaluation measures are described in Supplementary Material. The confusion matrices for calculating the performance of the binary classifiers are reported in Table S5. Bold correlation coefficients correspond to p-values<0.05.
Figure 2.
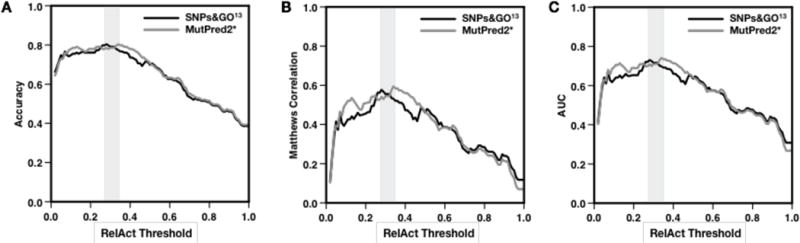
Comparison between the binary classification performance of SNPs&GO13 (black) and MutPred2* (gray) on the NAGLU dataset.
DISCUSSION
In this work we analyzed the performance of SNPs&GO algorithm in predicting the impact of single amino acid variations (SAVs). From 2010, the Bologna Biocomputing Group and the BioFolD Unit participated in all the editions of the CAGI experiments with two different versions of SNPs&GO, namely SNPs&GO09 and SNPs&GO13. The first version of SNPs&GO (SNPs&GO09), used by the Bologna Biocomputing Group, resulted among the best algorithm for predicting the impact on SAVs in CHEK2 and RAD50 challenges. The last version of SNPs&GO (SNPs&GO13), maintained by BioFolD unit, was successful in scoring the impact of genetic variants in the latest CAGI challenges (p16 and NAGLU). In particular, the predictions submitted by the BioFolD Unit were among the most accurate in the prediction of the impact of the p16INK4A variants. In our a posteriori evaluation of non-submitted predictions for the NAGLU challenge, SNPs&GO13 resulted in performance similar to the best version of MutPred2 algorithm.
Our analysis shows that the automatic annotation of SAVs with our tools scores better when predicting the functional impact of the variants (p16 and NAGLU challenges in Tables 3 and 4) than the frequency of disease variant carriers (fcase) (CHEK2 and RAD50 challenges in Tables 1 and 2). This observation derives from the comparison of the correlation coefficients for the p16 and NAGLU challenges (in almost all the cases above 0.5) with those of the CHEK2 and RAD50 challenges (around 0.29).
The better performance of the last version of SNPs&GO13 with respect to the oldest SNPs&GO09, is likely due to the more informative training set, in terms of the number of sequences available for alignments in the newer version of UniRef90 and variations in the training set as collected from SwissVar. In particular, for the NAGLU challenge, the release of SwissVar used for the training of SNPs&GO09 contained only 25 disease-related SAVs, which is significantly lower than the 67 disease-related amino acid variants present in the more recent version of SwissVar used for training SNPs&GO13.
In general, it is difficult to evaluate the gain in the performance associated to the improvement of the Gene Ontology annotations. Nevertheless, comparing the SNPs&GO with AlignGVGD and SIFT in the CHEK2 and RAD50 challenges, we learnt that the functional contribution to the predictions is particularly helpful when evolutionary information is not discriminative enough. Finally, we would like to point-out that the improvement in the performance obtained by SNPs&GO09 in the RAD50 challenge on the subset of variants falling in specific protein domains (Table 2), support the notion that evolution information is important for the quality of the prediction. Indeed, conserved regions, such as protein domains, result in more informative sequence alignments.
In the case of multiple SAVs in the same position, evolutionary information may be not sufficient for discrimination and other features (such as physicochemical characteristics, steric hindrance, solvent accessibility, specific position in the protein structure) may be relevant for discriminating disease related from neutral variations. SNPs&GO is based on sequence and function.
CONCLUTIONS
The analysis of the results of four CAGI challenges (CHEK2, RAD50, p16, NAGLU) shows that SNPs&GO was consistently among the best algorithms for predicting the effect of the single amino acid variations. Although the prediction of the real value of the functional impact is still a difficult task, SNPs&GO have shown a good level of generalization reaching good performance as a binary classifier when the predictions are directly generated from the raw output without any gene/problem-specific customization.
Supplementary Material
Acknowledgments
E.C. acknowledges the computational resources accessed at the Geneifx - Genome Informatics Service at the University of Alabama at Birmingham, AL (USA) and the Institute for Mathematical Modeling of Biological Systems at the University of Düsseldorf (Germany).
FUNDING
This work was partially supported by: PRIN 2010–2011 project 20108XYHJS (to P.L.M.) (Italian MIUR); COST BMBS Action TD1101 and Action BM1405 (European Union RTD Framework Program, to R.C); PON projects PON01_02249 and PAN Lab PONa3_00166 (Italian MIUR to R.C. and P.L.M.); FARB UNIBO 2012 (to R.C.). The CAGI experiment coordination is supported by NIH U41 HG007346 and the CAGI conference by NIH R13 HG006650.
Footnotes
Availability: SNPs&GO is accessible at http://snps.biofold.org/snps-and-go or http://snps-and-go.biocomp.unibo.it
DISCLOSURE STATEMENT
The authors declare that they have no conflict of interests.
References
- Altschul SF, Madden TL, Schaffer AA, Zhang J, Zhang Z, Miller W, Lipman DJ. Gapped BLAST and PSI-BLAST: a new generation of protein database search programs. Nucleic Acids Res. 1997;25(17):3389–402. doi: 10.1093/nar/25.17.3389. [DOI] [PMC free article] [PubMed] [Google Scholar]
- Bromberg Y, Capriotti E, Carter H. VarI-SIG 2015: methods for personalized medicine - the role of variant interpretation in research and diagnostics. BMC Genomics. 2016;17(Suppl 2):425. doi: 10.1186/s12864-016-2721-3. [DOI] [PMC free article] [PubMed] [Google Scholar]
- Brownstein CA, Beggs AH, Homer N, Merriman B, Yu TW, Flannery KC, DeChene ET, Towne MC, Savage SK, Price EN, et al. An international effort towards developing standards for best practices in analysis, interpretation and reporting of clinical genome sequencing results in the CLARITY Challenge. Genome Biol. 2014;15(3):R53. doi: 10.1186/gb-2014-15-3-r53. [DOI] [PMC free article] [PubMed] [Google Scholar]
- Calabrese R, Capriotti E, Fariselli P, Martelli PL, Casadio R. Functional annotations improve the predictive score of human disease-related mutations in proteins. Hum Mutat. 2009;30(8):1237–44. doi: 10.1002/humu.21047. [DOI] [PubMed] [Google Scholar]
- Cancer Genome Atlas Research N. Weinstein JN, Collisson EA, Mills GB, Shaw KR, Ozenberger BA, Ellrott K, Shmulevich I, Sander C, Stuart JM. The Cancer Genome Atlas Pan-Cancer analysis project. Nat Genet. 2013;45(10):1113–20. doi: 10.1038/ng.2764. [DOI] [PMC free article] [PubMed] [Google Scholar]
- Capriotti E, Altman RB. A new disease-specific machine learning approach for the prediction of cancer-causing missense variants. Genomics. 2011;98(4):310–7. doi: 10.1016/j.ygeno.2011.06.010. [DOI] [PMC free article] [PubMed] [Google Scholar]
- Capriotti E, Calabrese R, Fariselli P, Martelli PL, Altman RB, Casadio R. WS-SNPs&GO: a web server for predicting the deleterious effect of human protein variants using functional annotation. BMC Genomics. 2013;14(Suppl 3):S6. doi: 10.1186/1471-2164-14-S3-S6. [DOI] [PMC free article] [PubMed] [Google Scholar]
- Capriotti E, Nehrt NL, Kann MG, Bromberg Y. Bioinformatics for personal genome interpretation. Brief Bioinform. 2012;13(4):495–512. doi: 10.1093/bib/bbr070. [DOI] [PMC free article] [PubMed] [Google Scholar]
- Consortium EP. An integrated encyclopedia of DNA elements in the human genome. Nature. 2012;489(7414):57–74. doi: 10.1038/nature11247. [DOI] [PMC free article] [PubMed] [Google Scholar]
- Damiola F, Pertesi M, Oliver J, Le Calvez-Kelm F, Voegele C, Young EL, Robinot N, Forey N, Durand G, Vallee MP, et al. Rare key functional domain missense substitutions in MRE11A, RAD50, and NBN contribute to breast cancer susceptibility: results from a Breast Cancer Family Registry case-control mutation-screening study. Breast Cancer Res. 2014;16(3):R58. doi: 10.1186/bcr3669. [DOI] [PMC free article] [PubMed] [Google Scholar]
- Durbin RM, Abecasis GR, Altshuler DL, Auton A, Brooks LD, Gibbs RA, Hurles ME, McVean GA. A map of human genome variation from population-scale sequencing. Nature. 2010;467(7319):1061–73. doi: 10.1038/nature09534. [DOI] [PMC free article] [PubMed] [Google Scholar]
- Fernald GH, Capriotti E, Daneshjou R, Karczewski KJ, Altman RB. Bioinformatics challenges for personalized medicine. Bioinformatics. 2011;27(13):1741–8. doi: 10.1093/bioinformatics/btr295. [DOI] [PMC free article] [PubMed] [Google Scholar]
- Grantham R. Amino acid difference formula to help explain protein evolution. Science. 1974;185(4154):862–4. doi: 10.1126/science.185.4154.862. [DOI] [PubMed] [Google Scholar]
- International Cancer Genome C. Hudson TJ, Anderson W, Artez A, Barker AD, Bell C, Bernabe RR, Bhan MK, Calvo F, Eerola I, et al. International network of cancer genome projects. Nature. 2010;464(7291):993–8. doi: 10.1038/nature08987. [DOI] [PMC free article] [PubMed] [Google Scholar]
- Le Calvez-Kelm F, Lesueur F, Damiola F, Vallee M, Voegele C, Babikyan D, Durand G, Forey N, McKay-Chopin S, Robinot N, et al. Rare, evolutionarily unlikely missense substitutions in CHEK2 contribute to breast cancer susceptibility: results from a breast cancer family registry case-control mutation-screening study. Breast Cancer Res. 2011;13(1):R6. doi: 10.1186/bcr2810. [DOI] [PMC free article] [PubMed] [Google Scholar]
- Leaver-Fay A, Tyka M, Lewis SM, Lange OF, Thompson J, Jacak R, Kaufman K, Renfrew PD, Smith CA, Sheffler W, et al. ROSETTA3: an object-oriented software suite for the simulation and design of macromolecules. Methods Enzymol. 2011;487:545–74. doi: 10.1016/B978-0-12-381270-4.00019-6. [DOI] [PMC free article] [PubMed] [Google Scholar]
- Li B, Krishnan VG, Mort ME, Xin F, Kamati KK, Cooper DN, Mooney SD, Radivojac P. Automated inference of molecular mechanisms of disease from amino acid substitutions. Bioinformatics. 2009;25(21):2744–50. doi: 10.1093/bioinformatics/btp528. [DOI] [PMC free article] [PubMed] [Google Scholar]
- Magrane M, UniProt C. UniProt Knowledgebase: a hub of integrated protein data. Database (Oxford) 2011;2011:bar009. doi: 10.1093/database/bar009. [DOI] [PMC free article] [PubMed] [Google Scholar]
- Mathe E, Olivier M, Kato S, Ishioka C, Hainaut P, Tavtigian SV. Computational approaches for predicting the biological effect of p53 missense mutations: a comparison of three sequence analysis based methods. Nucleic Acids Res. 2006;34(5):1317–25. doi: 10.1093/nar/gkj518. [DOI] [PMC free article] [PubMed] [Google Scholar]
- Mottaz A, David FP, Veuthey AL, Yip YL. Easy retrieval of single amino-acid polymorphisms and phenotype information using SwissVar. Bioinformatics. 2010;26(6):851–2. doi: 10.1093/bioinformatics/btq028. [DOI] [PMC free article] [PubMed] [Google Scholar]
- Ng PC, Henikoff S. SIFT: Predicting amino acid changes that affect protein function. Nucleic Acids Res. 2003;31(13):3812–4. doi: 10.1093/nar/gkg509. [DOI] [PMC free article] [PubMed] [Google Scholar]
- Niroula A, Vihinen M. Variation Interpretation Predictors: Principles, Types, Performance, and Choice. Hum Mutat. 2016;37(6):579–97. doi: 10.1002/humu.22987. [DOI] [PubMed] [Google Scholar]
- Oetting WS. Exploring the functional consequences of genomic variation: the 2010 Human Genome Variation Society Scientific Meeting. Hum Mutat. 2011;32(4):486–90. doi: 10.1002/humu.21443. [DOI] [PubMed] [Google Scholar]
- Saez-Rodriguez J, Costello JC, Friend SH, Kellen MR, Mangravite L, Meyer P, Norman T, Stolovitzky G. Crowdsourcing biomedical research: leveraging communities as innovation engines. Nat Rev Genet. 2016;17(8):470–86. doi: 10.1038/nrg.2016.69. [DOI] [PMC free article] [PubMed] [Google Scholar]
- Suzek BE, Huang H, McGarvey P, Mazumder R, Wu CH. UniRef: comprehensive and non-redundant UniProt reference clusters. Bioinformatics. 2007;23(10):1282–8. doi: 10.1093/bioinformatics/btm098. [DOI] [PubMed] [Google Scholar]
- Thusberg J, Olatubosun A, Vihinen M. Performance of mutation pathogenicity prediction methods on missense variants. Hum Mutat. 2011;32(4):358–68. doi: 10.1002/humu.21445. [DOI] [PubMed] [Google Scholar]
- Vihinen M. How to evaluate performance of prediction methods? Measures and their interpretation in variation effect analysis. BMC Genomics. 2012;13(Suppl 4):S2. doi: 10.1186/1471-2164-13-S4-S2. [DOI] [PMC free article] [PubMed] [Google Scholar]
- Vihinen M. Guidelines for reporting and using prediction tools for genetic variation analysis. Hum Mutat. 2013;34(2):275–82. doi: 10.1002/humu.22253. [DOI] [PubMed] [Google Scholar]
- Zhou H, Zhou Y. Distance-scaled, finite ideal-gas reference state improves structure-derived potentials of mean force for structure selection and stability prediction. Protein Sci. 2002;11(11):2714–26. doi: 10.1110/ps.0217002. [DOI] [PMC free article] [PubMed] [Google Scholar]
Associated Data
This section collects any data citations, data availability statements, or supplementary materials included in this article.