Graphical Abstract
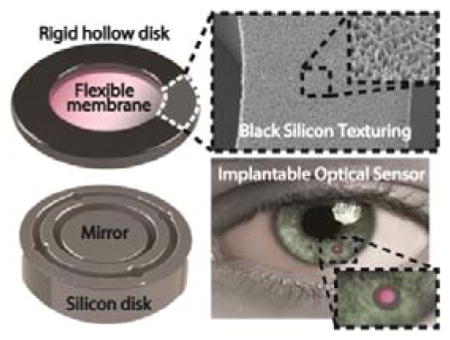
Multifunctional black silicon (b-Si) integrated on the surface of an implantable intraocular pressure (IOP) sensor significantly improves sensor performance and reliability in 6-month in-vivo studies. The anti-reflective properties of b-Si triples the signal-to-noise ratio and increases the optical readout distance to a clinically viable 12 cm. Tissue growth and inflammation response on the sensor is suppressed demonstrating desirable anti-biofouling properties.
Keywords: optical readout, intraocular pressure (IOP), black-silicon, in-vivo monitoring, glaucoma
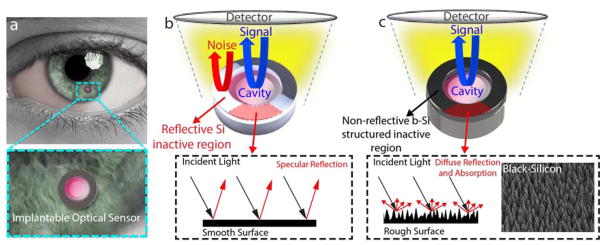
Burgeoning research on implantable medical microdevices has been actively driving the development of multifunctional biomaterials to improve device performance and reliability [1–5]. Black silicon (b-Si) or nano-grass, a textured silicon (Si) surface with micro- and nanoscale high aspect-ratio topologies, is known to possess highly useful surface properties [6–8] and has been used in a myriad of applications such as in light-absorbing anti-reflection layers in photovoltaics and surface-enhanced Raman scattering [9–12], bonding layers in microelectromechanical systems (MEMS) [13], liquid-guiding layers in microfluidics [14, 15], and bio-inspired/mimetic functional surfaces [16]. In the current work, we demonstrated the use of b-Si as an anti-reflection and anti-biofouling layer on an optically probed implantable intraocular pressure (IOP) sensor and significantly improved its optical performance and long-term in-vivo biocompatibility and reliability. The b-Si enabled IOP monitoring at 12 cm on fully awake rabbits, the largest readout distance reported to our knowledge [17–20] (Fig. 1), and demonstrated remarkable antifouling properties analogous to biological nanostructures found in nature [11, 21, 22], preventing encapsulating tissue growth on the implant. To our knowledge, this is the first in-vivo demonstrated use of b-Si as a multifunctional biomaterial on an implantable medical sensor.
Figure 1. b-Si structured IOP sensor.
(a) Conceptual illustration of the implantable IOP sensor with a microscale optical cavity and a zoomed-in image. (b) A Si-only sensor consisting of an active core cavity and a reflective peripheral inactive region. Reflection arises from both the cavity (shown in blue) and the Si (shown in red). (c) A b-Si sensor with integrated b-Si on the inactive hollow disk. Only the reflection from the core cavity is captured. The inset is a SEM image of the b-Si grown on the inactive region.
The implantable IOP sensor recently reported is a microscale optical cavity made of two separate parts: a deformable transparent silicon-nitride (Si3N4) membrane on top of a reflective Si surface, separated by a 4-μm air gap (Fig. S1a) [23]. The top and bottom parts are fabricated individually and assembled under a microscope using medical grade epoxy to form a hermetically sealed optical cavity at 1 atm. The pressure difference between the interior and exterior of the cavity deflects the flexible membrane and changes the size of the gap, consequently shifting the cavity’s optical resonance. To measure IOP, broadband near-infrared (NIR) light generated by a tungsten bulb is exposed onto the core cavity of the sensor implanted inside the anterior chamber of the eye through a tabletop microscope at 2–3 cm, and a commercially available mini-spectrometer connected to the microscope is used to detect the reflected optical resonance spectrum and convert it to the corresponding IOP level (Fig. S1b) [24]. In-vivo measurements using this system require test animals to be under anesthesia.
A more practical IOP-sensing approach demands for the adaptation of easy-to-use readout systems such as a common ophthalmic microscope. This requires a longer optical readout distance and an expanded field-of-view, which inevitably increase background noise detection. The noise reflected from the cornea, lens, iris, or aqueous humor are not significant because of their low reflectivities, about 3% or smaller [25]. However, the inactive region of the sensor is a highly reflective Si surface and is coaxially aligned with the detector (Fig. 1b), generating strong background noise and degrades the SNR of the sensor.
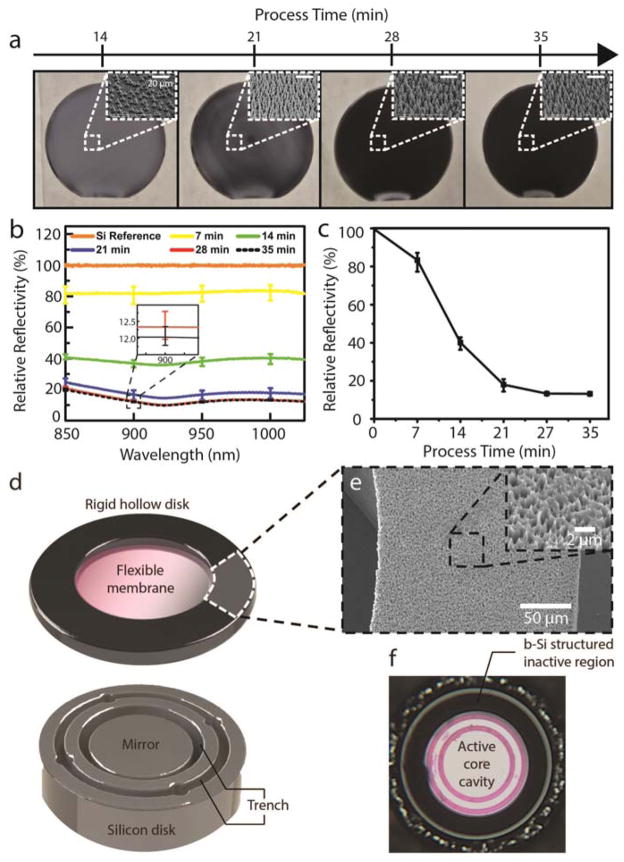
In order to suppress the background noise from the inactive regions of the sensor, anti-reflective b-Si was integrated on the inactive region of the sensor (Fig. 1b, 1c). The b-Si effectively scatters incoming light and significantly increases its absorption [26, 27]. A room-temperature b-Si process was developed using a mixed-mode plasma etch, which did not require an expensive cryogenic setup or a time-consuming cooling process (Fig. 2) [26–32]. The b-Si growth was seamlessly integrated with the existing IOP sensor fabrication process (Fig. S3) [23, 24]. Varying the process conditions, b-Si nanostructures were successfully optimized to obtain the anti-reflection properties in the wavelength range of interest (Fig. 2a, b, c; Fig. S2). Integrating the b-Si on the inactive region lowered reflectivity down to 10% of a polished Si surface and produced 3.5% absolute reflectivity (Fig. 2d, e, f; Fig. S3). This improvement in the signal-to-noise ratio (SNR) allowed a slit-lamp, the most commonly utilized clinical ophthalmic microscope, to be used as a readout system and accomplish in-vivo IOP monitoring on rabbits that were fully awake.
Figure 2. b-Si process development and IOP sensor integration.
(a) Wafer-scale b-Si process performed on 6-inch wafers (insets: SEM images taken at 45°; scale: 20 μm). (b) Relative reflectivity of b-Si surface vs. the wavelength range of interest for 5 different process durations (5-point measurements). The inset shows a zoomed-in image of the error bars for 28- and 35-minute process times. (c) Wavelength-averaged relative reflectivity vs. process time. (d) b-Si textured inactive region on the top and a Si mirror on the bottom. (e) SEM image of the b-Si-textured inactive region. Scale bar: 50 μm. Inset: magnified SEM image of the b-Si surface. Scale: 2 μm. (f) A photograph of an assembled IOP sensor with the b-Si-textured inactive region.
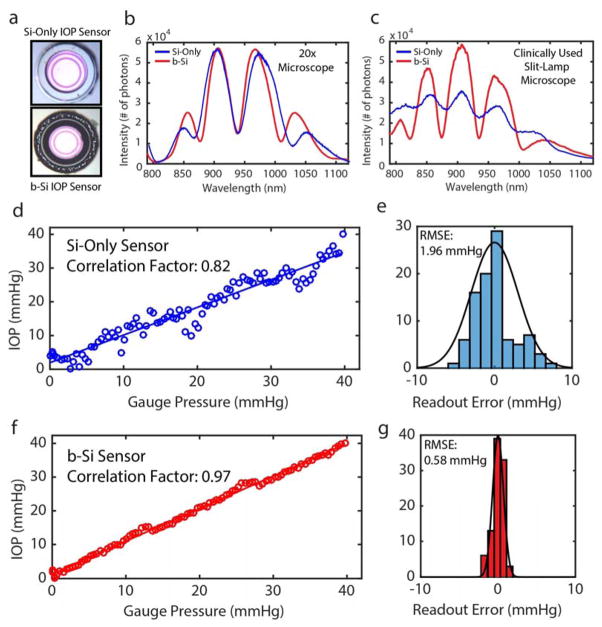
IOP sensing performance of b-Si-integrated and Si-only IOP sensors with identical dimensions were examined using a tabletop microscope and a slit-lamp (Fig. 3a). The first captured signals were from the 600 μm wide active core cavities of the sensors, excluding the inactive regions, using a microscope (20x objective) at a readout distance of 3 cm. The resonance spectra from the two sensors were almost identical and of good quality (Fig. 3b). The outer envelope of the captured spectrum is determined by the blackbody radiation of the tungsten light source, NIR filters in the detector, and the thickness of Si3N4 membrane, while higher frequency peaks and valleys inside the envelop are determined by the optical cavity with an air gap between the Si3N4 membrane and the Si substrate. A mini-spectrometer and a CCD camera were connected onto the slit-lamp’s two expansion ports (Fig. S5) allowing spectra to be captured at 12 cm, the largest readout distance reported to our knowledge [17–20]. The increased field-of-view (2 × 2 mm2) included the sensor’s active core cavity and the surrounding inactive region. While the quality of resonance spectra captured from the b-Si sensor were hardly influenced by the inclusion of the surrounding regions, the SNR of the resonance spectra captured from the Si-only sensor decreased by 71%, below 10 dB, due to the highly reflective inactive region of the sensor (Fig. 3c).
Figure 3. b-Si and Si-only IOP Sensor Characterization.
(a) Fabricated Si-only (top) and b-Si (bottom) sensors. (b) Spectral measurements using a tabletop microscope with a 20x objective lens (field-of-view: 800×800 μm2, working distance: 3 cm). (c) Spectral measurements using a slit-lamp (size of the field of the view: 2 x 2 mm2; working distance: 12 cm). (d) IOP measurements using the Si-only sensor. (e) Readout-error distribution of the Si sensor. (f) IOP measurements using the b-Si sensor. (g) Readout-error distribution of the b-Si sensor.
Next, using a pressure-controlled test chamber (range: 0–40 mmHg, step size: 0.5 mmHg) interfaced with a digital pressure gauge and applying the slit-lamp measurement conditions, the IOP measurement accuracy was determined. When compared to the digital pressure gauge, measurements using the Si-only sensor showed considerable fluctuations (Fig. 3d): the root-mean-square error (RMSE) and the peak-to-peak fluctuation were 1.96 and ±8 mmHg, respectively (Fig. 3e). In contrast, measurements using the b-Si sensor exhibited an RMSE of 0.58 mmHg and peak-to-peak variation less than ±2 mmHg over the entire pressure range (Fig. 3g), which would satisfy the clinically accepted error range of ±2 mmHg [33].
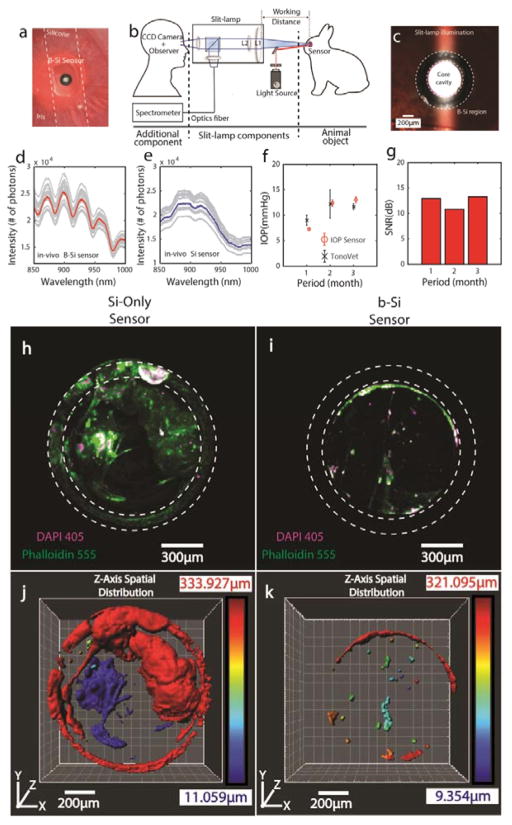
For in-vivo tests using the modified slit-lamp as the readout system (Fig. 4b and Fig. S5), each sensor was individually mounted on a thin, flexible silicone strip and implanted into the anterior chambers of two New Zealand white rabbits (Fig. 4a). For each IOP measurement, the top 30 highest SNR spectra from a set of continuously captured 600–1800 spectra (measurement time: 1–3 minutes, resolution bandwidth: 10Hz) were averaged to improve accuracy. All IOP measurements were performed on fully awake rabbits.
Figure 4. In-Vivo IOP Monitoring of Unanesthetized Rabbits.
(a) A photo of the b-Si sensor implanted inside a rabbit eye using a flexible silicone strip. (b) A modified slit-lamp readout system. (c) A photo of the illuminated sensor in the rabbit eye taken using a slit-lamp at 30x magnification. Top 30 highest-SNR in-vivo spectra (gray curves) selected out of 600–1800 measurements from the b-Si sensor (d) and Si-only sensor (e), captured at 1 month following the implantation. Corresponding means: red (b-Si sensor) and blue (Si-only sensor) curves. (f) IOP measurements using the b-Si sensor and a TonoVet. (g) SNRs of the b-Si sensor over 3 months. 3D-confocal z-stack images (Zeiss LSM-880 confocal microscope) of the Si-only sensor (h) and the b-Si sensor (i) harvested more than 6 months after implantation (DAPI: purple channel, nucleus; Phalloidin: green channel, F-actin; step size: 2.5 μm; scan range: 300 μm) (Fig. S7). 3D reconstruction (Imaris, Bitplane Inc.) showing the spatial distributions of tissues adherent on the Si-only sensor (j) and the b-Si sensor (k). The color bar indicates the vertical location of the tissue along the z-axis, with blue indicating the top of the Si3N4 membrane.
The resonance spectra of the b-Si sensor shown in Fig. 4d fluctuated less than ±1 nm (Supplementary Information), and the corresponding IOP was 7.3 mmHg. In contrast, it was impossible to identify peak-and-valley locations from the resonance spectra of the Si-only sensor and calculate the IOP (Fig. 4e). For reference, b-Si sensor measurements were compared with those made using tonometry (TonoVet, ±2-mmHg accuracy) for three months (Fig. 4f). The IOP measurements using the b-Si sensor generally paralleled the tonometer readouts, however the average standard deviation of the b-Si-sensor measurements was much smaller, 0.48 mmHg vs. 1.45 mmHg for the tonometer measurements. In addition, the b-Si sensor showed no sign of performance degradation, constantly maintaining a SNR over 10 dB for 3 months (Fig. 4g).
To investigate the extent of surface fouling and its influence on the sensor reliability, Si-only and b-Si IOP sensors that had been implanted for more than 6 months were harvested. Confocal immunofluorescence microscopy was performed on the sensors to determine cell and tissue viability at the time of extraction (Supplementary Information). The amount of F-actin present in the cytoskeleton of eukaryotes was used as an indicator of cellular processes and health, and provided evidence to predict cell-and-tissue encapsulation of the implant [34]. DAPI 405 (cell nucleus marker), Phalloidin 555 (cell F-actin marker), and CD62L 488 (L-selectin inflammation marker) in the extracted sensors were counter-stained and scanned from the surface of the inactive region down to the top of the Si3N4 membrane along the z-axis (step: 2.5 μm, scan range: 300 μm, Zeiss LSM 880, 10x EPI objective) (Fig. S7a).
Fig. 4h and i present the results of the z-stack imaging performed on the Si-only and b-Si sensors, respectively, and illustrate the extent of tissue growth. On the Si-only sensor, the cells extended from the inactive region onto the active (Si3N4 membrane surface) region, covering about 62% of the active area, and contained large F-actin filaments, which implied the adherent cells were growing healthily at the time of extraction (Fig. 4h, Fig. S6b). This is highly undesirable because dense tissue growth would ultimately block the optical pathway of the sensor and alter its mechanical properties. In addition, imaging with CD62L 488 indicated several instances of inflammation within a tight cluster of cells covering the Si3N4 membrane (Fig. S8).
In contrast, the b-Si sensor showed almost no sign of tissue growth or discernable onset of encapsulation (Fig. 4i and k). Only 5% of the active region was covered by tissue (Fig. S7b) and non-specific bindings of fluorophores were seen on the b-Si surface in the form of a partial ring (Fig. 4i). The surface-area ratio of Phalloidin 555 to DAPI 405 was 3.3 for the b-Si sensor, approximately four times smaller than the Si-only sensor (13.3). This indicates that most of the cells on the b-Si sensor were unhealthy and F-actin-deficient, experiencing de-polymerization whereby filamentous F-actin disassociates into its globular G-actin [35, 36]. This leads to degeneration and thus deters any further growth or encapsulation.
The highly non-uniform surface of b-Si is postulated to prevent cell adhesion and therefore inhibit tissue-encapsulation of the implant. Furthermore, no instances of inflammation were observed on the b-Si sensor (Fig S8), which correlates with the recent findings indicating the biocompatibility of b-Si surfaces in the presence of eukaryotes [37]. Further studies are currently underway to better understand the biophysical interaction of b-Si within the ocular environment and its antifouling properties for implant applications in general.
In summary, using b-Si as a multifunctional material on the IOP-sensing medical implant significantly improved the sensor performance and reliability. The b-Si was fabricated using a newly developed room-temperature process, which seamlessly integrated with the fabrication steps of the implantable IOP sensors. The anti-reflective properties of b-Si reduced the background noise of the sensor and allowed adaption of a slit-lamp, the most commonly used clinical ophthalmic microscope, as a readout system during in-vivo IOP monitoring. B-Si effectively suppressed tissue growth on the surface of the implant over a six-month period, promising significantly improved long-term reliability of the implant. The demonstrated improvement in both performance and reliability enabled in-vivo studies on fully awake rabbits for six months, positive indications of the possibility of realizing our IOP-sensing approach for everyday use. Further miniaturization of the sensor and improvement of the sensor-securing mechanism inside the eye will greatly simplify the insertion procedure and enhance patient comfort. Furthermore, additional studies will be conducted in the future to elucidate the underlying mechanisms of the presented work and the long-term effect of b-Si inside the eye, which will ultimately allow us to demonstrate the full potential of b-Si as a multifunctional biomaterial for medical implants.
Experimental Section
B-Si Fabrication at Room Temperature
A reactive-ion-etching (RIE) process (Oxford Instruments System 100 ICP 380) was used to fabricate the wafer-scale b-Si surface. The process chamber was maintained at 20°C, while the flow rates of SF6 and O2 gas were set at 47 and 44 sccm, respectively. The etching process was conducted in multiple steps to tune the reflectivity (Fig. 2a). Integration of the b-Si process into the IOP-sensor fabrication is described in Fig. S4.
Characterization of the B-Si IOP Sensor
Two measurement setups were used: (1) a tabletop optical microscope equipped with a CCD camera (ThorLabs), a broadband light source (Ocean Optics HL-2000), and a spectrometer (Ocean Optics Maya2000 Pro-NIR); and (2) a slit-lamp integrated with a CCD (Thorlabs) and a spectrometer (Ocean Optics Maya2000 Pro-NIR) using two of the slit-lamp’s expansion ports [24]. For slit-lamp measurements, the spectra were collected using the built-in tungsten bulb and optics (L1, L2, and a beam splitter, wherein L2 is configurable to four different magnifications (5x, 8x, 10x and 30x), Fig. 4c).
To calculate IOPs, an in-house-developed program was used to identify and convert the locations of the peaks and valleys in a captured spectrum into the corresponding size of the cavity gap and external pressure [38]. The reference pressures inside the test chamber were obtained using a commercial digital pressure gauge (1210 Pressure Sensor, TE Connectivity Ltd.) with ±0.1 mmHg accuracy.
Continuous In-Vivo IOP Monitoring in Unanesthetized Rabbits
Each IOP sensor was mounted on a 200 μm wide and 2.5 mm long flexible “I”-shaped silicone strip and inserted into the anterior chamber of the rabbit eye through a 2-mm corneal incision [24]. The sensor-mounted strip was positioned over the iris and the crystal lens and secured against the inner walls of the cornea (Fig. 4a).
In-vivo measurements were performed using a modified slit-lamp (Fig. 4b). Using the built-in eye piece or the CCD camera (Fig. S5), the sensor was located by setting L2 at its lowest magnification. The optical alignment between the sensor and the detection system was easily accomplished using the slit-lamp’s built-in translational stage (4 degrees of freedom, 3 translational and 1 rotational). The L2 magnification was then increased to 30x and the active region of the sensor occupied ~9.6% of the field of view (Fig. 4a). A single spectrum required 100 ms to capture.
Confocal Immunofluorescence Microscopy and Analyses
A detailed description of the sample preparation protocol for the confocal immunofluorescence imaging is provided in the Supplementary Information. Surface area measurements (DAPI 405 and Phalloidin 555, Fig. S7b) and inflammatory response (CD62L 488, Fig. S8) were determined over the sensors’ core cavity regions using ImageJ, an open-source image-processing program. Inflammatory response assessment was conducted by studying the overlap between DAPI 405 and CD62L 488.
Supplementary Material
Figure S1. (a) The sensor primarily consists of an optomechanical cavity with a deformable transparent top layer and a fixed reflective bottom layer. The initial air gap (or cavity gap) between the two layers, Lo, is 4 μm. When the ambient pressure changes the top layer deforms, thereby altering the air gap to Lf. (b) Upon optically exciting the cavity with a NIR tungsten light source, the reflected resonance spectrum is captured by a spectrometer. A change in gap size results in a shift in the reflected resonance spectrum which can subsequently be correlated to IOP values.
Figure S2. SEM image at 6500x magnification of b-Si texturing with annotations indicating structure height, width and spacing. Through SEM image processing, the RMS surface roughness was estimated to be 4.63 μm. Scale: 5 μm.
Figure S3. The absolute reflectivity of Si and five b-Si samples (categorized by process time) were characterized. b-Si samples were optimized to an absolute reflectivity as low as 3.5% in the wavelength range of interest. A NIR high-reflectivity mirror (Ravg > 97%, Edmund Industrial Optics) was used as a reference.
Figure S4. Illustration of the b-Si sensor fabrication process flow. The sensor consists of two parts (top and bottom) individually batch-fabricated and bonded together using medical grade epoxy to produce a hermetically sealed active core cavity. The diagram also illustrates the seamless integration of the room-temperature b-Si process into the sensor fabrication.
Figure S5. a) Photograph of a slit-lamp readout setup with a spectrometer and a CCD camera connected to the slit-lamp expansion ports. b) Photograph of the slit-lamp being used for in-vivo IOP measurements on an awake rabbit. The inset shows slit-lamp illumination in the rabbit’s eye.
Figure S6. (a) Fluctuations of the major peaks during the 10-sec in-vivo measurement. Only the top 30 highest SNR spectra were selected and plotted. The spectral fluctuation in the peak locations is within ±1 nm. (b) The corresponding IOP for the spectrum was 7.3 mmHg and the peak-to-peak fluctuation was less than 0.4 mmHg.
Figure S7. (a) Illustration showing imaging depth (shown in red) of 300 μm starting from the top of the rigid hollow disk to the top of the Si3N4 membrane. (b) Extent of sensor biofouling was evaluated through assessing the percentage of the sensor active surface area (highlighted by the white dashed circle) in merged images (DAPI 405 and Phalloidin 555) covered by tissue for the Si-only and b-Si sensors.
Figure S8. Immune response comparison that indicates the presence of potential inflammation in the Si-only sensor. The CD62L 488 marker is overlapped with DAPI 405 to ascertain the location of immune cells. Multiple instances of inflammation were observed in the case of the Si-only sensor (indicated with white arrows). No inflammation was detected in the b-Si sensor.
Acknowledgments
The work was funded by the National Institute of Health (NIH) EY024582, HMRI Investigator Award, Caltech CI2 program, and Powell Foundation Award. (Supporting Information is available online from Wiley InterScience or from the authors).
Contributor Information
Dr. Jeong Oen Lee, Department of Medical Engineering, California Institute of Technology, Pasadena, CA, 91106, (USA). Department of Electrical Engineering, California Institute of Technology, Pasadena, CA, 91106, (USA).
Vinayak Narasimhan, Department of Medical Engineering, California Institute of Technology, Pasadena, CA, 91106, (USA).
Dr. Juan Du, Department of Ophthalmology, University of California, San Francisco, San Francisco, CA, 94143, (USA)
Dr. Blaise Ndjamen, Department of Medical Engineering, California Institute of Technology, Pasadena, CA, 91106, (USA)
Prof. David Sretavan, Department of Ophthalmology, University of California, San Francisco, San Francisco, CA, 94143, (USA)
Prof. Hyuck Choo, Department of Medical Engineering, California Institute of Technology, Pasadena, CA, 91106, (USA). Department of Electrical Engineering, California Institute of Technology, Pasadena, CA, 91106, (USA).
References
- 1.Canales A, Jia X, Froriep UP, Koppes RA, Tringides CM, Selvidge J, Lu C, Hou C, Wei L, Fink Y, Anikeeva P. Nat Biotech. 2015;33:277. doi: 10.1038/nbt.3093. [DOI] [PubMed] [Google Scholar]
- 2.Acarregui A, Herrán E, Igartua M, Blanco FJ, Pedraz JL, Orive G, Hernandez RM. Acta Biomater. 2014;10:4206. doi: 10.1016/j.actbio.2014.06.038. [DOI] [PubMed] [Google Scholar]
- 3.Thoniyot P, Tan MJ, Karim AA, Young DJ, Loh XJ. Adv Sci. 2015;2:1400010. doi: 10.1002/advs.201400010. [DOI] [PMC free article] [PubMed] [Google Scholar]
- 4.DeMuth PC, Min Y, Irvine DJ, Hammond PT. Adv Healthc Mater. 2014;3:47. doi: 10.1002/adhm.201300139. [DOI] [PMC free article] [PubMed] [Google Scholar]
- 5.Mendes RG, Bachmatiuk A, Büchner B, Cuniberti G, Rummeli MH. J Mater Chem B. 2013;1:401. doi: 10.1039/c2tb00085g. [DOI] [PubMed] [Google Scholar]
- 6.Stubenrauch M, Fischer M, Kremin C, Stoebenau S, Albrecht A, Nagel O. J Micromech Microeng. 2006;16:S82. [Google Scholar]
- 7.Jansen HV, de Boer MJ, Unnikrishnan S, Louwerse MC, Elwenspoek MC. Micromech Microeng. 2009;19:1. [Google Scholar]
- 8.Jansen H, de Boer M, Legtenberg R, Elwenspoek M. Micromech Microeng. 1995;5:115. [Google Scholar]
- 9.Otto M, Kroll M, Käsebier T, Lee SM, Putkonen M, Salzer R, Miclea PT, Wehrspohn RB. Adv Mater. 2010;22:5035. doi: 10.1002/adma.201002515. [DOI] [PubMed] [Google Scholar]
- 10.Yoo J, Yu G, Yi J. Sol Energy Mater Sol Cells. 2011;95:2. [Google Scholar]
- 11.Ziegler J, Haschke J, Käsebier T, Korte L, Sparfke AN, Wehrspohn RB. Opt Express. 2014;22:A1469. doi: 10.1364/OE.22.0A1469. [DOI] [PubMed] [Google Scholar]
- 12.Gervinskas G, Seniutinas G, Hartley JS, Kandasamy S, Stoddart PR, Fahim NF, Juodkazis S. Ann Phys. 2013;525:907. [Google Scholar]
- 13.Stubenrauch M, Fischer M, Kremin C, Hoffmann M, Müller J. Micro Nano Lett. 2007;2:6. [Google Scholar]
- 14.Dorrer C, Rühe J. Adv Mater. 2008;20:159. [Google Scholar]
- 15.Barberoglou M, Zorba V, Pagozidis A, Fotakis C, Stratakis E. Langmuir. 2010;26:13007. doi: 10.1021/la101138u. [DOI] [PubMed] [Google Scholar]
- 16.Ivanova EP, Hasan J, Webb HK, Gervinskas G, Juodkazis S, Truong VK, Wu AHF, Lamb RN, Baulin VA, Watson GS, Watson JA, Mainwaring DE, Crawford RJ. Nat Comm. 2013;4(2838):1. doi: 10.1038/ncomms3838. [DOI] [PMC free article] [PubMed] [Google Scholar]
- 17.Chen PJ, Rodger DC, Saati S, Humayun MS, Tai YC. J Microelectromech. 2008;17:1342. [Google Scholar]
- 18.Araci AE, Su B, Quake SR, Mandel Y. Nat Med. 2014;20:1074. doi: 10.1038/nm.3621. [DOI] [PubMed] [Google Scholar]
- 19.Xue N, Chang SP, Lee JB. J Microelectromech. 2012;21:1338. [Google Scholar]
- 20.Todani A, Behlau I, Fava MA, Cade F, Cherfan DG, Zakka FR, Melki SA. Invest Ophthalmol Vis Sci. 2011;52:9573. doi: 10.1167/iovs.11-7878. [DOI] [PubMed] [Google Scholar]
- 21.Ivanova EP, Hasan J, Webb HK, Truong VK, Watson GS, Watson JA, Baulin VA, Pogodin S, Wang JY, Tobin MJ, Lobbe C, Crawford RJ. Small. 2012;8:2489. doi: 10.1002/smll.201200528. [DOI] [PubMed] [Google Scholar]
- 22.Pogodin S, Hasan J, Baulin VA, Webb HK, Truong VK, Nguyen THP, Boshkovikj V, Fluke CJ, Watson GS, Watson JA, Crawford RJ, Ivanova EP. Biophys J. 2013;104:835. doi: 10.1016/j.bpj.2012.12.046. [DOI] [PMC free article] [PubMed] [Google Scholar]
- 23.Lee JO, Nguyen TT, Stretavan D, Choo H. PIERS Proc. 2014:826. [Google Scholar]
- 24.Lee JO, Park H, Chen O, Balakrishna A, Du J, Sretavan DW, Choo H. Proc IEEE Int Conf MEMS. 2016:210. [Google Scholar]
- 25.Hecht E. Optics. 5. Pearson; New York, USA: 2016. [Google Scholar]
- 26.Gaudig M, Hirsch J, Schneider T, Sprafke AN, Ziegler J, Bernhard N, Wehrspohn RB. J Vac Sci Technol A. 2015;33:05E132–1. [Google Scholar]
- 27.Koynov S, Brandt MS, Stutzmann M. Appl Phys Lett. 2006;88:203107–1. [Google Scholar]
- 28.Schnell M, Lüdemann R, Schaefer S. 28th IEEE Photovoltaic Specialists Conference; Anchorage, Alaska. 2000; p. 367. [Google Scholar]
- 29.Zaidi SH, Ruby DS, Gee JM. IEEE Trans Electron Devices. 2001;48:1200. [Google Scholar]
- 30.Otto M, Kroll M, Käsebier T, Salzer R, Tünnermann A, Wehrspohn RB. Appl Phys Lett. 2012;100:191603. [Google Scholar]
- 31.Repo P, Benick J, Vähänissi V, Schön J, von Gastrow G, Steinhauser B, Schubert MC, Hermle M, Savin H. Energy Procedia. 2013;38:866. [Google Scholar]
- 32.von Gastrow G, Alcubilla R, Ortega P, Yli-Koski M, Conesa-Boj S, Morral AFi, Savin H. Sol Energy Mater Sol Cells. 2015;142:29. [Google Scholar]
- 33.Kontiola A, Puska P. Graefes Arch Clin Exp Ophthalmol. 2004;242:3. doi: 10.1007/s00417-003-0671-3. [DOI] [PubMed] [Google Scholar]
- 34.Dominguez R, Holmes KC. Annu Rev Biophys. 2011;40:169. doi: 10.1146/annurev-biophys-042910-155359. [DOI] [PMC free article] [PubMed] [Google Scholar]
- 35.Pollard TD, Cooper JA. Science. 2009;326:1208. doi: 10.1126/science.1175862. [DOI] [PMC free article] [PubMed] [Google Scholar]
- 36.Holmes KC. Nature. 2009;457:389. doi: 10.1038/457389a. [DOI] [PubMed] [Google Scholar]
- 37.Pham VTH, Truong VK, Orlowska A, Ghanaati S, Barbeck M, Booms P, Fulcher AJ, Bhadra CM, Buividas R, Baulin V, Kirkpatrick CJ, Doran P, Mainwaring DE, Juodkazis S, Crawford RJ, Ivanova EP. ACS Appl Mater Interfaces. 2016;8:22025. doi: 10.1021/acsami.6b06415. [DOI] [PubMed] [Google Scholar]
- 38.Hill GC, Melamud R, Declercq FE, Davenport AA, Chan IH, Hartwell PG, Pruitt BL. Sensors and Actuators A. 2007;138:52. [Google Scholar]
Associated Data
This section collects any data citations, data availability statements, or supplementary materials included in this article.
Supplementary Materials
Figure S1. (a) The sensor primarily consists of an optomechanical cavity with a deformable transparent top layer and a fixed reflective bottom layer. The initial air gap (or cavity gap) between the two layers, Lo, is 4 μm. When the ambient pressure changes the top layer deforms, thereby altering the air gap to Lf. (b) Upon optically exciting the cavity with a NIR tungsten light source, the reflected resonance spectrum is captured by a spectrometer. A change in gap size results in a shift in the reflected resonance spectrum which can subsequently be correlated to IOP values.
Figure S2. SEM image at 6500x magnification of b-Si texturing with annotations indicating structure height, width and spacing. Through SEM image processing, the RMS surface roughness was estimated to be 4.63 μm. Scale: 5 μm.
Figure S3. The absolute reflectivity of Si and five b-Si samples (categorized by process time) were characterized. b-Si samples were optimized to an absolute reflectivity as low as 3.5% in the wavelength range of interest. A NIR high-reflectivity mirror (Ravg > 97%, Edmund Industrial Optics) was used as a reference.
Figure S4. Illustration of the b-Si sensor fabrication process flow. The sensor consists of two parts (top and bottom) individually batch-fabricated and bonded together using medical grade epoxy to produce a hermetically sealed active core cavity. The diagram also illustrates the seamless integration of the room-temperature b-Si process into the sensor fabrication.
Figure S5. a) Photograph of a slit-lamp readout setup with a spectrometer and a CCD camera connected to the slit-lamp expansion ports. b) Photograph of the slit-lamp being used for in-vivo IOP measurements on an awake rabbit. The inset shows slit-lamp illumination in the rabbit’s eye.
Figure S6. (a) Fluctuations of the major peaks during the 10-sec in-vivo measurement. Only the top 30 highest SNR spectra were selected and plotted. The spectral fluctuation in the peak locations is within ±1 nm. (b) The corresponding IOP for the spectrum was 7.3 mmHg and the peak-to-peak fluctuation was less than 0.4 mmHg.
Figure S7. (a) Illustration showing imaging depth (shown in red) of 300 μm starting from the top of the rigid hollow disk to the top of the Si3N4 membrane. (b) Extent of sensor biofouling was evaluated through assessing the percentage of the sensor active surface area (highlighted by the white dashed circle) in merged images (DAPI 405 and Phalloidin 555) covered by tissue for the Si-only and b-Si sensors.
Figure S8. Immune response comparison that indicates the presence of potential inflammation in the Si-only sensor. The CD62L 488 marker is overlapped with DAPI 405 to ascertain the location of immune cells. Multiple instances of inflammation were observed in the case of the Si-only sensor (indicated with white arrows). No inflammation was detected in the b-Si sensor.


