Abstract
Objective
To determine the impact of surgical site infections (SSIs) on healthcare costs following common ambulatory surgical procedures throughout the cost distribution.
Background
Data on costs of SSIs following ambulatory surgery are sparse, particularly variation beyond just mean costs.
Methods
We performed a retrospective cohort study of persons undergoing cholecystectomy, breast-conserving surgery (BCS), anterior cruciate ligament reconstruction (ACL), and hernia repair from 12/31/2004–12/31/2010 using commercial insurer claims data. SSIs within 90 days post-procedure were identified; infections during a hospitalization or requiring surgery were considered serious. We used quantile regression, controlling for patient, operative, and postoperative factors to examine the impact of SSIs on 180-day healthcare costs throughout the cost distribution.
Results
The incidence of serious and non-serious SSIs were 0.8% and 0.2% after 21,062 ACL, 0.5% and 0.3% after 57,750 cholecystectomy, 0.6% and 0.5% after 60,681 hernia, and 0.8% and 0.8% after 42,489 BCS procedures. Serious SSIs were associated with significantly higher costs than non-serious SSIs for all 4 procedures throughout the cost distribution. The attributable cost of serious SSIs increased for both cholecystectomy and hernia repair as the quantile of total costs increased ($38,410 for cholecystectomy with serious SSI vs. no SSI at the 70th percentile of costs, up to $89,371 at the 90th percentile).
Conclusions
SSIs, particularly serious infections resulting in hospitalization or surgical treatment, were associated with significantly increased healthcare costs after 4 common surgical procedures. Quantile regression illustrated the differential effect of serious SSIs on healthcare costs at the upper end of the cost distribution.
Infections are one of the most common complications after surgical procedures and a significant cause of morbidity. Surgical site infections (SSIs) account for over 20% of hospital-acquired infections and are the most common reason for unplanned hospital readmission after operation.1–3 SSIs can prolong hospital stays by as much as 7 to 11 days, and are estimated to result in annual costs of $3.5 billion or more in the US.2 Numerous estimates are available for the healthcare costs attributable to SSIs per patient; a recent meta analysis reported inpatient hospital costs due to SSIs of $20,875 (2012 US Dollars (USD)). However, this cost estimate does not take into account additional healthcare costs due to SSI, including costs for physician care, laboratory, radiology, and outpatient antibiotics. In addition, the reported summary cost attributable to SSIs does not take into account variation in attributable costs depending on the type of surgery. Reported costs of SSIs have ranged from a low of $3,173 after cesarean section to $28,790 after coronary artery bypass surgery (adjusted to 2012 $US).4–6 In general, the costs of SSIs described in the literature have been highest for neurologic, cardiac and orthopedic operations, and lowest for less extensive operations such as breast surgery and cesarean section, in which the majority of SSIs are superficial rather than deep or organ-space.4,5,7–10
Even fewer data are available on the costs of SSIs following procedures performed in ambulatory settings, either in free-standing facilities or hospital-affiliated outpatient centers. Ambulatory surgery accounts for a growing proportion of surgical procedures, although the proportion performed as outpatient surgery varies by surgical specialty.11,12 In a recent study, Hollingsworth and colleagues found that the likelihood to perform operations in outpatient surgery was higher for orthopedic, urologic, and gastroenterology compared to other surgical specialties, and the proportion of these procedures performed as outpatients increased over time.12
Rhee et al. reported comprehensive surveillance for SSIs after ambulatory surgery using medical claims data and validation with medical record review. They found rates of SSIs ranging from 0.5% for cholecystectomy, 0.7% after anterior cruciate ligament reconstruction (ACL), 1.3% for hernia repair, to 3.2% after appendectomy.13 Deep SSI rates after a variety of orthopedic surgeries performed by the same surgeons ranged from 0.4–0.8% depending on whether operations were performed in a multispecialty ambulatory surgery center (ASC) or a dedicated orthopedic ASC.14 In two studies of ambulatory surgeries, 0.6% of lumbar discectomies15 and 0.2% of thyroidectomies16 were followed by SSIs identified during a hospital readmission within 30 days after operation.
While some information is available concerning the incidence of SSIs after ambulatory surgical procedures, data concerning the costs of SSI are sparse. Using a comprehensive nationwide database across a continuum of care, we determined costs associated with SSIs and variation in attributable costs across the distribution of total medical costs for four common surgical procedures that can be performed in either inpatient or outpatient settings: cholecystectomy, breast-conserving surgery (BCS), ACL, and hernia repair.
METHODS
We conducted a retrospective cohort study using the HealthCore Integrated Research DatabaseSM, with longitudinal claims data from 13 Anthem-owned Blue Cross and/or Blue Shield health plans located in the Southeast, Mid-Atlantic, Eastern, Central, and Western US regions. Data included all fully adjudicated claims submitted for reimbursement from providers, facilities, and outpatient pharmacies linked to health plan enrollment information.
Fully insured members enrolled in a fee-for-service health plan including medical coverage of hospital and physician services and prescription drug coverage were eligible for inclusion into the cohort. To assess comorbid conditions and capture costs, we required members to have insurance coverage from 365 days before surgery through 180 days after surgery. To avoid censoring, we excluded patients who died within 180 days of surgery. Medical claims were restricted to paid claims.
Patient populations
We identified cholecystectomy, BCS, ACL, and hernia repair procedures performed from 12/31/2004–12/31/2010 in members eligible for cohort entry using International Classification of Diseases, Ninth Revision, Clinical Modification (ICD-9-CM) and Current Procedural Terminology, 4th edition (CPT-4) procedure codes from inpatient and ambulatory facilities (other than home health agencies) and provider claims (Supplemental Digital Content 1). We included members aged 18 to 64 years for BCS and cholecystectomy and members aged 6 months to 64 years for ACL and hernia repair.
Patients were excluded for any of the following reasons, as defined previously17–19: no other supporting evidence for the surgery (e.g., surgery coded by provider- or facility-only and no CPT-4 codes for anesthesia, pathology, surgery revenue codes); additional procedures performed at the same time as the eligible surgery; medically complicated patient; ICD-9-CM diagnosis code or prescription claim indicating HIV-positive status; history of organ transplant in the previous year (ICD-9-CM V42.0–V42.1, V42.6–V42.7, V42.81–V42.84); preexisting SSI within 30 days before the surgical procedure; and cholecystectomy or hernia repair with discordant provider and facility coding for approach (laparoscopic vs. open) or anatomic site. We restricted analyses to the first surgical procedure per patient, per procedure type.
Identification of SSIs
SSIs first recorded 2 to 90 days after surgical procedures were identified using ICD-9-CM diagnosis codes from inpatient and outpatient facilities and provider claims (Supplemental Digital Content 2–4). We excluded claims with locations inconsistent with a provider diagnosis (e.g., laboratory, patient’s home) as well as claims with CPT-4 codes for laboratory services (88104–88399), since the diagnosis codes on those lines may have been used for “rule-out” diagnoses.17–19 We censored the observation period to avoid misclassification of SSIs after a subsequent surgery using the National Healthcare Safety Network procedure list.20
We defined serious SSI as infection coded during an inpatient hospitalization (index hospitalization or readmission) or requiring surgical treatment within 90 days of the index procedure. Surgical treatment included all ICD-9-CM and CPT-4 procedure codes in Supplemental Digital Content 2–4 (except ICD-9-CM procedure 85.91, 86.01, and 86.28 for BCS), and laparotomy codes for hernia repair and cholecystectomy (ICD-9-CM procedure 54.11, 54.12, 54.19; CPT-4 49000, 49002). All other SSIs were categorized as non-serious.
Outcomes and covariates
The primary outcome was total medical costs, defined as the total allowed amount for all medical and pharmacy claims (i.e., sum of patient- and plan-paid amounts) from the surgery date through 180 days after surgery. For statistical analyses, all costs were inflation-adjusted to 2014 USD using the medical care component of the Consumer Price Index.21 Natural log transformed total costs were used as the dependent variable for all models.
We selected a set of potential confounders that might influence the relationship between health care costs and SSI, including patient demographics, comorbid conditions, medications, type of facility, operative factors, and postoperative factors (Table 1). We utilized the American Hospital Association Annual Survey of Hospitals (Health Forum, LLC, Chicago, IL) and the Outpatient Surgery Center Profiling Solution data (IMS Health, Plymouth Meeting, PA) to determine whether the surgical procedure was performed at a hospital or freestanding ASC. The facility information from these two data sources was matched to the operative facility using National Provider Identifier codes, where available; otherwise matching was performed using facility name and address fields. Among facilities matching to an American Hospital Association hospital, we used an inpatient designation in the claims data to define whether the procedure was performed as an inpatient or outpatient.
Table 1.
Potential Covariates
| Patient Factors | Operative Factors | Postoperative Factors in the Month After Surgery* |
|---|---|---|
| Demographics | Type of facility where procedure was performed | Anemia |
| Age | Urinary tract infection or pneumonia | |
| Sex | ||
| Comorbidities/medications | Anterior cruciate ligament reconstruction-specific factors | |
| Alcohol abuse | Chronic patellar tendonitis | |
| Anticoagulants | Hamstring injury | |
| Blood loss anemia | Laxity of ligament | |
| Cancer† | ||
| Coagulopathy | Cholecystectomy-specific factors | |
| Congestive heart failure | Acute cholecystitis or obstruction stratified by surgical approach (open, laparoscopic, conversion to open) | |
| Deficiency anemia | Bile duct exploration | |
| Depression | Chronic cholecystitis | |
| Diabetes ± medications | Cholangiography | |
| DMARD/biologic drugs | Choledocholithiasis | |
| Drug abuse | Cholelithiasis | |
| Hypertension ± medications | Endoscopic retrograde cholangiopancreatography | |
| Liver disease | Other bile duct procedures | |
| Loop diuretics | ||
| Malnutrition/weight loss | Hernia repair-specific factors | |
| Obesity | Anatomic site of repair (inguinal/femoral, umbilical, incisional/ventral) | |
| Oral steroids | Laparoscopic versus open approach | |
| Peripheral vascular disease | Obstruction or necrosis | |
| Psychoses | Revision surgery | |
| Renal failure | ||
| Skin diseases | Breast-conserving surgery-specific factors | |
| Smoking ± medications | Axillary lymph node dissection | |
| Smoking related diseases | Brachytherapy catheter placement | |
| Staphylococcus aureus infection | Needle localization | |
| Urinary tract infection or pneumonia | Number of re-excisions within 90 days | |
| Sentinel lymph node dissection | ||
| Breast-conserving surgery-specific | ||
| Cancer stage | ||
| Neoadjuvant chemotherapy | ||
| Previous axillary lymph node dissection | ||
| Previous breast cancer | ||
| Previous sentinel node dissection |
Also must have been coded before a surgical site infection, if applicable.
For breast-conserving surgery, does not include breast cancer.
DMARD indicates disease-modifying antirheumatic drugs.
Statistical analysis
An ordinary least squares (OLS) model was used to identify covariates for inclusion in a quantile regression model of total medical costs, with serious and non-serious SSI as the primary exposures. Backwards stepwise variable selection was used with cutoff values of p<0.10 for entry and p<0.15 for retention. Model fit diagnostics and collinearity were assessed.
Quantile regression was used to estimate the conditional percentiles of total cost and association with SSI, including the significant covariates identified in the OLS model. The quantile regression technique was chosen for the analyses because it enables assessment of the effects of a covariate on all parts of the cost distribution (i.e., upper, lower, and median) rather than only the mean, as with OLS.22,23 The 95% confidence intervals were approximated by bootstrapping with 500 repetitions. Quantile regression for costs was performed at intervals of 10% for percentiles from 10% up to 90%, and for the 25% and 75% percentiles. Interquantile regression analysis was performed for three interquantile ranges: 10th to 90th, 10th to 50th, and 50th to 90th quantile. Attributable costs of non-serious and serious SSIs were determined by using total costs rather than the natural log of total costs as the dependent variable in the quantile regression models. All data management and analyses were performed in SAS version 9.3 (Cary, NC) and Stata version 13 (College Station, TX).
RESULTS
Among the eligible patients included in analyses, 21,062 had an ACL, 57,750 had a cholecystectomy; 60,681 had a hernia repair procedure; and 42,489 had BCS (Table 2). Among ACLs, 40.9% of patients were female with a median age of 30 years. Females made up 74.6% of patients in the cholecystectomy cohort (median age 45 years), and 20.1% in the hernia repair cohort (median age 48 years). The median age of women in the BCS cohort was 49 years. Thirty-three percent of patients in the ACL cohort had surgery performed in an ASC. In contrast, the majority of cholecystectomy, hernia repair, and BCS procedures were performed as outpatient surgeries in a hospital. One-quarter of cholecystectomy procedures were performed during an inpatient hospitalization (Table 2). The procedures with missing facility information varied significantly with regard to demographics and operative factors compared to facilities with known facility association (data not shown), consistent with missing facilities comprising a mixture of free-standing ASC, outpatient surgery, and inpatient hospitals.
Table 2.
Baseline Characteristics by Type of Surgical Procedure
| Anterior Cruciate Ligament Reconstruction n (%) | Cholecystectomy n (%) | Hernia Repair n (%) | Breast-Conserving Surgery n (%) | |
|---|---|---|---|---|
| Total number of patients | 21,062 | 57,750 | 60,861 | 42,489 |
| Female | 8,617 (40.9) | 43,058 (74.6) | 12,243 (20.1) | 42,489 (100.0) |
| Age (median, interquartile range) | 30 (19–42) | 45 (35–54) | 48 (37–56) | 49 (42–56) |
| Operation facility type | ||||
| Inpatient hospital | 981 (4.7) | 14,360 (24.9) | 4,743 (7.8) | 2,330 (5.5) |
| Ambulatory surgery center | 6,939 (33.0) | 3,552 (6.2) | 8,378 (13.8) | 4,326 (10.2) |
| Outpatient hospital | 8,049 (38.2) | 33,848 (58.6) | 40,183 (66.0) | 26,211 (61.7) |
| Missing facility | 5,093 (24.2) | 5,990 (10.4) | 7,557 (12.4) | 9,622 (22.7) |
| Surgical site infection (SSI) | ||||
| No SSI | 20,843 (99.0) | 57,334 (99.3) | 60,199 (98.9) | 41,821 (98.4) |
| Non-serious SSI | 51 (0.2) | 150 (0.3) | 291 (0.5) | 340 (0.8) |
| Serious SSI* | 168 (0.8) | 266 (0.5) | 371 (0.6) | 328 (0.8) |
| Wound care | 9 (5.4) | 45 (16.9) | 86 (23.2) | 146 (44.5) |
| Outpatient surgery | 32 (19.0) | 9 (3.4) | 25 (6.7) | 50 (15.2) |
| Inpatient hospitalization without reoperation | 33 (19.6) | 158 (59.4) | 179 (48.2) | 97 (29.6) |
| Reoperation during inpatient hospitalization | 94 (56.0) | 54 (20.3) | 81 (21.8) | 35 (10.7) |
Serious SSI defined as requiring wound care and/or hospitalization. The rows following display the categorization of serious SSI according to increasing severity.
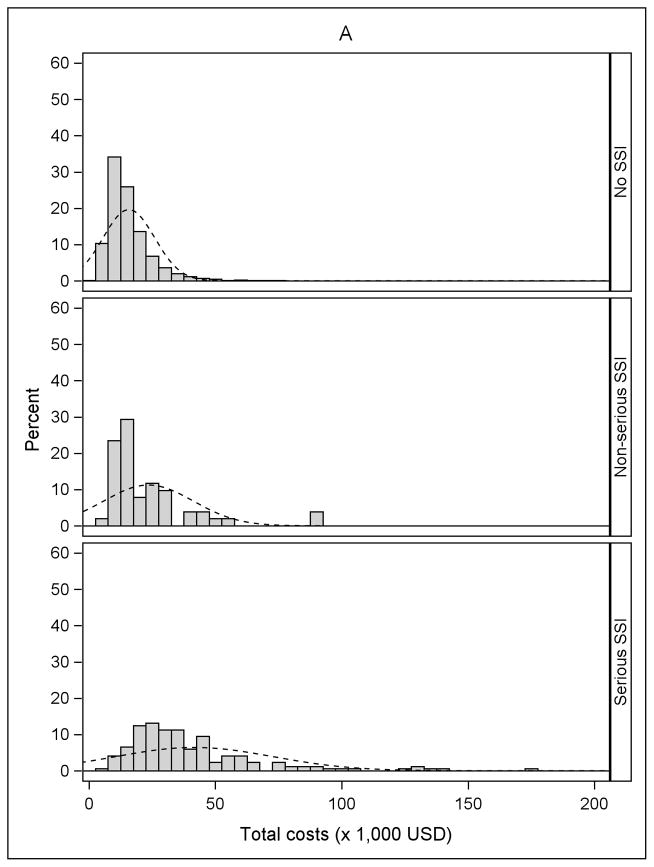
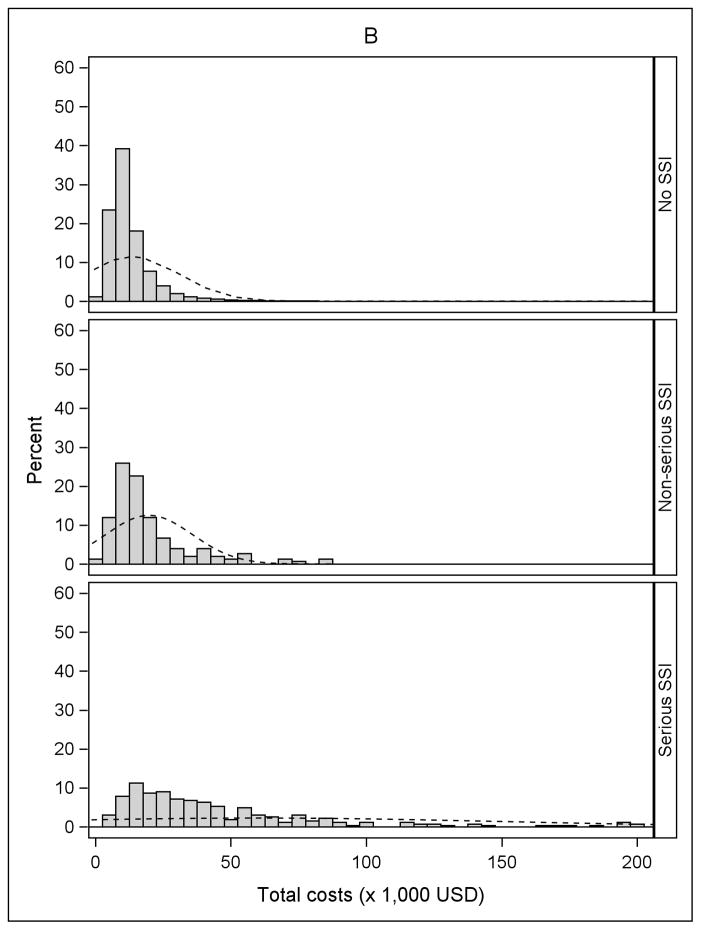
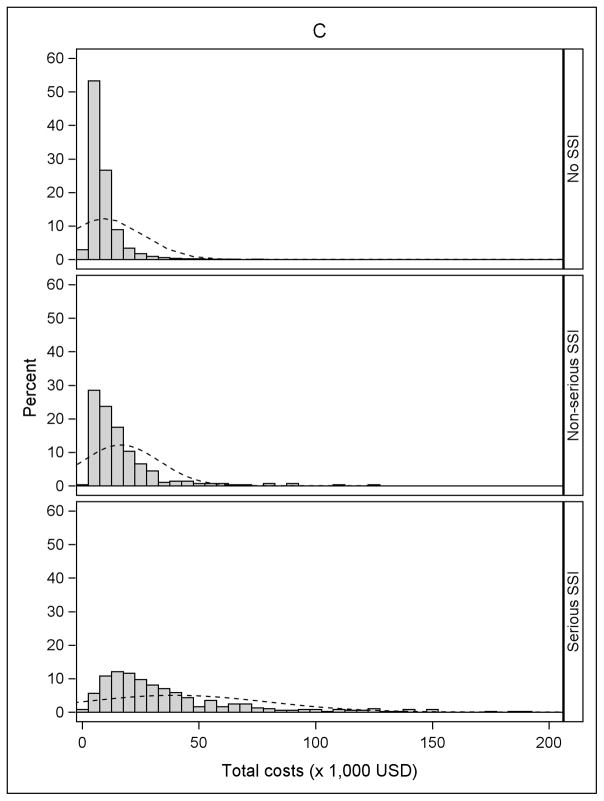
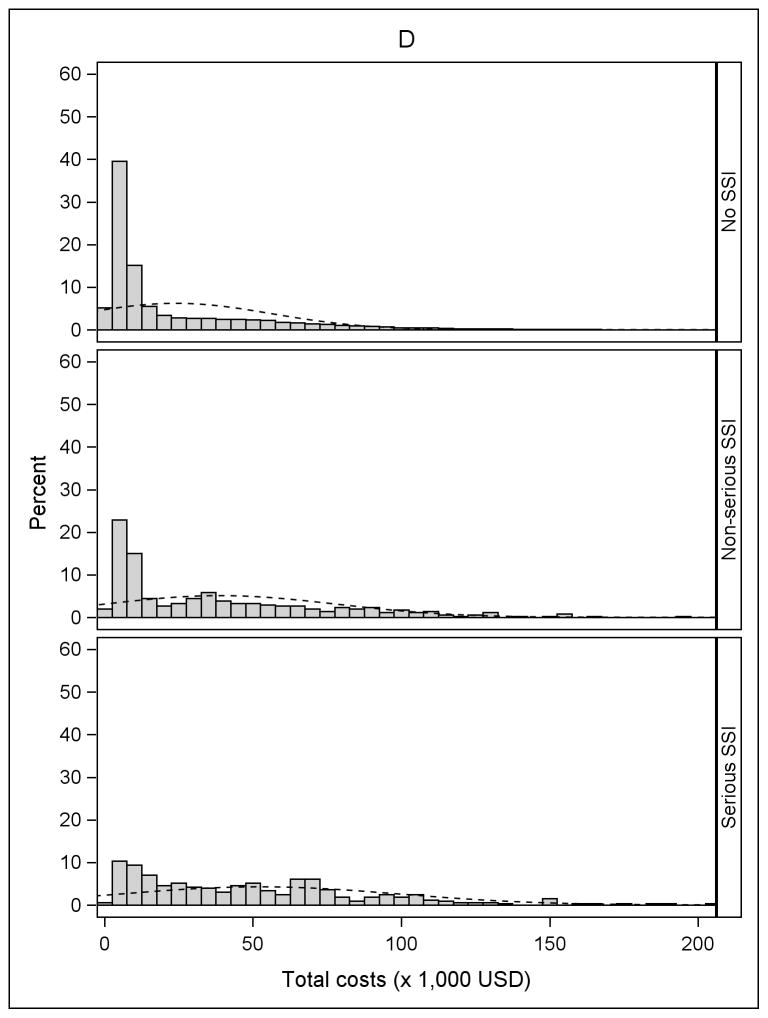
The incidence of serious and non-serious SSIs by procedure type is shown in Table 2. The overall incidence of SSI varied from 0.7% after cholecystectomy to 1.6% after BCS, and the proportion classified as serious ranged from 50% after BCS to 80% after ACL. Fifty-six percent of SSIs after ACL resulted in reoperation during an inpatient hospitalization, compared to 10.7% of the serious SSIs after BCS. Approximately 20% of serious SSIs after both cholecystectomy and hernia repair resulted in reoperation during an inpatient hospitalization. An additional 59.4% of serious SSIs after cholecystectomy and 48.2% of serious SSIs after hernia repair were categorized as “serious” because of medical treatment (other than reoperation) during an inpatient hospitalization (Table 2). Histograms of the unadjusted total medical costs for the 4 procedures are shown in Figure 1, stratified by SSI. The cost distribution shifted to the right in patients with non-serious SSI and serious SSI within 90 days of surgery, compared to patients without SSI.
Figure 1.
Distribution of total costs stratified by no infection, non-serious surgical site infection (SSI), and serious SSI. A) Anterior Cruciate Ligament (ACL) Reconstruction B) Cholecystectomy C) Hernia Repair D) Breast-Conserving Surgery (BCS). The X-axis was truncated at $200,000. The percentages of patients with total costs greater than $200,000 for the four procedures were: 0.01% for ACL reconstruction (maximum $266,995), 0.11% for cholecystectomy (maximum $2,199,560), 0.08% for hernia repair (maximum $2,125,635), and 0.24% for BCS (maximum $574,680).
In quantile regression models at the 50th percentile, SSI was associated with higher median costs after controlling for underlying health conditions, age, gender, operative variables, and facility type, although the magnitude varied depending on the seriousness of the SSI and by procedure (Table 3). Serious SSIs were associated with significantly higher costs compared with non-serious SSIs; the parameter estimate for serious SSI was almost 5-fold higher than for non-serious SSI for cholecystectomy, 3-fold higher for ACL and hernia repair (all p < 0.001), and 2-fold higher for BCS (p=0.005). Compared with outpatient hospital facilities, inpatient hospital procedures were associated with higher costs for all four procedures. Free-standing ASCs were associated with significantly lower costs compared with outpatient hospital facilities for all four procedures, with the greatest impact observed for hernia repair (Table 3). Other factors associated with significantly higher median costs included a number of underlying conditions (e.g., peripheral vascular disease, diabetes, psychoses, depression, malnutrition or previous weight loss, treatment with disease-modifying antirheumatic drugs or biologic agents). Factors significantly associated with costs that were unique to individual surgical procedures included choledocholithiasis, and surgical approach stratified by acute cholecystitis for cholecystectomy, anatomic site of hernia and laparoscopic approach for hernia repair, and highest cancer stage, concurrent lymph node removal, and number of re-excisions for BCS.
Table 3.
Selected Parameter Estimates From Quantile Regression of Median of Total Cost (in Natural Log Scale)*
| Anterior Cruciate Ligament Reconstruction | Cholecystectomy | Hernia Repair | Breast-Conserving Surgery | |||||
|---|---|---|---|---|---|---|---|---|
| Coeff (std err) | P | Coeff (std err) | P | Coeff (std err) | P | Coeff (std err) | P | |
| No SSI (ref) | ||||||||
| Non-serious SSI | 0.280 (0.127) | 0.028 | 0.198 (0.060) | 0.001 | 0.300 (0.037) | <0.001 | 0.149 (0.035) | <0.001 |
| Serious SSI | 0.888 (0.039) | <0.001 | 0.977 (0.086) | <0.001 | 0.986 (0.052) | <0.001 | 0.293 (0.040) | <0.001 |
| Female | 0.054 (0.009) | <0.001 | † | 0.050 (0.007) | <0.001 | ‡ | ||
| Congestive heart failure | 0.186 (0.231) | 0.423 | 0.331 (0.059) | <0.001 | 0.126 (0.059) | 0.032 | 0.242 (0.133) | 0.068 |
| Depression | 0.088 (0.036) | 0.014 | 0.117 (0.015) | <0.001 | 0.202 (0.019) | <0.001 | 0.158 (0.020) | <0.001 |
| Peripheral vascular disease | 0.315 (0.111) | 0.004 | 0.125 (0.029) | <0.001 | 0.179 (0.037) | <0.001 | 0.127 (0.079) | 0.106 |
| Previous Staphylococcus aureus infection | † | 0.197 (0.068) | 0.004 | 0.081 (0.106) | 0.443 | † | ||
| Psychoses | 0.124 (0.037) | 0.001 | 0.231 (0.016) | <0.001 | 0.224 (0.017) | <0.001 | 0.290 (0.022) | <0.001 |
| Renal failure | 0.122 (0.195) | 0.531 | 0.154 (0.054) | 0.004 | 0.249 (0.074) | 0.001 | † | |
| Smoking ± medications | † | † | 0.001 (0.010) | 0.915 | 0.020 (0.015) | 0.190 | ||
| Smoking related diseases | † | 0.132 (0.015) | <0.001 | 0.140 (0.019) | <0.001 | 0.150 (0.028) | <0.001 | |
| Outpatient hospital (ref) | ||||||||
| Missing facility | −0.080 (0.012) | <0.001 | 0.055 (0.009) | <0.001 | −0.046 (0.009) | <0.001 | −0.100 (0.010) | <0.001 |
| Inpatient hospital | 0.121 (0.022) | <0.001 | 0.204 (0.007) | <0.001 | 0.254 (0.011) | <0.001 | 0.081 (0.014) | <0.001 |
| Ambulatory surgery center | −0.199 (0.010) | <0.001 | −0.252 (0.010) | <0.001 | −0.384 (0.008) | <0.001 | −0.228 (0.013) | <0.001 |
| Laparoscopic cholecystectomy without acute cholecystitis (ref) | ||||||||
| Laparoscopic cholecystectomy with acute cholecystitis | 0.061 (0.006) | <0.001 | ||||||
| Open cholecystectomy without acute cholecystitis | 0.219 (0.079) | 0.006 | ||||||
| Open cholecystectomy with acute cholecystitis | 0.455 (0.044) | <0.001 | ||||||
| Conversion to open cholecystectomy without acute cholecystitis | 0.348 (0.049) | <0.001 | ||||||
| Conversion to open cholecystectomy with acute cholecystitis | 0.423 (0.041) | <0.001 | ||||||
| Inguinal/femoral hernia repair (ref) | ||||||||
| Umbilical hernia repair | −0.020 (0.007) | 0.006 | ||||||
| Incisional/ventral hernia repair | 0.280 (0.009) | <0.001 | ||||||
| Laparoscopic hernia repair | 0.297 (0.008) | <0.001 | ||||||
| Benign breast disease (ref) | ||||||||
| Carcinoma in situ | 1.304 (0.021) | <0.001 | ||||||
| Local breast cancer | 1.681 (0.017) | <0.001 | ||||||
| Regional breast cancer | 2.042 (0.024) | <0.001 | ||||||
| Metastatic cancer | 1.868 (0.151) | <0.001 | ||||||
| 0 re-excisions within 90 days (ref) | ||||||||
| 1 re-excision within 90 days | 0.317 (0.015) | <0.001 | ||||||
| 2+ re-excisions within 90 days | 0.400 (0.038) | <0.001 | ||||||
| Postoperative urinary tract infection or pneumonia | 0.106 (0.076) | 0.163 | 0.251 (0.024) | <0.001 | 0.268 (0.035) | <0.001 | 0.135 (0.031) | <0.001 |
Models were adjusted for all variables retained in the ordinary least squares regression model; only select parameters shown here.
Not included in the model because did not meet requirement for retention in ordinary least squares regression.
Female not included because the BCS model was restricted to females.
Coeff indiates coefficient estimate; ref, reference group; std err, standard error; SSI, surgical site infection.
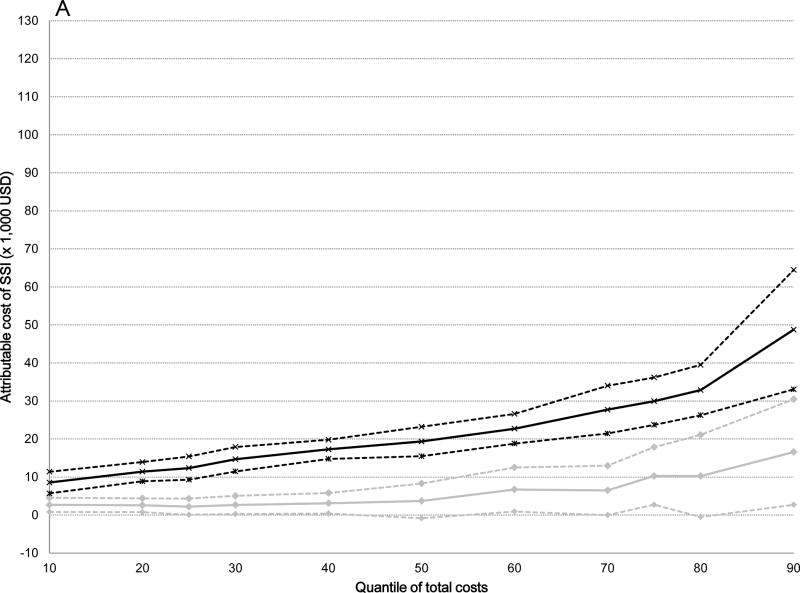
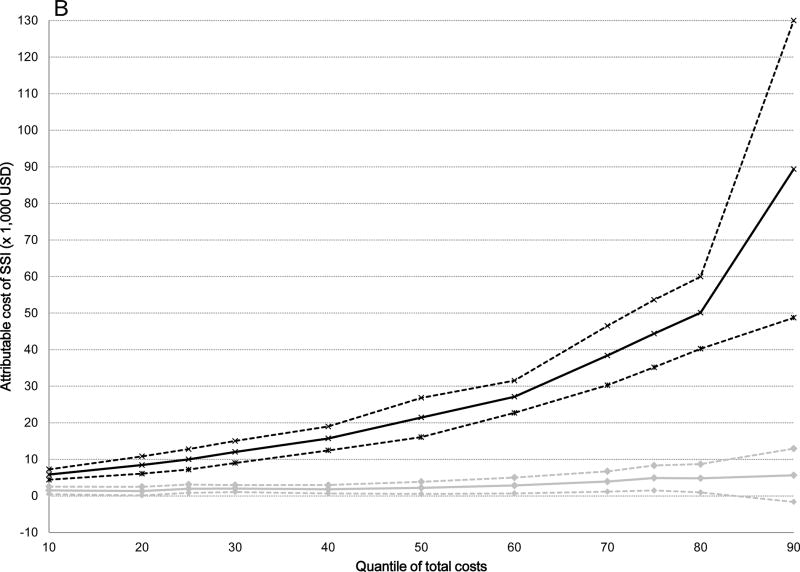
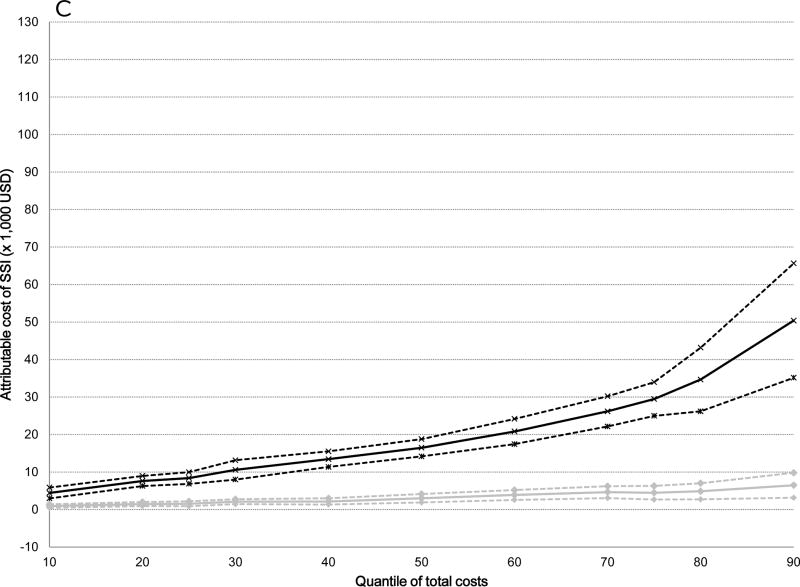
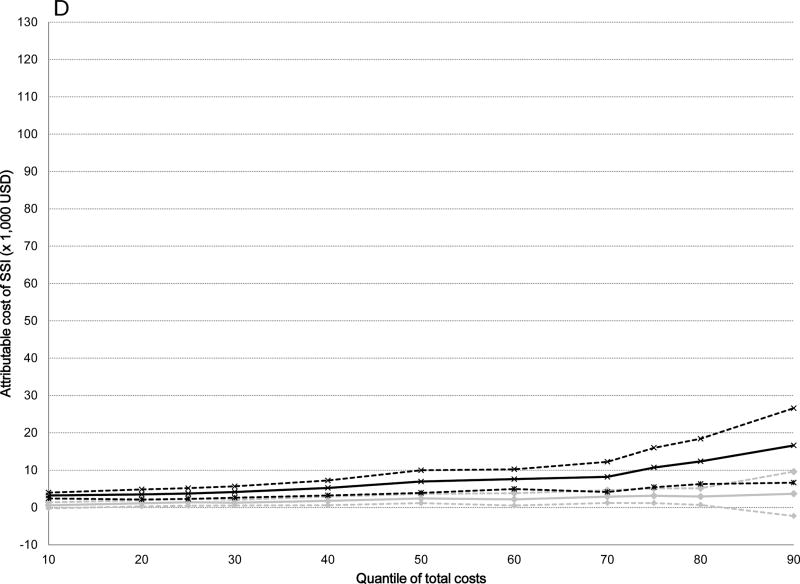
The attributable median costs of infection were significantly higher for serious versus non-serious SSIs after all surgical procedures: 5-fold higher for ACL ($19,356 versus $3,735), 10-fold higher for cholecystectomy ($21,451 versus $2,219), 5-fold higher for hernia repair ($16,489 versus $3,028), and 3-fold higher for serious versus non-serious SSI after BCS ($6,959 versus $2,425) (Table 4). The attributable costs of both non-serious and serious SSIs increased from the 10th to the 90th percentile of total costs (Table 4). The graphs displayed in Figure 2 plot the attributable costs for non-serious and serious SSIs across the percentile distribution of total costs for the four surgical procedures, controlling for all covariates. The attributable costs for both non-serious and serious SSIs after ACL reconstruction increased 6-fold from the 10th to the 90th percentiles of the cost distribution (Figure 2 and Table 4). A 6-fold increase in attributable costs for non-serious SSIs from the 10th to the 90th percentile was seen in the BCS cohort, with a 5-fold increase in attributable costs of serious SSIs. The attributable costs after cholecystectomy increased 4-fold for non-serious SSIs and 15-fold for serious SSIs, while the attributable costs of non-serious SSIs increased 7-fold and 11-fold for serious SSIs after hernia repair from the 10th to the 90th percentiles. Overall, the attributable costs of both non-serious and serious SSIs were lower after BCS than for the other three surgery types.
Table 4.
Attributable Costs (2014 USD) of Non-Serious and Serious Surgical Site Infection (SSI) From Quantile Regression Models at the 10th, 50th, and 90th Deciles of Total Medical Costs
| 10th Decile Attributable Costs (95% CI) |
50th Decile Attributable Costs (95% CI) |
90th Decile Attributable Costs (95% CI) |
|
|---|---|---|---|
| ACL reconstruction | |||
| Non-serious SSI | 2,693 (840, 4,546) | 3,735 (−847, 8,317) | 16,602 (2,729, 30,475) |
| Serious SSI | 8,570 (5,721, 11,419) | 19,356 (15,499, 23,213) | 48,767 (33,071, 64,463) |
| Cholecystectomy | |||
| Non-serious SSI | 1,529 (491, 2,567) | 2,219 (555, 3,884) | 5,662 (−1,631, 12,955) |
| Serious SSI | 5,860 (4,435, 7,285) | 21,451 (16,080, 26,822) | 89,371 (48,738, 130,004) |
| Hernia repair | |||
| Non-serious SSI | 943 (462, 1,424) | 3,028 (1,898, 4,157) | 6,493 (3,167, 9,818) |
| Serious SSI | 4,432 (2,982, 5,883) | 16,489 (14,190, 18,788) | 50,398 (35,154, 65,643) |
| BCS | |||
| Non-serious SSI | 591 (−206, 1,388) | 2,425 (1,168, 3,681) | 3,677 (−2,268, 9,623) |
| Serious SSI | 3,222 (2,437, 4,008) | 6,959 (3,933, 9,984) | 16,630 (6,667, 26,594) |
ACL indicates anterior cruciate ligament; BCS, breast-conserving surgery; CI, confidence interval.
Figure 2.
Attributable costs of non-serious and serious surgical site infection (SSI) from the quantile regression models across the distribution of total costs. Black lines indicate serious SSI, gray lines indicate non-serious SSI; dashed lines indicate 95% confidence intervals. A) Anterior Cruciate Ligament Reconstruction B) Cholecystectomy C) Hernia Repair D) Breast-Conserving Surgery.
Interquantile regression was used to quantify the cost differences of non-serious and serious SSIs at different points of the cost distribution (Table 5). For BCS and ACL, the parameter estimates for non-serious and serious SSIs were not significant in any of the three interquantile models, indicating that costs attributable to serious vs. non-serious SSIs did not vary significantly between the tested quantiles. For cholecystectomy and hernia repair, the parameter estimates for non-serious SSIs were not significant in any of the three interquantile models; however, the parameter estimates for serious SSIs were significant in all models, indicating significantly increased attributable costs of serious SSIs between the tested quantiles. Correspondingly, the proportion of serious SSIs resulting in reoperation during an inpatient hospitalization were highest in the highest decile for both cholecystectomy and hernia repair (27%), and the proportion diagnosed and treated during an inpatient hospitalization (without reoperation) were higher for both procedures beginning with the 80th percentile and above (59–69% for cholecystectomy, 34–58% for hernia repair) compared to lower deciles in the cost distribution.
Table 5.
Parameter Estimates For Surgical Site Infection (SSI) From Interquantile Regression of Total Costs (in Natural Log Scale)*
| Anterior Cruciate Ligament Reconstruction | Cholecystectomy | Hernia Repair | Breast-Conserving Surgery | |||||
|---|---|---|---|---|---|---|---|---|
| Coeff (std err) | P | Coeff (std err) | P | Coeff (std err) | P | Coeff (std err) | P | |
| 10th to 90th | ||||||||
| Non-serious SSI | 0.155 (0.190) | 0.415 | −0.024 (0.139) | 0.864 | 0.132 (0.088) | 0.133 | −0.066 (0.078) | 0.402 |
| Serious SSI | 0.219 (0.125) | 0.079 | 0.875 (0.128) | <0.001 | 0.463 (0.112) | <0.001 | 0.044 (0.125) | 0.725 |
| 10th to 50th | ||||||||
| Non-serious SSI | −0.057 (0.144) | 0.690 | −0.000 (0.084) | 0.996 | 0.065 (0.058) | 0.264 | −0.017 (0.065) | 0.793 |
| Serious SSI | 0.129 (0.092) | 0.160 | 0.360 (0.099) | <0.001 | 0.261 (0.064) | <0.001 | −0.082 (0.098) | 0.401 |
| 50th to 90th | ||||||||
| Non-serious SSI | 0.212 (0.195) | 0.275 | −0.023 (0.114) | 0.837 | 0.068 (0.079) | 0.390 | −0.049 (0.050) | 0.331 |
| Serious SSI | 0.090 (0.088) | 0.302 | 0.516 (0.120) | <0.001 | 0.202 (0.096) | 0.035 | 0.126 (0.080) | 0.114 |
Models were adjusted for all variables retained in the ordinary least squares regression model; only infection parameters shown here.
Coeff indiates coefficient estimate; std err, standard error.
DISCUSSION
In this observational study of persons undergoing four common ambulatory surgical procedures SSIs were associated with significantly increased total healthcare costs. Serious SSIs were associated with greater costs than non-serious SSIs for all four procedures, which, to our knowledge, has not been previously reported. Additionally, we found differences in costs of SSIs across the distribution of total costs by use of quantile regression, which is not generally accounted for in studies of costs due to infection.
Most prior studies of costs of SSIs reported single cost estimates without discriminating between serious and non-serious SSIs. Recently Schweizer and colleagues reported attributable costs of approximately $7,000 for superficial vs. $25,700 for deep SSIs, but these estimates were calculated for a mixed group of surgical procedures.10 We found significant differences in costs for non-serious and serious SSIs within quantiles for all four procedure types, including median attributable costs. This is especially important because the proportion of SSIs that required hospitalization or surgical treatment (which we termed “serious”) varied by procedure from 50% after BCS compared with 80% after ACL.
The difference we found in attributable costs between serious vs. non-serious SSIs was smallest for BCS. The vast majority of SSIs after BCS are superficial, involving only skin and soft tissue.24 This is consistent with our finding that the proportion of “serious” infections resulting in reoperation during an inpatient hospitalization after BCS was very small (10.7%), while almost 50% of the “serious” SSIs were categorized as such based on a wound care procedure performed outside of the operating room (i.e., in a clinic or at the bedside). In contrast, as we reported previously the majority of SSIs after ACL were coded for septic arthritis,18 which would be expected to result in high costs due to the need for prolonged intravenous antibiotics and surgical treatment, often leading to removal of ligament allografts and subsequent revision surgery. In our cohort, 56% of the serious SSIs after ACL required surgical treatment in the operating room during an inpatient hospitalization. Serious SSIs after hernia repair and cholecystectomy were likely associated with higher costs because of the need for inpatient hospitalization in the majority and abdominal surgery in about 20% of cases, presumably to drain abdominal abscesses and debride devitalized tissue.
For all of the surgical procedures we studied, there was no significant variation in costs of non-serious SSIs across the distribution of total costs, although non-serious SSIs still resulted in significantly increased costs compared to uninfected individuals. Treatment of non-serious infections would likely have involved only outpatient office visits and oral antibiotics (since inpatient hospitalization was incorporated in our definition of serious SSI). For both hernia repair and cholecystectomy, the costs of serious SSIs increased significantly at the higher end of the cost distribution. For both of these procedures, the proportion of serious SSIs diagnosed and treated during an inpatient hospitalization were much higher at the upper (80% and above) than at the lower end of the cost distribution, and the proportion of serious SSIs resulting in reoperation were highest in the two highest deciles. Thus the higher costs of serious SSIs at the upper end of the cost distribution are consistent with increased costs due to additional surgery and hospital length of stay.
Our study has a number of strengths and unique features. We used quantile regression to assess the difference in economic impact of serious and non-serious SSIs across the distribution of overall healthcare costs. Standard analyses often utilize OLS models which only assess mean costs and assume that costs are normally distributed, and that infections impact costs similarly across the cost distribution. Our findings show that models based on differences in mean costs may be insufficient to describe costs due to SSIs and that costs vary depending on the severity of infection. Quantile regression is an infrequently used econometric technique that may have broader applicability in studies of healthcare costs.22,25–28 We used a rich data source that contained information across the spectrum of care from inpatient hospitalizations to outpatient clinic visits and prescriptions. We were able to include all documented infections regardless of site of care rather than only the subset of infections identified at re-admission to the hospital where the index procedure was performed. We also included procedures performed at freestanding ASCs and outpatient surgeries at a hospital. This is very important given the increasing utilization of outpatient surgery for all four of the surgical procedures analyzed.
Our study had several limitations. Coding errors may have resulted in misclassification of other complications as infection. In addition, the sensitivity of ICD-9-CM diagnosis codes to identify SSIs is imperfect, particularly for minor outpatient infections during the 90-day global period for physician reimbursement. The effect of this misclassification would have resulted in under-detection of minor SSIs, and thus our estimates for the attributable costs of non-serious SSIs may overestimate the true costs. The reduced sensitivity to identify non-serious SSIs should not have had significant impact on the calculation of costs attributable to serious infections, since serious SSIs treated in the outpatient setting would be more likely to be coded due to reimbursement of wound care procedures (even in the global reimbursement period), and the sensitivity and positive predictive values of the ICD-9-CM diagnosis codes we used to identify SSIs diagnosed and treated during inpatient hospitalizations are relatively high.29–31 We adjusted for many factors related to both SSI and medical costs in the quantile regression models, but there may still be residual confounding due to omitted variables (i.e., endogeneity). Although the claims database is large and geographically dispersed all patients have private insurance and our findings may not be generalizable to patients with other types of insurance in the US or in other countries.
SSIs, especially serious infections resulting in hospitalization or surgical treatment, were associated with significantly increased healthcare costs after 4 common surgical procedures. Quantile regression illustrated the impact of serious SSIs on healthcare costs across the distribution of costs, especially at the upper end of the cost distribution. This study demonstrates the additional information on healthcare costs that can be obtained by quantile regression modeling, and support use of this method to quantify attributable costs of hospital-acquired infections.
Supplementary Material
Acknowledgments
We thank Cherie Hill for database and computer management support.
Financial support
Funding for this project was provided by the Agency for Healthcare Research and Quality (AHRQ; 5R01HS019713 to MAO). Additional support was provided by the Centers for Disease Control and Prevention (CDC) Epicenters Program (U54CK000162 to VJF). The findings and conclusions in this document are those of the authors, who are responsible for its content, and do not necessarily represent the official view of AHRQ or CDC. We thank the Center for Administrative Data Research (CADR) for access to the American Hospital Association (AHA) Annual Survey of Hospitals data. CADR is supported in part by the Washington University Institute of Clinical and Translational Sciences grant UL1 TR000448 from the National Center for Advancing Translational Sciences (NCATS) of the National Institutes of Health (NIH), and grant number R24 HS19455 through the Agency for Healthcare Research and Quality (AHRQ).
Footnotes
Potential conflicts of interest
MAO reports consultant work with Merck, Pfizer, and Sanofi Pasteur and grant funding through Cubist Pharmaceuticals, Pfizer, and Sanofi Pasteur for work outside the submitted manuscript. DKW reports consultant work with Centene Corp. and Novaerus Inc. for work outside the submitted manuscript. VJF reports personal fees from Battelle outside the submitted manuscript; her spouse is employed by Express Scripts. All other authors report no conflicts of interest relevant to this article.
References
- 1.Magill SS, Edwards JR, Bamberg W, et al. Multistate point-prevalence survey of health care-associated infections. N Engl J Med. 2014;370:1198–1208. doi: 10.1056/NEJMoa1306801. [DOI] [PMC free article] [PubMed] [Google Scholar]
- 2.Anderson DJ, Podgorny K, Berrios-Torres SI, et al. Strategies to prevent surgical site infections in acute care hospitals: 2014 update. Infect Control Hosp Epidemiol. 2014;35(Suppl 2):S66–S88. doi: 10.1017/s0899823x00193869. [DOI] [PubMed] [Google Scholar]
- 3.Merkow RP, Ju MH, Chung JW, et al. Underlying reasons associated with hospital readmission following surgery in the United States. JAMA. 2015;313:483–495. doi: 10.1001/jama.2014.18614. [DOI] [PubMed] [Google Scholar]
- 4.Olsen MA, Butler AM, Willers DM, et al. Attributable costs of surgical site infection and endometritis after low transverse cesarean delivery. Infect Control Hosp Epidemiol. 2010;31:276–282. doi: 10.1086/650755. [DOI] [PMC free article] [PubMed] [Google Scholar]
- 5.Hollenbeak CS, Murphy DM, Koenig S, et al. The clinical and economic impact of deep chest surgical site infections following coronary artery bypass graft surgery. Chest. 2000;118:397–402. doi: 10.1378/chest.118.2.397. [DOI] [PubMed] [Google Scholar]
- 6.Zimlichman E, Henderson D, Tamir O, et al. Health care-associated infections: a meta-analysis of costs and financial impact on the US health care system. JAMA Intern Med. 2013;173:2039–2046. doi: 10.1001/jamainternmed.2013.9763. [DOI] [PubMed] [Google Scholar]
- 7.Whitehouse JD, Friedman D, Kirkland KS, et al. The impact of surgical-site infections following orthopedic surgery at a community hospital and a university hospital: adverse quality of life, excess length of stay, and extra cost. Infect Control Hosp Epidemiol. 2002;23:183–189. doi: 10.1086/502033. [DOI] [PubMed] [Google Scholar]
- 8.Olsen MA, Chu-Ongsakul S, Brandt KE, et al. Hospital-associated costs due to surgical site infection after breast surgery. Arch Surg. 2008;143:53–60. doi: 10.1001/archsurg.2007.11. [DOI] [PubMed] [Google Scholar]
- 9.de Lissovoy G, Fraeman K, Hutchins V, et al. Surgical site infection: incidence and impact on hospital utilization and treatment costs. Am J Infect Control. 2009;37:387–397. doi: 10.1016/j.ajic.2008.12.010. [DOI] [PubMed] [Google Scholar]
- 10.Schweizer ML, Cullen JJ, Perencevich EN, et al. Costs associated with surgical site infections in Veterans Affairs hospitals. JAMA Surg. 2014 doi: 10.1001/jamasurg.2013.4663. [DOI] [PMC free article] [PubMed] [Google Scholar]
- 11.Cullen KA, Hall MJ, Golosinskiy A. Ambulatory surgery in the United States, 2006. Natl Health Stat Report. 2009:1–25. [PubMed] [Google Scholar]
- 12.Hollingsworth JM, Birkmeyer JD, Ye Z, et al. Specialty-specific trends in the prevalence and distribution of outpatient surgery: implications for payment and delivery system reforms. Surg Innov. 2014;21:560–565. doi: 10.1177/1553350613520515. [DOI] [PubMed] [Google Scholar]
- 13.Rhee C, Huang SS, Berrios-Torres SI, et al. Surgical site infection surveillance following ambulatory surgery. Infect Control Hosp Epidemiol. 2015;36:225–228. doi: 10.1017/ice.2014.23. [DOI] [PMC free article] [PubMed] [Google Scholar]
- 14.Mitchell P, Gottschalk M, Butts G, et al. Surgical site infection: A comparison of multispecialty and single specialty outpatient facilities. J Orthop. 2013;10:111–114. doi: 10.1016/j.jor.2013.07.005. [DOI] [PMC free article] [PubMed] [Google Scholar]
- 15.Bekelis K, Missios S, Kakoulides G, et al. Selection of patients for ambulatory lumbar discectomy: results from four US states. Spine J. 2014;14:1944–1950. doi: 10.1016/j.spinee.2013.11.038. [DOI] [PubMed] [Google Scholar]
- 16.Orosco RK, Lin HW, Bhattacharyya N. Ambulatory thyroidectomy: a multistate study of revisits and complications. Otolaryngol Head Neck Surg. 2015 doi: 10.1177/0194599815577603. [DOI] [PubMed] [Google Scholar]
- 17.Nickel KB, Wallace AE, Warren DK, et al. Using claims data to perform surveillance for surgical site infection: The devil is in the details. In: Battles JB, Cleeman JI, Kahn KK, et al., editors. Advances in the Prevention and Control of HAIs. Rockville (MD): Agency for Healthcare Research and Quality (US); 2014. pp. 169–182. Publication No. 14-0003. [Google Scholar]
- 18.Warren DK, Nickel KB, Wallace AE, et al. Can additional information be obtained from claims data to support surgical site infection diagnosis codes? Infect Control Hosp Epidemiol. 2014;35(Suppl 3):S124–S132. doi: 10.1086/677830. [DOI] [PMC free article] [PubMed] [Google Scholar]
- 19.Olsen MA, Nickel KB, Margenthaler JA, et al. Increased risk of surgical site infection among breast-conserving surgery re-excisions. Ann Surg Oncol. 2015;22:2003–2009. doi: 10.1245/s10434-014-4200-x. [DOI] [PMC free article] [PubMed] [Google Scholar]
- 20.National Healthcare Safety Network (NHSN) Procedure-Associated (PA) module: surgical site infection (SSI) event. Centers for Disease Control and Prevention; Jul, 2013. [Accessed November 14, 2013]. Available at: http://www.cdc.gov/nhsn/PDFs/pscManual/9pscSSIcurrent.pdf. [Google Scholar]
- 21.Bureau of Labor Statistics. Consumer price index. United States Department of Labor; 2015. [Accessed May 15, 2015]. Available at: http://www.bls.gov/cpi/data.htm. [Google Scholar]
- 22.Beyerlein A. Quantile regression-opportunities and challenges from a user’s perspective. Am J Epidemiol. 2014;180:330–331. doi: 10.1093/aje/kwu178. [DOI] [PubMed] [Google Scholar]
- 23.Gebregziabher M, Lynch CP, Mueller M, et al. Using quantile regression to investigate racial disparities in medication non-adherence. BMC Med Res Methodol. 2011;11:88. doi: 10.1186/1471-2288-11-88. [DOI] [PMC free article] [PubMed] [Google Scholar]
- 24.Vitug AF, Newman LA. Complications in breast surgery. Surg Clin North Am. 2007;87:431–451. doi: 10.1016/j.suc.2007.01.005. [DOI] [PubMed] [Google Scholar]
- 25.Hall BL, Campbell DA, Jr, Phillips LR, et al. Evaluating individual surgeons based on total hospital costs: evidence for variation in both total costs and volatility of costs. J Am Coll Surg. 2006;202:565–576. doi: 10.1016/j.jamcollsurg.2005.12.015. [DOI] [PubMed] [Google Scholar]
- 26.Stoltzfus JC, Nishijima D, Melnikow J. Why quantile regression makes good sense for analyzing economic outcomes in medical research. Acad Emerg Med. 2012;19:850–851. doi: 10.1111/j.1553-2712.2012.01386.x. [DOI] [PubMed] [Google Scholar]
- 27.Lo T, Parkinson L, Cunich M, et al. Factors associated with higher healthcare costs in individuals living with arthritis: evidence from the quantile regression approach. Expert Rev Pharmacoecon Outcomes Res. 2015:1–9. doi: 10.1586/14737167.2015.1037833. [DOI] [PubMed] [Google Scholar]
- 28.Chen J, Vargas-Bustamante A, Mortensen K, et al. Using quantile regression to examine health care expenditures during the Great Recession. Health Serv Res. 2014;49:705–730. doi: 10.1111/1475-6773.12113. [DOI] [PMC free article] [PubMed] [Google Scholar]
- 29.Olsen MA, Fraser VJ. Use of diagnosis codes and/or wound culture results for surveillance of surgical site infection after mastectomy and breast reconstruction. Infect Control Hosp Epidemiol. 2010;31:544–547. doi: 10.1086/652155. [DOI] [PMC free article] [PubMed] [Google Scholar]
- 30.Calderwood MS, Ma A, Khan YM, et al. Use of Medicare diagnosis and procedure codes to improve detection of surgical site infections following hip arthroplasty, knee arthroplasty, and vascular surgery. Infect Control Hosp Epidemiol. 2012;33:40–49. doi: 10.1086/663207. [DOI] [PubMed] [Google Scholar]
- 31.Letourneau AR, Calderwood MS, Huang SS, et al. Harnessing claims to improve detection of surgical site infections following hysterectomy and colorectal surgery. Infect Control Hosp Epidemiol. 2013;34:1321–1323. doi: 10.1086/673975. [DOI] [PubMed] [Google Scholar]
Associated Data
This section collects any data citations, data availability statements, or supplementary materials included in this article.


