Abstract
Bone morphogenetic protein 2 regulates chondrogenesis and cartilage formation. However, it also induces chondrocyte hypertrophy and cartilage matrix degradation. We recently designed three peptides CK2.1, CK2.2, and CK2.3 that activate the BMP signaling pathways by releasing casein kinase II (CK2) from distinct sites at the bone morphogenetic protein receptor type Ia (BMPRIa). Since BMP2 is a major regulator of chondrogenesis and the peptides activated BMP signaling in a similar way, we evaluated the effect of these peptides on chondrogenesis and cartilage formation. C3H10T1/2 cells were stimulated with CK2.1, CK2.2, and CK2.3 and evaluated for the chondrogenic and osteogenic potential. For chondrogenesis, Alcian blue staining was performed. Additionally, collagen types II and × expression was measured. For osteogenesis, osteocalcin and von Kossa staining were performed. From the three peptides, CK2.1 was the most promising peptide to induce chondrogenesis but not osteogenesis. To investigate the effect of CK2.1 on articular cartilage formation in vivo, we injected CK2.1 into the tail vein of mice. Injection of CK2.1 into the tail vein of mice led to increased articular cartilage formation but not BMD. In sharp contrast, injection of BMP2 led to increased BMD and expression of collagen type X, a marker of chondrocyte hypertrophy. MMP13 expression was unchanged. Our study demonstrates that CK2.1 drives chondrogenesis and cartilage formation without induction of chondrocyte hypertrophy. Peptide CK2.1 may, therefore, be a valuable therapeutic for cartilage degenerative diseases.
Keywords: cartilage, casein kinase 2, bone morphogenetic protein 2, peptide, hypertrophy
Growth factors greatly influence the development and behavior of articular chondrocytes. Among these growth factors, bone morphogenetic proteins (BMPs), especially bone morphogenetic protein 2 (BMP2), drive the development and maintenance of articular chondrocytes.1 BMP2 is a potent growth factor consisting of many pleiotropic functions, and plays a crucial role in the formation of the articular cartilage (AC).2, 3 It drives the development of cartilage and induces the differentiation of mesenchymal progenitor cells (MPCs) into chondrocytes.4, 5 It also plays a role in the maintenance of mature articular chondrocytes.1 One of the major drawbacks for the use of BMP2 as a therapeutic is that BMP2 affects all stages of chondrocyte differentiation. As a result, its known to induce chondrocyte hypertrophy followed by cartilage calcification.3 Therefore, BMP2 may not be valuable as a therapeutic for cartilage formation or for cartilage restoration in degenerative diseases such as osteoarthritis (OA).
BMP2 signals through binding to types I and II serine/threonine kinase receptors. Upon ligand binding, type I receptor is phosphorylated by the constitutively active type II receptor at the GS box (glycine/ serine-rich region) to initiate downstream signaling.5 We previously reported that the protein casein kinase II (CK2) interacts with the bone morphogenetic protein receptor type Ia (BMPRIa).5 Binding of BMP2 to BMPRIa releases CK2 and activates the smad 1/5/8 pathway (Fig. 1).5 We designed three peptides CK2.1, CK2.2, and CK2.3 that inhibit the binding of CK2 to BMPRIa and activate the BMP signaling pathway in the absence of BMP ligand.5 Treatment of C2C12 cells with the peptide CK2.3 resulted in osteogenesis, whereas stimulation of C2C12 cells with CK2.2 resulted in adipogenesis and osteogenesis.6, 7 Mutation of the CK2 phosphorylation sites on BMPRIa confirmed these effects.8 Moreover, CK2.3 and CK2.2 activate the Smad signaling pathway.7 Recent work also showed that CK2.3 induced bone formation in C57BL/6J mice, leads to increased bone mineral density (BMD) and mineral apposition rate.6 However, current data also show that the peptides CK2.3 and CK2.2 are more specific in the activation of the non-canonical BMP signaling pathways.8 Since BMP2 signaling is also a major pathway activated during cartilage formation and growth, we evaluated the potential of the peptides to induce chondrogenesis and articular cartilage formation in vitro and in vivo. We found that one of the peptides CK2.1 is a potent inducer of chondrogenesis. Stimulation of C3H10T1/2 cells with CK2.1 led to increased proteoglycan synthesis and collagen type II expression. In sharp contrast to BMP2, CK2.1 did not lead to increased collagen type × and osteocalcin expression. Systemic injection of CK2.1 led to increased articular cartilage formation. Again in contrast to BMP2, CK2.1 did not induce collagen type × expression; however, it led to increased collagen type IX expression in vivo. Moreover, injection of CK2.1 into the tail vain of mice did not lead to an increase in BMD as measured by pQCT. Taken together, these data suggest that CK2.1 induces articular cartilage formation without induction of hypertrophy.
Figure 1.
Proposed mechanism of action of the peptide CK2.1 based on previous data.5 (A) Schematic demonstrates the known mechanism of BMP2-mediated BMPRIa activation described according to the literature as follows: (1) Ligand binding to the BMPRIa and BMPRII receptor complex leads to the (2) release of CK2 allowing for phosphorylation of (3) downstream signaling. (B) Schematic illustrates the possible mechanism of peptide through the activation of BMPRIa downstream signaling as follows: (1) Peptide CK2.1 blocking of CK2 interaction to BMPRIa leads to (2) downstream signaling.
MATERIALS AND METHODS
Mouse Injections
C57BL/6J mice were obtained from the Jackson Laboratory (Bar Harbor, ME) and maintained under conventional conditions. The animal protocol was approved by IUCAC at the University of Delaware. Eight-week-old female mice (C57BL/ 6J) were injected with peptides diluted in PBS via the tail vein at 8 weeks of age (n = 7 per group). A volume of 50 µl was injected for 5 consecutive days. CK2.1 injections were performed at a concentration of 1.7 µg/kg. As a positive control, BMP2 was injected at a concentration of 5µg/kg. Systemic delivery of 5 µg/kg BMP2 for 20 days was shown previously to increase bone formation in mice. The ratio of BMP2 to CK2.1 peptide is based on the fact that 40 nM BMP2 showed similar effects as 100 nM CK2.1 in vitro.7 As a negative control, PBS was injected into mice.
Cell Culture
C3H10T1/2 cells were used as they are a well-established model for chondrogenesis and are responsive to BMP2.10, 11 These cells were purchased from American Type Culture Collection (CCL-26) (Manassas, VA) and monolayer cultures were maintained in T-75 flasks grown in Dulbecco’s modified Eagle’s medium (DMEM) (Mediatech, Manassas, VA) supplemented with 10% (v/v) fetal bovine serum (FBS) (Gemini Bioproducts, West Sacramento, CA), 0.5% (v/v) l-glutamine (Mediatech), and 1% (v/v) penicillin/streptomycin (100 IU/ml penicillin, 100 µg/ml streptomycin) (Fisher Scientific, Pittsburg, PA). Cultures were incubated at 37°C and 5% CO2, and cells were passaged at 90% confluency with 0.05% Trypsin-EDTA (Gemini Bioproducts).
Design of Peptides
Peptides were designed by our group as previously described.5 A prosite search including patterns with high probability of occurrence on BMPRIa yielded possible CK2 phosphorylation sites located at amino acids 213–217 (SLKD), 324–328 (SLYD), and 466–469 (SYED). The peptides were designed with the Antennapedia homeodomain signal sequence for cellular uptake and incorporated in one these binding sites: CK2.1 (SYED), CK2.2 (SLYD), or CK2.3 (SLKD). The peptides included several amino acid residues flanking each side.5
Alcian Blue Staining
C3H10T1/2 cells were seeded at 1 × 10⁷ cells/ml and plated as 10 µl micromass culture in a 1.9 cm2 24-well plate (Nunc, Rocskilde, Denmark). Cells were supplemented with DMEM with 10% FBS and incubated at 37°C and 5% CO2. Cells were then stimulated with recombinant BMP2 (40 nM, or 200 nM), CK2.1, CK2.2, and CK2.3 (100 nM,) purchased from Genscript (Piscataway, NJ, USA). Peptide concentrations of 100 nM is equivalent to the effect of BMP2 at 40 nM, hence the experimental setups were stimulated accordingly,7, 11
Seven days after, stimulation cultures were fixed using 10% neutral buffered formalin (pH 7.4) mixed with 0.05% wt/v cetylpyridinium chloride for 20 min at room temperature. Cells were rinsed three times with 3% glacial acetic acid (pH 1.0), and stained using 0.5% Alcian blue 8-GX stain (Life line, Walkersville, MD) overnight. After staining, cultures were rinsed with 3% glacial acetic acid (pH 1.0) and air dried. Stained cultures were viewed under an inverted light microscope (Nikon, TMS-f) using 20× magnification and the collected images were analyzed and quantified with ImageJ software (NIH, Bethesda).12
Von Kossa Staining
C3H10T1/2 cells were seeded at 1 × 10⁴ cell/cm2 and were grown to 90% confluence in 1.9 cm2 24-well plate. These cells were treated with CK2.1 (100 nM or 500 nM) and equivalent concentrations of BMP2 (40 nM or 200 nM). For comparison, cells were also stained with CK2.2, CK2.3 at 100nM. Von Kossa was performed as described by us previously.5
Smad Reporter Assay
C3H10T1/2 cells were cultured on 60 mm dishes to 90% confluence. Prior to transfection, cells were serum starved in DMEM media without FBS overnight. Cells were transfected with 2 µg of plasmids encoding pSBE-luc (Smad binding element) tagged firefly luciferase and pRLuc tagged with renilla luciferase (Promega, Madison, Wisconsin) using turbofect (Fermentas, Glen Burnie, MD) transfecting reagent, according to manufacturer’s protocol, in DMEM media supplemented with 10% FBS. The pSBE contains a BMP-responsive Smad-binding elements as a readout for Smad signaling.13, 14 After transfection, cells were stimulated or not stimulated for 24 h with 40 nM or 200 nM of BMP2, 100 nM or 500nM of peptide CK2.1, or 100nM of peptide CK2.2, or CK2.3. Cells were lysed with 1× passive lysis buffer (Biotium, Hayward, CA) and reporter gene assay was performed with a dual luciferase assay kit (30005-2) (Biotium).
Peripheral Quantitative Computed Tomography (pQCT)
Isolated femur lengths were measured with digital calipers (Stoelting, Wood Dale, IL), then femurs were measured for density using the SA Plus densitometer (Orthometrics, Stratec SA plus Research Unit, White Plains, NY). Calibration of the SA Plus instrument was done with hydroxyapatite standards of known density (50–1,000 mg/mm3) with cylindrical diameters 2.4 mm and length 24 mm that approximate mouse femurs. Assessment of defined thickness aluminum foils indicated accurate measurement of the 0.25 mm thick foil, whereas a 0.02mm thick foil could not be measured. The bone scans were analyzed with distinct threshold settings to separate bone from soft tissue. Thresholds of 710 and 570 mg/cm3 were used to determine cortical bone areas and surfaces. These thresholds were selected to yield area values consistent with histomorphometrically derived values and the defined density standards noted above. To determine mineral content, a second analysis was carried out with thresholds of 220 and 400 mg/cm3. These lower thresholds were selected so that mineral from most partial voxels (0.07 mm) would be included in the analysis. Density values were calculated from the summed areas and associated mineral contents. Precision of the SA Plus for repeated measurement of a single femur was found to be 1.2%. Isolated femurs were scanned at seven locations at 2-mm intervals, beginning 0.8mm from the distal ends of the epiphyseal condyles. Due to variation in femur lengths, the femoral head could not be scanned at the same location for each bone, and thus was not included in final data. Total vBMD values were calculated by dividing the total mineral content by the total bone volume (bone + marrow) and expressed as mg/mm3.6, 15, 16
Histology
After 4 weeks, mice were sacrificed and extracted femurs were fixed in 10% Neutral Buffered Formalin (Sigma– Aldrich, St.Louis, MO) and decalcified for 5 days in 5% formic acid in 10% sodium citrate (Sigma–Aldrich). Samples were bisected longitudinally through interchondular notch to separate medial and lateral condials for paraffin embedding. Paraffin embedded blocks were sliced to 6-mm thickness and stained by Safranin O and fast green staining.17 The following samples were measured for AC formation using the width in seven different places on each samples and normalized to controls.
Immunostaining
Sectioned femur samples (pre-treated in xylene for 10 min to clear away the paraffin) and C3H10T1/2 cells plated on coverslips were incubated with testicular hyaluronidase for 30 min to expose collagen epitopes. The samples were immunofluorescently labeled for 1 h at room temperature either with rabbit polyclonal IgG collagen type II (10 µg/ml, ab34712, Abcam, Cambridge, UK) followed by Alexa 546 donkey anti-rabbit IgG (2 µg/ml. Abcam) or rabbit polyclonal collagen IX (10 µg/ml, Abcam) followed by Alexa 647 goat anti-rabbit IgG (2 µg/ml, Invitrogen, Eugene, OR) or goat polyclonal IgG MMP13 (10 µg/ml, Santa Cruz Biotechnology, Santa Cruz, CA) followed by Alexa 568 donkey anti-goat (2 µg/ml, Invitrogen) or Rabbit (Rb) pAb collagen × (10 µg/ml, ab58632, Abcam) followed by Alexa flour 488 donkey anti-rabbit (2 µg/ml, Invitrogen) or rabbit polyclonal IgG osteocalcin (10 µg/ml, Santa Cruz Biotechnology) followed by Alexa flour 488 donkey anti-rabbit (2 µg/ml, Invitrogen). Antibodies were diluted in 3% BSA. The nuclear stain bisbenzimide (Sigma–Aldrich, Hoechst dye No. 33258, dissolved in H2O) was administered for 5 min and coverslips were mounted on slides using Airvol as described previously.18, 19 Images were taken (n = 8 image sections/sample) on the Zeiss 780 confocal with a 20× objective (0.75NA, Beam Splitter [MBS] 458/514/ 561/633, 5% laser output, and [MBS] 405, 2% laser output). Images were quantified using ImageJ (NIH, Bethesda).
Statistical Data Analysis
All data presented were analyzed using single factor ANOVA, followed by Tukey–Kramer post-hoc test. All experiments were repeated three or more times and normalized to control. Chauvenet’s criterion was used to remove outliers. Error bars represent standard error of the mean (SEM), where * denotes (p < 0.05) and ** denotes (p < 0.01) statistical significance.
RESULTS
CK2.1, But Not CK2.2 or CK2.3, Induced Chondrogenesis in C3H10T1/2 Micromasses
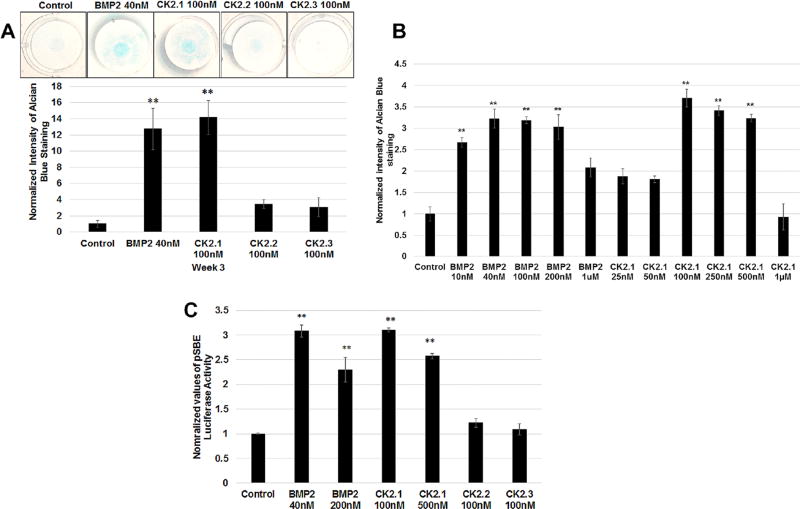
To evaluate the effect of CK2.1, CK2.2, and CK2.3 on chondrogenesis, C3H10T1/2 cells were cultured as micromasses and stimulated with 100 nM of the corresponding peptides. Cells were stimulated with the peptides at 100 nM a 2.5 times higher concentration compared to BMP2 at 40 nM based on previous experiments.7 After stimulating C3H10T1/2 micromasses for 3 weeks, proteoglycan synthesis, a marker for chondrogenesis, was evaluated by Alcian blue staining.11 As positive control cells were stimulated with BMP2 (40 nM). As Figure 2A demonstrates only CK2.1-induced chondrogenesis in C3H10T1/2 cells similar to BMP2 stimulations. Optimal dosage of peptide CK2.1-induced chondrogenesis was analyzed using a concentration gradient stimulations on the C3H10T1/2 micromasses (Fig. 2B). This resulted in optimal dose range of the peptide at low dose of 100 nM to high dose at 500 nM as previously seen in C2C12 cells for osteogenesis.7 To test whether this CK2.1-induced chondrogenesis is via the activation of BMP signaling pathway, we used a Smad reporter gene assay using the luciferase reporter construct pSBE-luc. C3H10T1/2 cells transfected with pSBE-luc and pRLUC (control for transfection efficiency) were stimulated with low and high doses of peptide CK2.1 and equivalent concentration of BMP2. Only cells stimulated with peptide CK2.1 and BMP2 but not CK2.2 or CK2.3 resulted in a significant increase in SMAD activity and this SMAD activation was similar between BMP2 and CK2.1 across equivalent concentrations (Fig. 2C).
Figure 2.
CK2.1 but not CK2.2 or CK2.3 induced chondrogenesis in C3H10T1/2 cells. (A) C3H10T1/2 micromass cultures were treated with either BMP2 (40 nM) or peptides CK2.1 and CK2.2, CK2.3 at (100nM) and stained with Alcian blue for 3 weeks. BMP2-and CK2.1-treated cells showed a significant increase of ECM containing proteoglycans. (B) Concentration curve of micromass stimulated with CK2.1 and BMP2. The treatments identified the concentrations of CK2.1 at 100–500nM as the optimal doses for inducing chondrogenesis. (C) Smad reporter gene assay performed on C3H10T1/2 cells stimulated with CK2.1 at 100nM or 500nM, CK2.2 and CK2.3 at 100 nM, and BMP2 at 40nM or 200 nM. Only CK2.1 and BMP2 induced Smad activity and similar SMAD activity was observed across the equivalent concentrations.
C3H10T1/2 Cells Stimulated With CK2.1 and BMP2 Induced Collagen Type II Expression
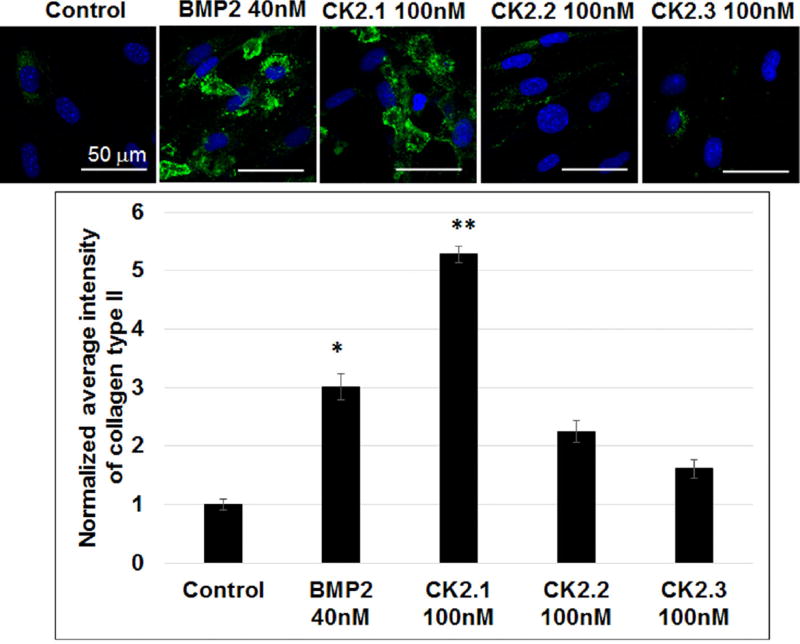
To further confirm peptide CK2.1-induced chondrogenic differentiation, we examined collagen type II production in C3H10T1/2 cells. Chondrocytes actively produce collagen type II, which make up the majority of collagen network in cartilage. Therefore, we stimulated C3H10T1/2 cells with the peptides CK2.1, CK2.2, and CK2.3 for 3 weeks. As positive control cells were stimulated or not with BMP2. Cells were fixed and immunostained for collagen type II. Expression of collagen type II was quantified by confocal microscopy (Fig. 3). Results demonstrate a significant increase in collagen type II production in CK2.1-stimulated cells.
Figure 3.
CK2.1 induced collagen type II production in C3H10T1/2 cells. C3H10T1/2 cells were stimulated with CK2.1, CK2.2, and CK2.3 at 100 nM or with equivalent concentration of BMP2 40 nM. Both CK2.1 and BMP2 induced positive chondrogenic differentiation as a measure of collagen type II compared to control. Scale bar representing 50 µm.
BMP2, CK2.2, CK2.3, But Not CK2.1, Induced Mineralization in C3H10T1/2 Cells
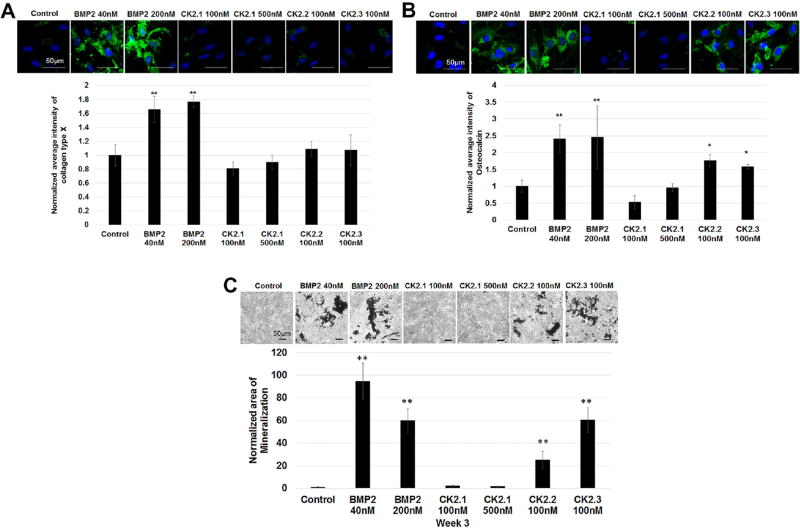
BMP2 is known to induce chondrogenic as well as osteogenic differentiation in MPCs.10, 20 BMP2 influence on chondrocytes is also known to induce chondrocyte hypertrophy and the regulation of collagen type X.21 Our previous work demonstrated strong osteogenic capability of BMP2 and the peptides in C2C12 cells.7 Therefore, C3H10T1/2 cells were stimulated with CK2.1, CK2.2, and CK2.3 and labeled for collagen type × (marker for chondrocyte hypertrophy) and osteocalcin (marker for osteoblast activity were measured).22 Furthermore, von Kossa staining for the deposition of mineral phosphates was used as an endpoint. Collagen type × expression in cells stimulated with CK2.1 was not significantly higher compared to controls; however, cells stimulated with BMP2 stimulated showed a higher expression level. (Fig. 4A). Moreover, there was no significant elevation in osteocalcin levels or the mineral content in cells stimulated with CK2.1 even at the end of 3 weeks of stimulations compared to controls (Fig. 4). However, BMP2, CK2.3, and CK2.2 induced osteocalcin expression and mineralization.
Figure 4.
BMP2, CK2.2, and CK2.3 but not CK2.1 induced chondrocyte hypertrophy and mineralization of C3H120T1/2 cells. C3H10T1/2 cells cultured for 3 weeks and stimulated with CK2.1 (100 nM or 500 nM), or 100 nM of CK2.2 or CK2.3 and stimulated or not with the equivalent concentration of BMP2 (40 nM or 200 nM) as controls. Cells were fixed and then stained for Hoechst (blue) (A), collagen type × (green) (B), osteocalcin (green) (C), and von Kossa and analyzed for results using ImageJ. Scale bar representing 50 µm.
CK2.1 Injection Into the Tail Vein of Mice Resulted in Increased AC Formation
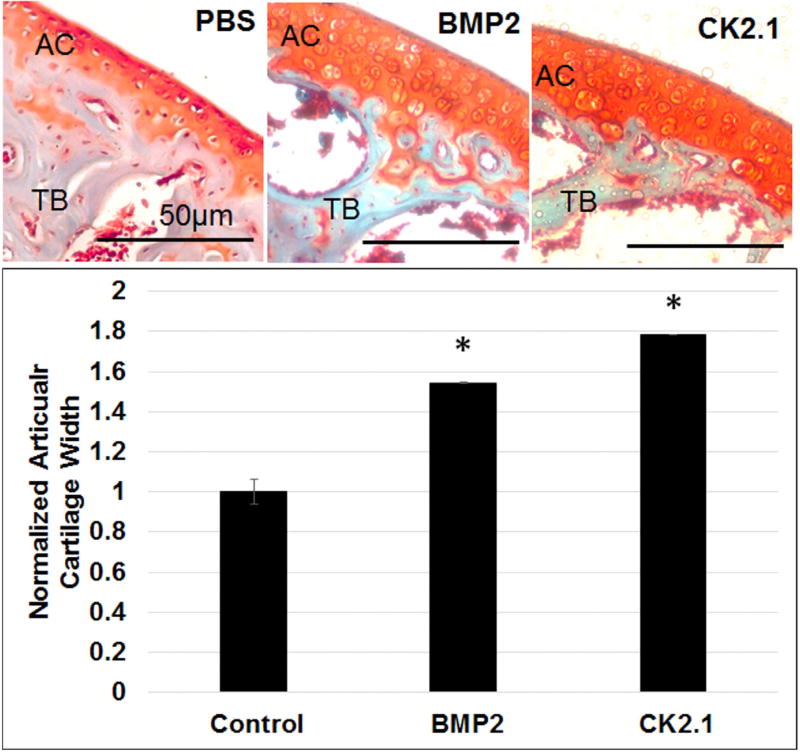
In vitro analysis of CK2.1 demonstrated positive chondrogenic activity without the induction of chondrocyte hypertrophy. Therefore, we investigated the effect of CK2.1 on cartilage formation in vivo. To understand the systemic effects of the peptide CK2.1, C57BL/6J mice were injected via the tail vein over 5 consecutive days. C57BL/6J mice are the most widely used in bred model for biological and biomedical research,23, 24 and were implemented for this study. As a positive control mice were injected with BMP2. Cartilage degenerative diseases like OA affect the AC of diarthroidal joints, but the AC of the long bones like the femurs are mostly affected by this condition.25 Therefore, cartilage turnover is evaluated by studying the articular cartilage that surrounds the femurs in these mice. Four weeks after the last injection, mice were sacrificed, femurs were fixed, decalcified, and paraffin embedded. Paraffin blocks were sectioned at 6-µm thickness and stained with Safranin O and Fast Green.17 Figure 5 shows enhanced AC formation in mice injected with CK2.1 similar to BMP2 and compared to PBS.
Figure 5.
Increased articular cartilage in mice injected with CK2.1 and BMP2. C57BL/6J mice (n = 7/group) were injected with PBS, BMP2, and CK2.1. AC formation was measured in at least in seven regions of each mouse femur and was calculated for width. Scale bar representing 50 µm.
Increased Expression of Collagen Types II and IX Synthesis in the AC of Mice Injected With CK2.1
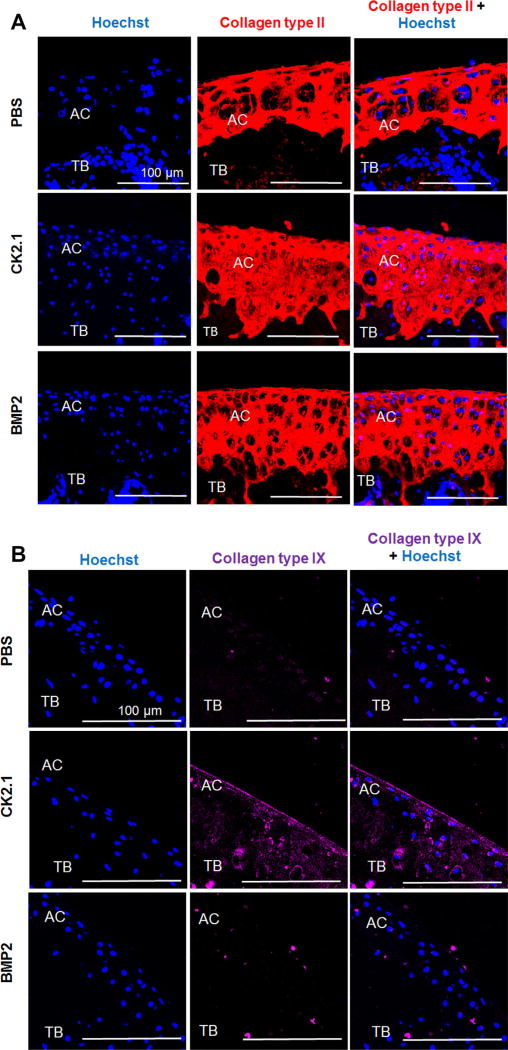
Collagen types II and IX are two markers that are upregulated during AC formation by chondrocytes. Since CK2.1 and BMP2 injection into the tail vein of mice led to increased AC growth, we next analyzed the cartilage sections for collagen types II and IX expression. Collagen type II expression was higher in mice injected with CK2.1 and BMP2 as compared to mice injected with PBS (Fig. 6A). Interestingly, collagen type IX level was higher only in mice injected with CK2.1 but not PBS or BMP2 (Fig. 6B).
Figure 6.
CK2.1 but not BMP2 or PBS induced collagen types II and IX expression in articular cartilage. C57BL/6J mice injected with PBS, CK2.1, and BMP2 were immunostained for collagen type II (red) and collagen type IX (magenta). Hoechst (blue) was used to determine the nucleus of the residing cell and location (AC: articular cartilage; TB: trabecular bone). (A) CK2.1- and BMP2-injected mice expressed relatively equivalent collagen type II levels. (B) CK2.1-injected mice demonstrated an increased expression of collagen type IX in AC but not BMP2- or PBS-injected mice. Images of the AC were imaged (n = 7/group). Scale bar representing 100 µm.
Increased Expression of Collagen Type × in Mice Injected With BMP2 But Not CK2.1
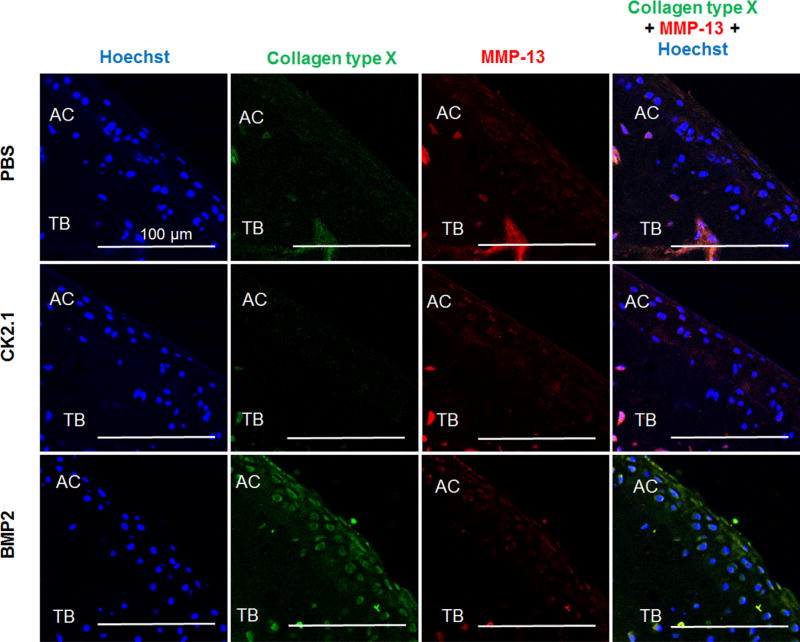
One of the major drawbacks for using BMP2 as a therapeutic for cartilage repair is that BMP2 induces chondrocyte hypertrophy. Therefore, we next immunofluoresecently stained the cartilage sections for collagen type × and MMP13, both markers for chondrocyte hypertrophy.26, 27 As Figure 7 demonstrates, collagen type × is upregulated in mice injected with BMP2.
Figure 7.
BMP2 but not CK2.1 or PBS induced collagen type × expression in articular cartilage. C57BL/6J mice injected with PBS, CK2.1, and BMP2 were immunostained for collagen type × (green) and MMP-13 (red). Hoechst stain (blue) was used to determine the nucleus of the residing cell and location (AC: articular cartilage; TB: trabecular bone). Images of the AC were imaged (n = 7/group). Immunostaining demonstrates increased collagen type × expression in AC of BMP2-injected mice but not CK2.1- or PBS-injected mice. Scale bar representing 100 µm.
BMD Was Unchanged in Mice Injected With CK2.1
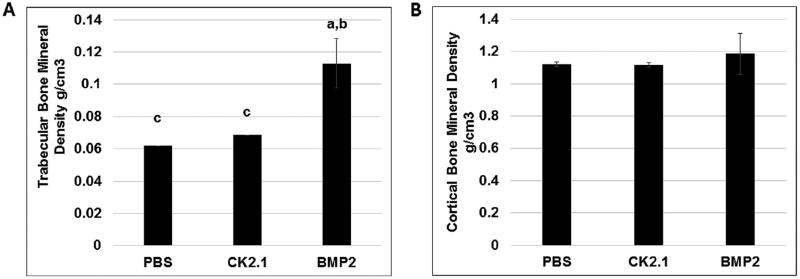
To determine the changes in trabecular BMD and cortical BMD of mice injected with BMP2 and CK2.1, femurs were processed and assessed by pQCT.28 pQCT analysis of femurs from mice injected with CK2.1 showed no changes in trabecular or cortical BMD as compared to PBS-injected mice. However, BMP2-injected mice had a significant increase in trabecular BMD but not cortical BMD (Fig. 8).
Figure 8.
Trabecular BMD is increased in mice injected with BMP2 but not CK2.1. Femurs of mice injected with PBS, CK2.1, and BMP2 (n = 7/group) were analyzed by pQCT. (A) Trabecular bone mineral density. (B) Cortical bone mineral density. Statistically significant compared to (a) PBS, (b) CK2.1, (c) BMP2. (< 0.05).
DISCUSSION
We previously demonstrated the activation of the BMP signaling pathway using peptides CK2.1 (Fig. 1B), CK2.2, and CK2.3 in the absence of the ligand leading to osteogenesis.5–7 In this study, we investigated the ability of the novel peptide CK2.1 to induce chondrogenesis in vitro and in vivo. C3H10T1/ 2 micromasses stimulated with CK2.1 but not CK2.2 and CK2.3 exhibited increased proteoglycan secretion and collagen type II expression similar to that of cells stimulated with BMP2. BMP signaling is also known to induce chondrocyte hypertrophy and osteogenic response in C3H10T1/2 cells.10, 29 This was evident in C3H10T1/2 cell stimulations using peptides CK2.2, and CK2.3 that induced osteocalcin expression and mineral deposition as a consequence of osteoblast differentiation similar to BMP2 stimulations, whereas CK2.1 alone did not. We further confirmed this CK2.1-induced chondrogenic activity was mediated by BMP downstream signaling using Smad reporter assay.
In vivo systemic tail vein injection of CK2.1 and BMP2 in mice resulted in increased AC formation. This study demonstrated the CK2.1 potential in inducing chondrogenesis in similar capacity as BMP2. Previously reported systemic injection of BMP2 in mice at a concentration 0.5–5 µg/kg for 20 consecutive days resulted in increased AC formation.9 In our current study, we saw an increase in TBMD with BMP2 injections along with AC growth. However, mice injected with CK2.1 exhibited no significant growth in other areas of the body except AC. The major differences between CK2.1-injected versus BMP2-injected mice were observed in the collagen composition of the AC ECM. While collagen type II expression is similar in CK2.1- and BMP2-injected mice, differences were observed in collagen type IX expression. Collagen type IX was higher in mice injected with CK2.1 compared to BMP2 or PBS. In sharp contrast, BMP2-injected mice expressed a higher level of collagen type × compared to CK2.1- or PBS-injected mice. The expression of collagen type × in BMP2-injected mice indicates the terminal differentiation of chondrocytes. This effect of BMP2 is well described in the literature.2 Interestingly, mice injected with CK2.1 did not show this effect. This may be due to the time frame of the study or the concentration of CK2.1 used in this study. In vitro analysis as well of collagen type × expression in C3H10T1/2 cells did not demonstrate a significant increase in CK2.1 stimulations compared to BMP2. Moreover, CK2.2 or CK2.3 exhibited no significant collagen type × production in these cells, as they failed in inducing chondrogenic differentiation in these cells. As demonstrated in the dose–response curve, the optimal dose of the peptide CK2.1 in in vitro analysis is at doses between 100 nM and 500 nM. These results are similar to the results found in our previous study in C2C12 cells, where 100nM was the ideal concentration to induce osteogenesis for CK2.1.7 Furthermore, the SMAD activity readout between 100 nM and 500 nM of CK2.1 compared to 40 nM and 200 nM of BMP2 was similar. However, it is not known what effects the peptide CK2.1 may yield at doses beyond the optimized values. As C3H10T1/2 cells are multipotent MSCs, they may illicit different phenotypic effects. Although, the doses used demonstrate chondrogenic activity without the induction of osteogenesis or chondrocyte hyperthrophy within these cells compared to BMP2, this maybe different at higher concentrations. An alternative explanation may be that CK2.1 affects only the differentiation of mesenchymal cells to chondrocytes and maintains their chondrogenic potential. Additionally, injections of BMP2 alone but not CK2.1 led to increased trabecular BMD in mice. Moreover, BMP2, CK2.3, and CK2.2, but not CK2.1, induced mineralization in C3H10T1/2 cells.7 We previously showed that injection of CK2.3 into the tail vein of mice increased trabecular BMD.6 Therefore, the mechanism is still unclear on how CK2.1 induces chondrogenic activity differently than BMP2 ligand utilizing similar signaling pathways without inducing chondrocyte hypertrophy or osteogenesis. However, there are still questions to be answered for future studies, as it is still unclear how CK2.1 actuates this specific response toward the articular capsule, as AC being avascular and can only be explained by the blood supply through the synovial capsule,30 along with the diffusion rates of the peptide into the cells. Furthermore, also to be addressed are the rates of tissue growth due to proteoglycan induced osmotic swelling or that of appositional growth and the ability of CK2.1 induced cartilage repair in disease models. Our data presented here and previously further indicate that CK2.1 as well as CK2.3 may signal through more specific signaling pathways compared to BMP2.6, 7 As included in the hypothetical signaling schematic that illustrates a possible mode of peptide induced BMPRIa activation in Figure 1. However, more experiments are needed to answer these questions. Based on our data, CK2.1 induces chondrogenesis without inducing chondrocyte hypertrophy and may be one of the few peptides developed or proteins discovered with this capability and may be used for cartilage repair in OA-related cartilage loss.
Acknowledgments
We would like to thank Histochemistry and Tissue Processing core Lab at Nemours/Alfred I. duPont Hospital for Children for processing all femurs samples. Dr. Deni Galileo and Dr. Catherine Kirn Safran at the University of Delaware for their continuous support with the equipment and the chemicals provided for this study. The work here is solely the responsibility of the authors and does not necessarily represent the official views of the National Institutes of Health.
Grant sponsor: National Institute of Arthritis and Musculoskeletal and Skin Diseases of the National Institutes of Health; Grant number: NIH 1R01AR064242-010A1.
Footnotes
AUTHORS’ CONTRIBUTIONS
H.A. performed the experiments, quantified and analyzed the data. J.B. injected the mice with CK2.1, PBS, and BMP2. A.N. designed experiments, assisted in data analysis and interpretation of data.
References
- 1.Schmitt B, Ringe J, Häupl T, et al. BMP2 initiates chondrogenic lineage development of adult human mesenchymal stem cells in high-density culture. Differentiation. 2003;71:567–577. doi: 10.1111/j.1432-0436.2003.07109003.x. [DOI] [PubMed] [Google Scholar]
- 2.Shu B, Zhang M, Xie R, et al. BMP2, but not BMP4, is crucial for chondrocyte proliferation and maturation during endochondral bone development. J Cell Sci. 2011;124:3428–3440. doi: 10.1242/jcs.083659. [DOI] [PMC free article] [PubMed] [Google Scholar]
- 3.van der Kraan PM, Blaney Davidson EN, van den Berg WB. Bone morphogenetic proteins and articular cartilage: to serve and protect or a wolf in sheep clothing’s? Osteoarthritis Cartilage. 2010;18:735–741. doi: 10.1016/j.joca.2010.03.001. [DOI] [PubMed] [Google Scholar]
- 4.Senta H, Park H, Bergeron E, et al. Cell responses to bone morphogenetic proteins and peptides derived from them: biomedical applications and limitations. Cytokine Growth Factor Rev. 2009;20:213–222. doi: 10.1016/j.cytogfr.2009.05.006. [DOI] [PubMed] [Google Scholar]
- 5.Bragdon B, Thinakaran S, Moseychuk O, et al. Casein kinase 2 beta-subunit is a regulator of bone morphogenetic protein 2 signaling. Biophys J. 2010;99:897–904. doi: 10.1016/j.bpj.2010.04.070. [DOI] [PMC free article] [PubMed] [Google Scholar]
- 6.Akkiraju H, Bonor J, Olli K, et al. Systemic injection of CK2.3, a novel peptide acting downstream of bone morphogenetic protein receptor BMPRIa, leads to increased trabecular bone mass. J Orthop Res. 2015;33:208–215. doi: 10.1002/jor.22752. [DOI] [PMC free article] [PubMed] [Google Scholar]
- 7.Bragdon B, Thinakaran S, Moseychuk O, et al. Casein kinase 2 regulates in vivo bone formation through its interaction with bone morphogenetic protein receptor type Ia. Bone. 2011;49:944–954. doi: 10.1016/j.bone.2011.06.037. [DOI] [PubMed] [Google Scholar]
- 8.Moseychuk O, Akkiraju H, Dutta J, et al. Inhibition of CK2 binding to BMPRIa induces C2C12 differentiation into osteoblasts and adipocytes. J Cell Commun Signal. 2013;7:265–278. doi: 10.1007/s12079-013-0199-1. [DOI] [PMC free article] [PubMed] [Google Scholar]
- 9.Turgeman G, Zilberman Y, Zhou S, et al. Systemically administered rhBMP-2 promotes MSC activity and reverses bone and cartilage loss in osteopenic mice. J Cell Biochem. 2002;86:461–474. doi: 10.1002/jcb.10231. [DOI] [PubMed] [Google Scholar]
- 10.Shea CM, Edgar CM, Einhorn TA, et al. BMP treatment of C3H10T1/2 mesenchymal stem cells induces both chondrogenesis and osteogenesis. J Cell Biochem. 2003;90:1112–1127. doi: 10.1002/jcb.10734. [DOI] [PubMed] [Google Scholar]
- 11.Denker AE, Haas AR, Nicoll SB, et al. Chondrogenic differentiation of murine C3H10T1/2 multipotential mesenchymal cells: I. Stimulation by bone morphogenetic protein-2 in high-density micromass cultures. Differentiation. 1999;64:67–76. doi: 10.1046/j.1432-0436.1999.6420067.x. [DOI] [PubMed] [Google Scholar]
- 12.Bruce SJ, Butterfield NC, Metzis V, et al. Inactivation of Patched1 in the mouse limb has novel inhibitory effects on the chondrogenic program. J Biol Chem. 2010;285:27967–27981. doi: 10.1074/jbc.M109.091785. [DOI] [PMC free article] [PubMed] [Google Scholar]
- 13.Nohe A, Hassel S, Ehrlich M, et al. The mode of bone morphogenetic protein (BMP) receptor oligomerization determines different BMP-2 signaling pathways. J Biol Chem. 2002;277:5330–5338. doi: 10.1074/jbc.M102750200. [DOI] [PubMed] [Google Scholar]
- 14.Jonk LJ, Itoh S, Heldin CH, et al. Identification and functional characterization of a Smad binding element (SBE) in the JunB promoter that acts as a transforming growth factor-beta, activin, and bone morphogenetic protein-inducible enhancer. J Biol Chem. 1998;273:21145–21152. doi: 10.1074/jbc.273.33.21145. [DOI] [PubMed] [Google Scholar]
- 15.Bouxsein M, Uchiyama T, Rosen C, et al. Mapping quantitative trait loci for vertebral trabecular bone volume fraction and microarchitecture in mice. J Bone Miner Res. 2004;19:587–599. doi: 10.1359/JBMR.0301255. [DOI] [PubMed] [Google Scholar]
- 16.Beamer WG, Shultz KL, Coombs HF, et al. Multiple quantitative trait loci for cortical and trabecular bone regulation map to mid-distal mouse chromosome 4 that shares linkage homology to human chromosome 1p36. J Bone Miner Res. 2012;27:47–57. doi: 10.1002/jbmr.515. [DOI] [PMC free article] [PubMed] [Google Scholar]
- 17.Srinivasan PP, McCoy SY, Jha AK, et al. Injectable perlecan domain 1-hyaluronan microgels potentiate the cartilage repair effect of BMP2 in a murine model of early osteoarthritis. Biomed Mater. 2012;7:024109. doi: 10.1088/1748-6041/7/2/024109. [DOI] [PMC free article] [PubMed] [Google Scholar]
- 18.Nohe A, Keating E, Underhill TM, et al. Dynamics and interaction of caveolin-1 isoforms with BMP-receptors. J Cell Sci. 2005;118:643–650. doi: 10.1242/jcs.01402. [DOI] [PubMed] [Google Scholar]
- 19.Nohe A, Petersen NO. Image correlation spectroscopy. Sci STKE. 2007;2007:17. doi: 10.1126/stke.4172007pl7. [DOI] [PubMed] [Google Scholar]
- 20.Kwon SH, Lee TJ, Park J, et al. Modulation of BMP-2-induced chondrogenic versus osteogenic differentiation of human mesenchymal stem cells by cell-specific extracellular matrices. Tissue Eng Part A. 2013;19:49–58. doi: 10.1089/ten.tea.2012.0245. [DOI] [PMC free article] [PubMed] [Google Scholar]
- 21.Hanada K, Solchaga LA, Caplan AI, et al. BMP-2 induction and TGF-beta 1 modulation of rat periosteal cell chondrogenesis. J Cell Biochem. 2001;81:284–294. doi: 10.1002/1097-4644(20010501)81:2<284::aid-jcb1043>3.0.co;2-d. [DOI] [PubMed] [Google Scholar]
- 22.Christenson RH. Biochemical markers of bone metabolism: an overview. Clin Biochem. 1997;30:573–593. doi: 10.1016/s0009-9120(97)00113-6. [DOI] [PubMed] [Google Scholar]
- 23.Navarro SJ, Trinh T, Lucas CA, et al. The C57BL/6J mouse strain background modifies the effect of a mutation in bcl2l2. G3 (Bethesda) 2012;2:99–102. doi: 10.1534/g3.111.000778. [DOI] [PMC free article] [PubMed] [Google Scholar]
- 24.Mouse Genome Sequencing Consortium. Waterston RH, Lindblad-Toh K, et al. Initial sequencing and comparative analysis of the mouse genome. Nature. 2002;420:520–562. doi: 10.1038/nature01262. [DOI] [PubMed] [Google Scholar]
- 25.Blagojevic M, Jinks C, Jeffery A, et al. Risk factors for onset of osteoarthritis of the knee in older adults: a systematic review and meta-analysis. Osteoarthritis Cartilage. 2010;18:24–33. doi: 10.1016/j.joca.2009.08.010. [DOI] [PubMed] [Google Scholar]
- 26.Zheng Q, Zhou G, Morello R, et al. Type × collagen gene regulation by Runx2 contributes directly to its hypertrophic chondrocyte-specific expression in vivo. J Cell Biol. 2003;162:833–842. doi: 10.1083/jcb.200211089. [DOI] [PMC free article] [PubMed] [Google Scholar]
- 27.D’Angelo M, Yan Z, Nooreyazdan M, et al. MMP-13 is induced during chondrocyte hypertrophy. J Cell Biochem. 2000;77:678–693. [PubMed] [Google Scholar]
- 28.Schmidt C, Priemel M, Kohler T, et al. Precision and accuracy of peripheral quantitative computed tomography (pQCT) in the mouse skeleton compared with histology and microcomputed tomography (microCT) J Bone Miner Res. 2003;18:1486–1496. doi: 10.1359/jbmr.2003.18.8.1486. [DOI] [PubMed] [Google Scholar]
- 29.Roy R, Kudryashov V, Doty SB, et al. Differentiation and mineralization of murine mesenchymal C3H10T1/2 cells in micromass culture. Differentiation. 2010;79:211–217. doi: 10.1016/j.diff.2010.03.003. [DOI] [PMC free article] [PubMed] [Google Scholar]
- 30.Davies DV, Edwards DA. The blood supply of the synovial membrane and intra-articular structures. Ann R Coll Surg Engl. 1948;2:142–146. [PMC free article] [PubMed] [Google Scholar]


