Minimally invasive trabecular bypass/ablation glaucoma surgeries have shown intraocular pressure (IOP) reduction, but the magnitude is variable and unpredictable. By understanding the physiology of aqueous humor outflow (AHO) pathways of individual patients, it may be possible to enhance the magnitude of IOP lowering and its predictability.
Aqueous angiography is an anterior-segment angiographic method that images AHO1–4 similar to how intravenous angiography for the posterior segment visualizes retinal blood flow. Aqueous angiography has shown segmental (non-360-uniform) AHO in enucleated eyes from multiple species1–3 and in intact eyes from living non-human primates (NHP)4. Pulsatile and dynamic AHO were seen in NHPs where regions with/without angiographic AHO could lose/gain angiographic signal respectively in a real-time fashion4. Here, we demonstrate the first aqueous angiographic images from living human subjects obtained during phacoemulsification. Indocyanine green (ICG) was introduced into the anterior chamber as a capsular stain5 while simultaneously serving as a tracer for aqueous angiographic imaging.
Eight subjects (54–77 years-old; 4 men and 4 women) were recruited with nuclear sclerotic or posterior subcapsular cataracts with no history of shellfish/iodine allergies. Written informed consent was obtained. The study was carried out in accord with the Declaration of Helsinki and approved by the IRB of University of California, San Diego. All subjects were dilated (1% tropicamide and 2.5% phenylephrine), and prepared for standard phacoemulsification. A 1 mm side-port paracentesis was made slightly superior-temporal (right eye) or infero-temporal (left eye) through which a 20g Lewicky AC-maintainer (Katena, NJ, USA) was inserted. Aqueous humor was evacuated with a syringe followed by tracer addition. After imaging, the AC-maintainer was removed, tracer irrigated, and 1% preservative-free lidocaine and viscoelastic added segueing into phacoemulsification (Centurion Vision System; Alcon, Ft. Worth, TX, USA). The method of tracer exchange and the conversion of the AC-maintainer port into the second instrument port avoided the creation of additional wounds compared with usual phacoemulsification. At the end of the case, all wounds were hydrated or a suture was placed.
Aqueous angiography imaging was performed as previously described1–4 utilizing an angiographer on a customized arm (Spectralis HRA+OCT Flex module; Heidelberg Engineering GmbH, Heidelberg, Germany). The camera head of the Spectralis was sterile-draped. Next to the head rest, a sterile-draped IV pole held a syringe reservoir with a three-way stop cock ~10 inches above the eye to be imaged, providing a gravity-delivered constant pressure of ~18.7 mm Hg.
The Spectralis FLEX camera head was placed above the eye, and confocal scanning laser ophthalmoscopic infrared (cSLO-IR) images were acquired to center the eye using a 55-degree (subjects 1-4, and 6; ~25 diopter focus) or anterior segment (subject 5/7/8; ~ 37 diopter focus) lens. Subsequently, fluorescent images were obtained on ICG capture mode (excitation wavelength: 786 nm and transmission filter > 800 nm) to establish a black pre-injection background1–4. Pharmaceutical grade ICG (ICGREEN 25 mg [NDC 17478-701-25], Akorn) was dissolved with 0.7 ml of the manufacturer solvent followed by 5.6 ml of balanced salt solution for a 0.4% concentration2–5. After introduction of ICG, fluorescent, cSLO-IR images, or video were acquired with the subject looking in different directions. Anterior segment OCT was acquired in two eyes (anterior segment lens; single line scan; 15-degree scan angle; 3.9- and 11-micron axial and lateral resolution; automated real-time setting: 3).
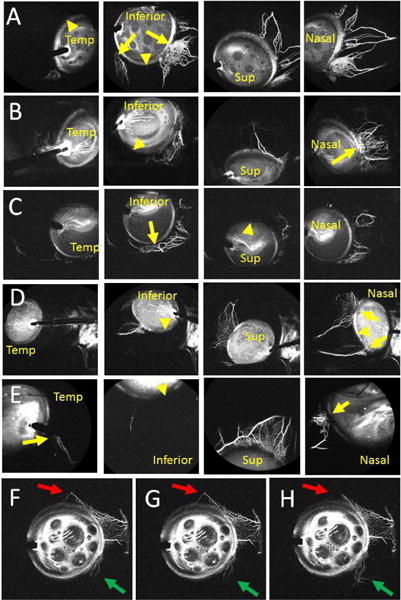
Similar to post-mortem eyes1–3 and living eyes from NHPs4, aqueous angiography in living human subjects undergoing phacoemulsification showed segmental patterns (Fig. 1, Supplemental Fig. 1, and Clip 1). Initial angiographic signal was seen by 40.4 +/− 9.4 seconds (mean +/− standard error) with a range from 18–70 seconds in the 8 subjects. In all cases, nasal signal was strongest. Regions with angiographically positive episcleral veins (Fig. 1 A–E, arrows) were intermixed with regions lacking angiographic episcleral veins (Fig. 1 A–E, arrowheads). In some instances, imaging was performed in one set location, and dynamic changes were observed. Regions without initial angiographic signal sometimes developed angiographic signal (Fig. 1F–H; green arrows) and regions with angiographic signal could lose signal intensity (Fig. 1F–H; red arrows). Dynamic changes in addition to pulsatile flow were appreciated by real-time video (Clip 1).
Figure 1.

Aqueous Angiography Shows Segmental Outflow Patterns in Living Human Subjects Aqueous angiography in different positions for subject 1 (Row A; right eye), subject 2 (Row B; right eye), subject 3 (Row C; right eye), subject 4 (Row D; left eye), and subject 5 (Row E; left eye). Arrows identify areas with segmental angiographic signal and arrowheads point out regions without angiographic signal. F-H, Subject 6 showed a simultaneous dynamic inferonasal increase (green arrows) and superior decrease (red arrows) in angiographic signal. Sup = superior; Temp = temporal.
Clip 1. Aqueous Angiographic Signal Shows Increased Signal Over Time, A Pulsatile Nature, and Dynamic Change.

A clip was taken from subject 4. The left/bottom/top of the image are nasal/inferior/superior quadrants respectively in this left eye. The video starts 50 seconds after introduction of tracer and lasts for ~ 46 seconds. Angiographic signal appeared almost immediately inferonasally (bottom left) with pulsatile flow in this eye within the first 5 seconds. At 10 seconds, the angiographic signal extended more inferior and continued to grow at 16 seconds. At 22 seconds, this inferior extension started to fade. At 26 seconds, superonasal (top left) signal arose with a pulsatile quality. At 35 seconds, the inferior signal that first appeared at 10 seconds and then disappeared at 22 seconds started to re-appear.
To confirm that aqueous angiographic signal represented AHO, cSLO-IR or anterior-segment OCT images were taken concurrently with aqueous angiography. Anterior segment OCT in angiographically positive regions demonstrated strikingly larger intrascleral lumens compatible for AHO compared to angiographically negative regions (Supplemental Fig. 1A–H). Qualitative overlap existed comparing some episcleral veins on cSLO-IR (Supplemental Fig. 1 I–N; black arrows) to angiographic structures (Supplemental Fig. 1 I–N; white arrows).
The purpose of this study was to show that aqueous angiography was possible in eyes of living human subjects and compatible with successful phacoemulsification without surgical complication. The ICG capsular stain5 facilitated the capsulorhexis. Similar to post-mortem1–3 and living NHP eyes4, segmental AHO was observed. Additionally, pulsatile and dynamic AHO mimicking living NHP results4 were seen.
Several limitations should be noted. First, anesthesia could have affected AHO. Second, pupil dilation meant parasympathetic blockade and changes to the trabecular meshwork. Third, a lid speculum was required which could have changed ocular surface pressure. Lastly, an AC maintainer was used because the grooved ridges allowed the insertion to be stable during globe rotation. A needle is not reliably stable and can slide. Future alterations of the method will likely need to take place to better model physiologic conditions, become quantitative, and increase safety and practicality similar to past evolution of posterior segment angiography.
In the future, we plan to test fluorescein as a tracer in addition to ICG and compare glaucomatous to non-glaucomatous eyes. Additional studies will investigate the cause of pulsatile flow, such as the cardiac cycle, and how to better quantify dynamic changes. This will require dedicated imaging in one location over time which was not done here because subjects were instructed to move their eye over several positions to better document segmental patterns.
In conclusion, this report is the first to show aqueous angiographic images from eyes of living human subjects. Real-time AHO imaging may improve basic knowledge of outflow biology as well as potentially guide glaucoma therapeutics.
Supplementary Material
Supplemental Figure 1. Aqueous Angiographic Signal Overlaps Episcleral Veins and Intrascleral Lumens on Anterior Segment OCT.
Anterior segment OCT was performed on subject 5 (A-D) and subject 7 (E-H). C/G) OCT performed on angiographic structures showed larger intrascleral lumens consistent with episcleral veins (D/H; yellow arrows). A/E) OCT performed on regions without angiographic signal showed smaller and fewer intrascleral lumens (B/F). Subject 2 (I and J), subject 3 (K and L), and subject 5 (M and N) had cSLO-IR images (IR; I/K/M) taken near-simultaneous to aqueous angiographic imaging (J/L/N). Some episcleral veins (I/K/M; black arrows) matched that of angiographic structures (J/L/N; white arrows).
Acknowledgments
Funding for this work came from National Institutes of Health, Bethesda, MD (Grant Numbers K08EY024674 [ASH]; American Glaucoma Society (AGS) Young Clinician Scientist Award 2015 [ASH]; Research to Prevent Blindness Career Development Award 2016 [ASH]; and an unrestricted grant from Research to Prevent Blindness (New York, NY).
Footnotes
Publisher's Disclaimer: This is a PDF file of an unedited manuscript that has been accepted for publication. As a service to our customers we are providing this early version of the manuscript. The manuscript will undergo copyediting, typesetting, and review of the resulting proof before it is published in its final citable form. Please note that during the production process errors may be discovered which could affect the content, and all legal disclaimers that apply to the journal pertain.
References
- 1.Saraswathy S, Tan JC, Yu F, et al. Aqueous Angiography: Real-Time and Physiologic Aqueous Humor Outflow Imaging. PLoS One. 2016;11(1):e0147176. doi: 10.1371/journal.pone.0147176. [DOI] [PMC free article] [PubMed] [Google Scholar]
- 2.Huang AS, Saraswathy S, Dastiridou A, et al. Aqueous Angiography with Fluorescein and Indocyanine Green in Bovine Eyes. Transl Vis Sci Technol. 2016;5(6):5. doi: 10.1167/tvst.5.6.5. [DOI] [PMC free article] [PubMed] [Google Scholar]
- 3.Huang AS, Saraswathy S, Dastiridou A, et al. Aqueous Angiography-Mediated Guidance of Trabecular Bypass Improves Angiographic Outflow in Human Enucleated Eyes. Invest Ophthalmol Vis Sci. 2016;57(11):4558–65. doi: 10.1167/iovs.16-19644. [DOI] [PMC free article] [PubMed] [Google Scholar]
- 4.Huang AS, Li M, Yang D, et al. Aqueous Angiography in Living Nonhuman Primates Shows Segmental, Pulsatile, and Dynamic Angiographic Aqueous Humor Outflow. Ophthalmology. 2017 doi: 10.1016/j.ophtha.2017.01.030. [DOI] [PMC free article] [PubMed] [Google Scholar]
- 5.Jacobs DS, Cox TA, Wagoner MD, et al. Capsule staining as an adjunct to cataract surgery: a report from the American Academy of Ophthalmology. Ophthalmology. 2006;113(4):707–13. doi: 10.1016/j.ophtha.2006.01.024. [DOI] [PubMed] [Google Scholar]
Associated Data
This section collects any data citations, data availability statements, or supplementary materials included in this article.
Supplementary Materials
Supplemental Figure 1. Aqueous Angiographic Signal Overlaps Episcleral Veins and Intrascleral Lumens on Anterior Segment OCT.
Anterior segment OCT was performed on subject 5 (A-D) and subject 7 (E-H). C/G) OCT performed on angiographic structures showed larger intrascleral lumens consistent with episcleral veins (D/H; yellow arrows). A/E) OCT performed on regions without angiographic signal showed smaller and fewer intrascleral lumens (B/F). Subject 2 (I and J), subject 3 (K and L), and subject 5 (M and N) had cSLO-IR images (IR; I/K/M) taken near-simultaneous to aqueous angiographic imaging (J/L/N). Some episcleral veins (I/K/M; black arrows) matched that of angiographic structures (J/L/N; white arrows).


