

Abstract
Purpose
To assess the spatial correlation between MRI and FDG-PET maps of human BAT and measure differences in fat fraction between glucose avid and non-avid regions of the supraclavicular fat depot using a hybrid FDG-PET/MR scanner.
Methods
In sixteen healthy volunteers, mean age of 30 and BMI of 26, fat fraction, R2*, and FDG uptake maps were acquired simultaneously using a hybrid PET/MR system while employing an individualized cooling protocol to maximally stimulate BAT.
Results
Fourteen of the sixteen volunteers reported BAT-positive FDG-PET scans. MR FF maps of BAT correlate well with combined FDG-PET/MR maps of BAT only in subjects with intense glucose uptake. The results indicate that the extent of the spatial correlation positively correlates with maximum FDG uptake in the supraclavicular fat depot. No consistent, significant differences were found in fat fraction or R2* between FDG avid and non-avid supraclavicular fat regions. In a few FDG-positive subjects, a small but significant linear decrease in BAT fat fraction was observed during BAT stimulation.
Conclusions
MR fat fraction, when used in conjunction with FDG uptake maps, can be seen as a valuable, radiation-free alternative to CT and can be used to measure tissue hydration and lipid consumption in some subjects.
Keywords: Brown Adipose Tissue, Thermogenesis, Imaging, Fat Fraction, FDG-PET
Introduction
In mammals, adipose tissue can be categorized into two main types: white adipose tissue (WAT) and brown adipose tissue (BAT).(1)1 These tissues are structurally different and seem to have very different functions. While WAT’s main function is to store energy as fat, BAT’s main function is to help maintain core body temperature through a process called “non-shivering thermogenesis”.(2) During non-shivering thermogenesis, this tissue can generate heat at a rate of more than 0.7 watts/g.(3) This means that 50 g of this tissue can dissipate, when fully stimulated, 700 kCal/day. As a result, this tissue is strongly innervated, highly vascularized, and equipped with a large number of mitochondria where fatty acids, the main substrate for heat production, are oxidized to produce heat.(4)
In rodents, BAT thermogenesis can be stimulated by both cold (cold-induced, non-shivering thermogenesis) and high fat diet (diet-induced non-shivering thermogenesis).(5,6) As such, the activity of this tissue is known to strongly impact energy metabolism and insulin sensitivity.(7–10) For example, healthy mice are known to develop obesity after BAT ablation(11), while transplantation and activation of BAT enables blood glucose regulation without insulin in animal models of type 1 diabetes.(12) Whether this is the case in humans is still an open question.(12,13) Undoubtedly, one of the largest barriers to our understanding of human BAT’s physiology and significance is the detection of this tissue.(12) The technique most commonly used to detect BAT in humans is 18F-fludeoxyglucose positron emission tomography (FDG-PET) combined with computed tomography (CT). When active, due to its relatively high metabolic rate, BAT can be distinguished from surrounding tissues by an increased FDG uptake, while CT offers corresponding anatomical information.(14,15) However, while the general consensus is that an increase in FDG uptake can mark metabolically active BAT in the supraclavicular depot, it is not necessarily a biomarker for BAT thermogenesis.(12) Indeed, glucose uptake can vary greatly among individuals since endogenous glucose may compete with the injected FDG tracer.(16) Also, FDG uptake can be increased in BAT by insulin, without a corresponding increase in thermogenic activity.(17) Finally, since FDG-PET and CT both expose the subject to ionizing radiation, longitudinal studies of BAT by FDG-PET/CT are hard to justify in infants, children, and healthy adults.
MR measurements of BAT lipid content and lipid consumption during stimulation of thermogenic activity are an appealing alternative to FDG-PET/CT due to the non-invasive nature of MR.(18) MR fat fraction measurements, for example, have shown to reliably detect BAT not only in rodents but also in infants and young children.(19,20) This is not surprising as infants and young children are incapable of shivering and, similar to mice that are constantly under thermal stress, need to rely on BAT thermogenesis to maintain core body temperature. Owing to chronic activity, BAT fat fraction is considerably lower than WAT fat fraction and, more importantly, BAT is not yet sparse and heterogeneous like in adults.(21) In adult humans, histology shows that BAT is sparse and highly heterogeneous at the microscopic scale(22,23), therefore it is questionable whether histological validation of fat fraction methods can be done via sparse sampling of the tissue.(24) Differences in R2* between BAT and WAT have also been reported and proposed to increase the specificity of fat fraction measurements to BAT.(25) However, given the heterogeneity and scattered nature of human BAT, differences between BAT positive regions and BAT negative regions that are easy to see in rodents may not be observed in humans. To this end, the scope of this work was 1) to assess the spatial correlation, within the supraclavicular fat depot, between BAT maps, as obtained by MR fat fraction measurements alone (BATMRI) and those obtained by combined fat fraction measurements and FDG uptake measurements (BATPET/MRI); 2) to assess whether differences exist in tissue fat fraction and R2* values between BATMRI areas that are glucose avid and those that are not glucose avid; and 3) to assess the feasibility of monitoring changes in human BAT fat fraction by MRI during stimulation of thermogenesis.
Methods
Study Protocol
This study was approved by the Institutional Review Board of the University of North Carolina at Chapel Hill and was conducted in compliance with the Helsinki Declaration. Sixteen healthy human subjects, whose characteristics are described in Table 1, participated in this study. All subjects were instructed to refrain from strenuous activity and exercise for 24 hours before the imaging session and to fast for a period of at least six hours prior to arriving to the imaging center. Upon arrival, each subject underwent one of the following protocols:
Table 1.
Participants’ demographics displaying sex, age, and BMI.
| Participant | A | B | C | D | E | F | G | H | I | J | K | L | M | N | O | P |
|---|---|---|---|---|---|---|---|---|---|---|---|---|---|---|---|---|
| Sex | M | M | F | M | M | M | F | F | M | M | F | F | M | F | M | F |
| Age | 24 | 30 | 30 | 53 | 25 | 20 | 25 | 27 | 23 | 22 | 24 | 23 | 21 | 38 | 43 | 49 |
| BMI | 25.9 | 27.1 | 19.3 | 27.8 | 24.0 | 24.5 | 20.6 | 23.8 | 24.5 | 22.1 | 24.2 | 21.0 | 23.3 | 29.6 | 36.6 | 34.4 |
Protocol 1 (7 Subjects)
After screening and consenting the subject, the subject changed into scrub clothes and was brought inside the PET/MRI scanner room.
Water-perfused cooling pads (ArcticSun 2000 temperature management system, Medivance, Louisville, CO) were wrapped around the subject’s thighs and torso. The subject was then asked to minimize any motion for the entire duration of the cooling procedure, while lying down on the scanning table.
Water temperature was initially set at 30 °C for 40–45 minutes, during which MR FF maps were acquired using a dual-echo Dixon protocol.
Within 5 minutes, the water temperature was lowered from 30°C to 15 °C, until the subject began to shiver.
When the shivering threshold was reached, water temperature was raised by 1°C until shivering subsided, as self-reported by the subject. This threshold was used to make sure BAT was maximally stimulated without muscle shivering and to achieve the highest BAT prevalence in FDG-PET scans.(8)
MR FF maps were acquired every 30–40 minutes during cooling, performed for a total of 1 hour before and 1.5 hours after the intravenous injection of 5 mCi of FDG.
One hour after the injection of the radiotracer, a static PET scan was run simultaneously with the MR FF protocol.
Additional MR fat fraction measurements were performed after PET image acquisition, when the subject was brought back to thermoneutrality.
At the end of the imaging session, water pads were removed and the subject was released.
Protocol 2 (9 subjects)
After screening and consenting the subject, the subject was brought into one of the patient rooms located within the imaging suite.
Water-perfused cooling pads were wrapped around the subject’s thighs and the subject’s torso. The subject was then asked to minimize any motion for the entire duration of the cooling procedure, while lying down on a reclined chair.
Water temperature was initially set at 30 °C for 30 minutes.
After this time, in less than 5 minutes, water temperature was lowered to approximately 15 °C, until the subject began to shiver.
When the shivering threshold was reached, water temperature was raised by 1°C until shivering subsided, as self-reported by the subject.
After 1 hour of cooling, 5 mCi of FDG were injected intravenously.
The subject was cooled for an additional hour and then transferred to the PET/MR scanner using a wheelchair to reduce skeletal muscle PET uptake.
A static PET scan was run simultaneously with two MR fat fraction protocols, a 2-echo and a 6-echo Dixon protocol.
The subject was then removed from the scanner and released.
Imaging Protocol
All MRI and PET images were acquired using a hybrid PET/MR scanner (Biograph mMR, Siemens Healthcare, Germany), which operates at a magnetic field strength of 3 T. MR images were acquired to cover the entire region from the neck to the apex of the lungs. Two FF MR protocols were used in this study: a 3D dual-echo Dixon sequence and a T2*-corrected six-echo Dixon sequence, with single and multi-frequency fat signal modeling, respectively. The former was the only protocol used in the 7 subjects that underwent cooling inside the magnet (protocol 1). Because of the reduced accuracy of the 2-echo Dixon protocol, fat fraction maps using both protocols were also acquired on samples of varying fat content to assess both the accuracy and the difference in FF values between the two protocols.
For both human and phantom studies, the two-echo fat fraction maps were acquired using the following parameters: repetition time (TR), 10 ms; echo times (TE1, TE2), 2.46 ms, 3.69 ms; flip angle (FA), 13 degrees; field of view (FOV), 500 mm × 370 mm × 120 mm; matrix, 512 × 384; slices, 96; slice thickness, 1 mm; resolution, 0.98 mm × .96 mm × 1mm. The six-echo Dixon 3D fat fraction maps were acquired with the following parameters: repetition time (TR), 15 ms; first echo time (TE), 1.10 ms; subsequent echo times (ΔTE), 1.22 ms; flip angle (FA), 3 degrees; field of view (FOV), 440 mm × 225 mm × 83 mm; base resolution, 352; slices, 64; slice thickness, 1.3 mm; resolution, 1.3 mm × 1.3 mm × 1.3 mm; readout mode, unipolar.
A magnitude-based fitting protocol employing a Levenberg-Marquardt, non-linear fitting algorithm was then used within the Siemens’ Image Calculation Environment (ICE) program to fit the magnitude of the complex signal of the multi-echo data to the signal model:(26)
Where R2*eff is an effective R2* for both water and fat spins and cn is a complex fat dephasing function based on a six peak human fat spectral model. The spectral model is the same used previously in human BAT differentiation by Hu, et al. (27) with the following chemical shifts and relative resonance areas: 0.90 ppm, 125.8; 1.30 ppm, 956.4; 1.59 ppm, 109.1; 2.03 ppm, 146.0; 2.25 ppm, 100; 2.77 ppm, 23.4; 5.31 ppm, 63.9.(28) In five of the nine subjects, this fitting scheme was also compared to the combined magnitude and complex fitting scheme described in Yu, et al.(29) A discussion of the results can be found in the supplemental information (Supporting Figure S1, Supporting Figure S2).
Positron emission tomography scanning was performed in the 3-dimensional mode with 6 minutes per bed position and a total of 3–4 bed positions to cover an area from the skull to the kidney. Resolution was 4.1 mm × 2.6 mm × 3.1 mm. Standard uptake values (SUVs) were calculated from the measured radio activity r, decay corrected injected dose a′, and subject’s body weight w (30):
Phantom Preparation
A phantom study was preformed to compare the accuracy and the difference in calculated FF values obtained with two-echo and six-echo protocols. Stable homogenous emulsions of corn oil and distilled water were first prepared following the same procedure described in Bernard, et al.(31) Specifically, 15 mmol of sodium dodecyl sulfate (Sigma-Aldrich, St. Louis, MO) and 5 g of carrageenan were added to a liter of deionized and demineralized water, which was then stirred by using a magnetic hotplate and heated to 50°C. Six different emulsions, with a targeted FF of 0%, 20%, 40%, 60%, 80%, and 100% oil, were created using different concentrations of corn oil. The emulsions were homogenized, checked for absence of microbubbles and creaming, and imaged using the same fat fraction MR protocols used for human imaging. To minimize temperature based FF biases, phantoms were equilibrated at a temperature of 37°C using a water bath before imaging.(32) During imaging, samples were placed in insulating Styrofoam containers, while temperature measurements performed right before and right after imaging confirmed a temperature variation during scanning of less than 1°C.
Image Analysis
MRI and PET images were analyzed, after reconstruction by the ICE program, using MIM software (MIM Software Inc. Cleveland, OH). In the 7 subjects cooled inside the scanner, intensity-based deformation algorithm was applied to all water components of the two-echo Dixon images acquired not simultaneously with the PET image, to correct for unavoidable subject motion during the extended imaging time (~3 hours). Their corresponding fat component images were then transformed using the same transformation matrices. From the deformed water component images (W) and co-deformed fat component images (F), fat fraction (FF) values were calculated for each pixel using FF=F/(F+W) for pixels with a FF≥50% and FF=1-W/(F+W) for pixels with a FF<50%.
In the 9 subjects in which single two-echo and six-echo Dixon fat fraction maps were acquired simultaneously with PET images, the deformation algorithm was not needed and was not applied. The two-echo FF images were again created from the fat and water component images while the reconstruction of the six-echo Dixon automatically provided FF, water-fraction, and R2* maps.
In all MRI imaging data sets, regions of interest (ROIs) were defined using the following steps: 1) An ROI was first drawn around the supraclavicular region excluding background, bone, muscle, major blood vessels and skin. 2) A FF range between 40% and 100% was used to define, within this region, regions containing BAT (BATMRI). (Figure 1). 3) An additional constraint of SUV > 1.5 was applied to define regions of BAT constrained by both FF values and SUV values (BATPET/MRI). 4) The ratio (BATMRI -BATPET/MRI)/BATMRI was then used to calculate the percent disagreement of BAT volume constrained by FF values alone (BATMRI), versus BAT volume constrained by both FF and SUV values (BATPET/MRI). Finally, FF values and R2* values in BATPET/MRI regions were compared to those in BATMRI excluded from BATPET/MRI.
Figure 1.

Identification of supraclavicular BAT depot using FF values and FDG uptake values in subject I. a. Coronal FDG-PET image showing intense glucose uptake in supraclavicular region. b. Axial view of the FDG-PET image across the plane defined by the yellow dotted line. c. Corresponding axial FF image. d. FDG-PET image fused with the corresponding MR fat component image, illustrating FDG-PET uptake in the supraclavicular fat depot. e. Contour of tissue with a SUV > 1.5 (red) over a FF image. f. FF map and a contour identifying supraclavicular fat depots with a FF greater than 40% (blue) g. BAT volume identified by using a FF > 40% and an SUV value > 1.5 (green).
In order to further examine, pixel by pixel, any possible correlation between SUV values, FF values, and R2* values within BATMRI regions, PET and MR images were also exported to MATLAB (Mathworks, Natick, MA), where PET images were resampled to the MR resolution using linear interpolation. Linear regression analysis was then performed on the resultant data set.
A comparison of the two-echo and six-echo protocol was also performed in the nine subjects in whom fat fraction maps were acquired using both protocols as well as for the phantom studies. For this comparison, an ROI was drawn around the supraclavicular region excluding background, bone and skin. Mean FF values were then calculated for the BATMRI as obtained by the two protocols. Since the disagreement in FF values between the two protocols is expected to be FF dependent, FF values were also calculated for regions with a FF ranging between 0%–10%, 10%–20%, 20%–30% and so on, up to 100%. These contours were applied directly to the corresponding two-echo Dixon FF maps. For each region and for each subject, mean FF value obtained with the six–echo Dixon protocol was compared to the mean FF value obtained with the two–echo Dixon protocol. A second order binomial function was used to model the relation between FF values obtained from the two protocols for each region and from each subject. The resultant expression was then used to correct FF values obtained with the two-echo Dixon protocol in the 7 subjects that underwent cooling inside the magnet and in which BAT fat fraction changes were assessed during stimulation of thermogenic activity using the two-echo Dixon protocol alone. However, because the correction factor between the two protocols is not just a function of FF but is also a function of R2*, a full correction of the FF maps obtained with the two-echo Dixon protocol could not be made.
For the phantom images, the same ROI was drawn on the two FF maps acquired with the two fat fraction protocols. Bland–Altman plots were then constructed by plotting the difference in FF values obtained with the two methods against the true FF value and against the six-echo FF value, which, in this case, was considered to be a reasonable gold standard.
Results
Table 1 shows the BMI and age of all subjects. Of these, only subjects D and O, a 53 y.o. male with a BMI of 27.8, and a 36 y.o. male with a BMI of 36.6, produced BAT-negative results according to FDG-PET scans. Figure 2 shows representative PET-MRI fusion images and fat fraction maps of a BAT-negative (subject D) and a BAT-positive (subject C) subject. Despite presenting similar FF values in their supraclavicular fat depots, PET results classified one (subject D) BAT negative and the other (subject C) as BAT positive. Moreover, in the BAT positive subject, despite the entire supraclavicular fat depot displaying a FF above 40%, only about 50% of the region has an SUV of greater than 1.5.
Figure 2.

a. Axial FDG-PET image overlaid on a fat component Dixon image of subject D, which resulted BAT-negative in the FDG-PET scan. Very little FDG uptake is seen in the supraclavicular fat depot. b. Axial FDG-PET image of subject C, which resulted BAT-positive in FDG-PET scan, overlaid onto the corresponding fat component image. c. Corresponding MR FF map of the same region of subject D. d. Corresponding MR FF map of the same region of subject C.
Figure 3 plots the percent disagreement in BATMRI volume compared to BATPET/MRI volume as a function of the Maximum Standardized Uptake Value (SUVmax) found in the supraclavicular fat pad for all FDG positive subjects. In all subjects the results showed BATMRI volume to be larger than BATPET/MRI volume. However, a strong inverse correlation (R2= 0.94 and P<0.00001) was found between the degree of disagreement and SUVmax, meaning that disagreement was much smaller (~2%) in subjects in which BAT activity was particularly strong.
Figure 3.
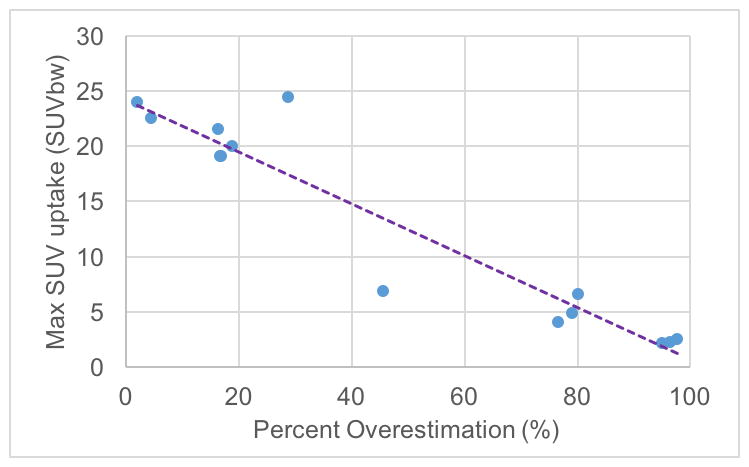
Scatter plot of max SUV versus BATMRI percent difference with respect to BATPET/MRI for all BAT-positive subjects showing a negative correlation between max SUV and BATMRI / BATPET/MRI spatial correlation (R = −0.951 and P < 0.0001).
Figure 4 shows box plots of the mean FF of FDG(+) and FDG(−) BATMRI regions in all FDG positive subjects as well as in lean (BMI<26) subjects as measured by the two-echo and six-echo Dixon protocol. No significant difference in FF was found between FDG(+) and FDG(−) BATMRI regions, independent of the FF protocol used. (P=0.7873, P=0.6557) In subjects with low BMI, the median FF was slightly lower in FDG+ regions than in FDG-regions. Differences, on the other hand, were seen only within subjects, but opposite trends were observed. For example, mean FFs as measured by the six-echo Dixon protocol in Subject H were: FDG(+): 65%, FDG(−): 70%; while in Subject L were: FDG(+): 66%, FDG(−): 61%.
Figure 4.

Box plot of the mean FF in FDG(+) and FDG(−) regions a. Mean FF values in BATMRI, as measured by the six-echo Dixon protocol, in all BAT+ subjects: FDG(+) 70±9%, FDG(−) 69±11%, P=0.7873 b. Mean FF values in BATMRI, as measured by the six-echo Dixon protocol, in all lean (BMI<26), BAT+ subjects: Mean FF: FDG(+) 66±6%, FDG(−) 64±7%, P=0.6557.
Figure 5 displays scatter plots of the FDG uptake in each voxel of the BATMRI region as a function of FF and as a function of R2* values for these two subjects. Surprisingly, no clear, general trend was observed between FF and glucose uptake in the subjects analyzed, despite some areas of very high uptake appearing to display lower fat fractions in a couple of subjects (Figure 6). Plots for all the subjects can be found in Supporting Figure S3.
Figure 5.

Scatter plots of the SUV vs. the FF values in each BATMRI voxel for a. Subject H and b. Subject L. When a linear regression was run, R2 was 0.0008 and 0.13 respectively. Scatter plots of the SUV vs. R2* values in each BATMRI voxel for c. Subject H and d. Subject L. When a linear regression was run, R2 values were 0.053 and 0.014 respectively. A linear regression run on both FF and R2* together, allowing for interaction and quadratic terms, gave an R2 of 0.03 and 0.06 respectively.
Figure 6.

A comparison of FDG-uptake and FF in subject K. a. Axial image showing SUV in supraclavicular area b. Axial image showing FF values obtained with the six-echo Dixon protocol. Marked ROI contours regions with SUV greater than 5.
Figure 7 shows box plots of the mean R2* in FDG(+) and FDG(−) BATMRI regions of all FDG positive subjects as well as in lean subjects. Again, a difference in R2* was seen only in lean subjects but not in all subjects. Differences in R2* were observed within subjects, but again, opposite trends were observed across subjects (Figure 6c–d). For example, mean R2* in Subject H was: FDG(+): 87 s−1, FDG(−): 78 s−1; while in Subject L was: FDG(+): 104 s−1, FDG(−): 117 s−1.
Figure 7.

Box plot of the mean R2* as measured by the six-echo Dixon in FDG(+) and FDG(−) regions a. In all FDG positive subjects mean R2* was: FDG(+) 81±60 s−1, FDG(−) 83±63 s−1, P=0.9297. b. In all lean subjects mean R2* was: FDG(+) 86±56 s−1, FDG(−) 95±65 s−1, P=0.7315.
Figure 8 shows the average BATMRI fat fraction value as measured by the two-echo and by the six-echo Dixon protocol. Compared to the six-echo Dixon protocol, the two-echo Dixon protocol, in some of the subjects, produces the same result as the six-echo Dixon protocol, while in other subjects it underestimates average BATMRI FF value. Figure 8 also illustrates the relationship between fat-fraction values obtained with the two-echo and the six-echo Dixon protocol in supraclavicular regions and in phantoms with different FF values. As shown in Figure 8b, with respect to the six-echo Dixon protocol, the two-echo Dixon protocol overestimates FF at low FF values (<60%) and underestimates FF at high FF values (>60%) in the supraclavicular region. Also, the relation between FF values as estimated by the two-echo Dixon protocol and FF values estimated by the six-echo Dixon protocol is consistent across all subjects and, while non-linear, can be well-approximated by a second order polynomial function (linear regression analysis with R2=0.96). Interestingly, in Figure 8c, the phantom results display the same trend between the two protocols and shows, as expected, that the six-echo Dixon protocol more accurately measures fat fraction values than the two-echo Dixon protocol. Figure 8d shows the Bland–Altman plots for the in vivo and in vitro data relative to the six-echo Dixon. A large over-estimation of FF values by the two-echo Dixon protocol relative to the six-echo Dixon protocol is seen for fat fractions less than 60%. Between 60% and 80%, as measured by the six-echo Dixon, the difference in FF values between the two protocols decreases to zero. For FF values greater than 80%, the two-echo Dixon protocol underestimates FF value when compared to the six-echo Dixon protocol. When looking at the magnitude of the change in FF, for FF values less than 40%, the two-echo Dixon protocol underestimates the change in FF with respect to the six-echo Dixon protocol by only 4%. However, for fat fraction values between 50% and 85%, changes in FF values are underestimated by as much as 66%. Figure 8e shows the Bland–Altman plots for the in vitro data relative to the true FF, which reveals a mean difference from the true fat fraction equal to 0.2% for the six-echo, and equal to 6.6% for the two-echo protocol. Maximum differences were 2.6% (six-echo) and 22.2% (two-echo). Of note, there was a general underestimation for both protocols at high fat fraction values (> 80%). Excluding the values from fat phantoms greater than 80% FF, the mean differences were equal to 0.9% (six-echo), 14.5% (two-echo) and 13.6% (between the six-echo and two-echo).
Figure 8.

a. Plot of average BATMRI fat fraction for all nine subjects analyzed with the two protocols, as measured by two-echo and six-echo Dixon protocol. b. Comparison of FF values obtained from phantoms and from the supraclavicular region of 9 subjects by using the two-echo and the six-echo Dixon protocol. The fit of the in vivo data is a second order polynomial y = −0.0054x2+1.1248x+15.436 with R2=0.96 c. Plot of percentage fat fraction (by volume) for each of the 6 water-fat phantoms against FF value as measured by two-echo and six-echo Dixon protocol. d. Bland–Altman plot of the FF difference between the two-echo and six-echo Dixon protocol relative to the FF measured by the six-echo Dixon protocol for both the 9 subjects and the in vitro phantom study. e. Bland–Altman plot of the in vitro phantom study showing the FF difference between the measured FF maps for both the two-echo and six-echo Dixon protocols and the FF as measured by volume.
Of the seven subjects cooled inside the magnet, six of them resulted BAT-positive according to FDG-PET scans. Of these, half of them (subjects A, E, and F) showed a decrease in BAT fat fraction during the individualized cooling protocol. Figure 9a shows this decrease in subject A with a drop of ~2% as measured by the two-echo Dixon protocol. Considering the underestimation produced by the two-echo Dixon protocol in this range, this change could correspond to a change of ~4%. Figure 9c shows the change in fat fraction in muscular tissue in the same subject, which, as expected, does not show a linear decrease and varies only slightly (0.5% as measured by the two-echo Dixon or ~0.1% when normalized to the six-echo Dixon protocol). Figure 9b shows the fat fractional changes of BAT in subject B, who did not show a decrease in FF. In this subject, a fluctuation in tissue fat fraction as large as 2% was measured during cooling by the two-echo Dixon protocol. Figure 9d shows the fat fraction in muscular tissue of the same subject (subject B). With respect to subject A, muscle FF in this subject clearly shows a considerably larger fluctuation, ~3%. Plots of FF decrease within BAT in all subjects cooled inside the magnet are displayed in Supporting Figure S4.
Figure 9.

Fat fraction values during the individualized cooling protocol. a. Fat fraction values in BATPET/MRI of Subject A. BATPET/MRI were defined as regions with FF >40% and SUV>1.5. The data was well fit (R2=.96) with a significant linear decrease (P<0.0001). b. Fat fraction values in BATPET/MRI of Subject B. The data did not show a linear trend (R2=.61). c. Fat fraction values in muscle of Subject A. d. Fat fraction values in muscle of Subject B.
Discussion
The goal of this study was to analyze the spatial correlation between BAT maps, as obtained by combined PET/MRI measurements, and BAT maps as obtained by MRI alone. BAT segmentation on FDG-PET images is often performed using SUV threshold techniques, with threshold values of 1.5 or 2. (8,33,34) In our study we used an SUV threshold of 1.5. This threshold is significantly higher (3 times higher) than the typical SUV value found in white adipose tissue. Moreover, with this threshold more activity and volume is assigned to BAT. A FF threshold of greater than 40% was used to further constrain regions with SUV>1.5 as, given the intrinsically low resolution of FDG-PET and when looking at small areas of uptake, large biases can be introduced by partial volume effects and spillover artifacts.(8,35) This FF value, which has been previously used by Lundström, et al.,(36) was chosen to remove areas of muscle and partial volume effects without removing areas of potentially FDG-avid fatty tissue.
For the acquisition of FF maps, we used a six-echo and a two-echo Dixon protocol. The latter was the only one used to determine changes in BAT FF during cold exposure as it was the only one available on the scanner at the time of the experiments. This method, despite having well documented issues with quantitative FF measurements due to Bo field inhomogeneity as well as T1 bias,(31,37) was previously used for similar studies on human BAT by PET/MRI as it is the only fat fraction method available on a PET/MRI scanner without a master research agreement.(38,39) As we show here, this method can produce very different FF values with respect to the six-echo Dixon protocol, especially in tissues with a FF lower than 40%. Smaller errors are made in tissues with a fat fraction higher than 40%, such as the supraclavicular fat depot analyzed here. However, when looking at the magnitude of change in tissue fat fraction, for tissues with fat fraction lower than 40% the value is quite accurate, while in tissues with a fat fraction higher than 40%, the magnitude can be underestimated by as much as 66%. This could produce misleading results as the change in fat fraction during stimulation of thermogenic activity observed here and by other authors is only 2–4%.(25,36)
Despite the higher accuracy of the six-echo protocol, similar to other reports in adult humans(40,41), this study shows that there is not a perfect correlation between BATMRI and BATPET/MRI maps. However, a strong and significant negative correlation seems to exist between percent disagreement in BAT maps and maximum standardized uptake values (R=−0.951 and P<0.0001). This means that the disagreement between BATMRI and BATPET/MRI maps is smaller in subjects that display highly active BAT. This is not surprising considering that young, lean subjects that present high glucose uptake in their supraclavicular fat are expected to have a higher percentage of BAT in their supraclavicular region. The general consensus is that this tissue, if not used, becomes infiltrated and ultimately replaced by white adipocytes.(42,43) When this happens, the concentration of BAT cells in major BAT locations can drop dramatically.(22,23,42,43) A similar effect is known to occur in rodents in which the periphery of the interscapular BAT is often made by a mixture of brown fat cells with reduced thermogenic capacity and white adipocytes, leading to a substantial reduction in FDG uptake.(44) However, though the periphery of this mixed characteristic tissue can be easily spotted in MR FF images in rodents, in adult humans this does not seem to be the case. Areas with intense glucose uptake do not have a consistently lower fat fraction value than areas of low glucose uptake across all subjects.
R2* values have been used to improve detection specificity or to directly detect BAT activation.(25,27,45) A lack of significant difference in R2* values was found in this study between FDG(+) and FDG(−) BATMRI areas.(P=0.9297) Only in lean subjects was a small difference between FDG+ and FDG− regions detected. In view of the heterogeneity of the supraclavicular depot, the inconsistency of the results of this study with previous rodent studies is not surprising.
The absence of a strong correlation between BATMRI and BATPET/MRI in subjects with low glucose uptake could be due either to the lack of specificity of MRI FF maps alone, or to the presence in the same supraclavicular fat depot of active BAT that takes up glucose and inactive BAT that does not take up glucose. Although in our opinion the latter scenario is highly unlikely, since a personalized cooling protocol was used to achieve maximal stimulation of BAT thermogenic activity, histological analysis of the entire tissue would be needed to establish the truth.
When looking for BAT with MR techniques in humans, most studies have examined differences in FF and R2* between the supraclavicular region and abdominal or subcutaneous WAT.(25,27,36,38) While there is no doubt that there exist measurable differences in FF and R2* between WAT in the abdominal region and supraclavicular fat, this does not necessarily imply that there exist differences between WAT and BAT within the supraclavicular area. This could be the case if BAT were present in sufficient amounts and had a particularly low fat content, but this is known not to be the case in humans.(42,46)
Although fat fraction and R2* measurements appears to be not specific to BAT in all subjects, they are certainly a better alternative to CT. They are radiation-free and they can be used to provide anatomical reference for PET images, as well as to monitor tissue hydration and lipid consumption during stimulation of thermogenic activity. The measurement of lipid consumption does present some challenges, though. First, a quantitative fat fraction protocol should be used when looking at changes in fat fraction in the supraclavicular region. The decrease in tissue fat fraction seen in human BAT is indeed much smaller than what is typically observed in rodents (~30%).(25,36,47) This means that an underestimation of fat fraction of a couple of percent can make a significant difference in the detection. When sensitive to such small differences, even temperature changes could be a confounding factor.(32) Second, a subject’s motion or repositioning can mask changes in fat fraction, especially in those subjects with low BAT activity. To this end, a quantitative fat fraction protocol, coupled with a personalized cooling procedure that maximizes BAT activity and which is performed inside the scanner (to minimize co-registration errors), should be used; however, this considerably increases imaging cost and may be prohibitive for larger studies.
Conclusion
MR fat fraction maps, when used in conjunction with FDG uptake maps, can serve as a valuable, radiation-free alternative to CT that provides not only anatomical information, but also valuable information on the hydration state and heterogeneity of supraclavicular fat. Alone, however, MR fat fraction maps do not necessarily correlate with BAT maps obtained with combined FDG-PET/MRI, especially in those BAT-positive subjects with low BAT activity. The lack of a clear and consistent difference in fat fraction between FDG avid and non-avid supraclavicular fat regions can be attributed to the heterogeneity of the supraclavicular fat depots and the paucity of BAT in this depot. Although a decrease in fat fraction was seen in some of the young, BAT-positive subjects during stimulation of thermogenic activity, changes in fat fraction in supraclavicular fat depots were small compared to those reported in rodents and hard to detect if an appropriate protocol was not used.
Supplementary Material
Supporting Figure S1. Example of FF maps obtained with different FF separation algorithms for an axial slice encompassing the supraclavicular fat depot from subject P. a. FF map obtained by using the magnitude-based algorithm b. FF map obtained by using the combined magnitude-based and complex-based separation algorithm. c. Difference map. Right side shows the supraclavicular fat depot with outlined in red the region corresponding to BATMRI (FF>40%). No differences in FF were observed within the supraclavicular fat depot.
Supporting Figure S2. Plots showing FF values obtained with the two different algorithms for each voxel within the supraclavicular fat depot identified as BATMRI (FF>40%). For all 5 subjects, the FF values obtained with the two algorithms displayed a linear relationship with a R2=1, slope=1, and y int.<10−11.
Supporting Figure S3. Plots of FDG uptake vs. FF and R2* for all voxels identified as BATMRI (FF>40) for seven participants. A linear regression analysis was run on both plots as well as on both the R2* and FF data together allowing for quadratic and interaction terms. R2 values are given for each fit. No clear, general trend was observed between FF or R2* and glucose uptake in any of the subjects. Participant I, R2: FF=0.013 R2*=0.006 Combination=0.04. Participant J, R2: FF=0.002 R2*=0.026 Combination=0.04. Participant K, R2: FF=0.020 R2*=0.025 Combination=0.068. Participant M, R2: FF=0.0001 R2*=0.020 Combination= 0.040. Participant N, R2: FF=0.002 R2*=0.0001 Combination=0.079. Participant O, R2: FF=0.053 R2*=0.014 Combination=0.057. Participant P, R2: FF=0.001 R2*=0.011 Combination=0.029.
Supporting Figure S4. Average FF values for the BATPET/MRI volume identified in subjects C, E, F, and G measured during cold exposure. Subjects E, and F (b. and c.) showed a decrease in the average BAT fat fraction value during the individualized cooling protocol while participants C and G (a. and d.) did not.
Acknowledgments
This work was funded by the National Institutes of Health, through Grant Award # R01 R01DK108231, and by the North Carolina National Center for Advancing Translational Sciences (NCATS), NIH Grant Award # UL1TR001111. Special thanks to Xiaodong Zhong of MR R&D Collaborations, Siemens Healthcare, Atlanta, Georgia, USA for help with the six-echo Dixon fitting protocol.
Footnotes
A third type of tissue called beige fat was more recently identified(48) both in mice and humans, triggering a literature debate on whether supraclavicular brown fat tissue is truly brown or beige.(42) For the sake of simplicity, in this manuscript we will not differentiate between these two shades, which we will refer to as brown fat or BAT.
References
- 1.Cannon B, Nedergaard J. Brown adipose tissue: function and physiological significance. Physiological reviews. 2004;84(1):277–359. doi: 10.1152/physrev.00015.2003. [DOI] [PubMed] [Google Scholar]
- 2.Cannon B, Nedergaard J. The biochemistry of an inefficient tissue: brown adipose tissue. Essays in biochemistry. 1985;20:110–164. [PubMed] [Google Scholar]
- 3.Ricquier D, Gaillard JL, Turc JM. Microcalorimetry of isolated mitochondria from brown adipose tissue. FEBS Letters. 1979;99(1):203–206. doi: 10.1016/0014-5793(79)80279-3. [DOI] [PubMed] [Google Scholar]
- 4.Cinti S. Between brown and white: novel aspects of adipocyte differentiation. Annals of medicine. 2011;43(2):104–115. doi: 10.3109/07853890.2010.535557. [DOI] [PubMed] [Google Scholar]
- 5.Lowell BB, Spiegelman BM. Towards a molecular understanding of adaptive thermogenesis. Nature. 2000;404(6778):652–660. doi: 10.1038/35007527. [DOI] [PubMed] [Google Scholar]
- 6.Mercer SW, Trayhurn P. Effect of high fat diets on energy balance and thermogenesis in brown adipose tissue of lean and genetically obese ob/ob mice. The Journal of nutrition. 1987;117(June):2147–2153. doi: 10.1093/jn/117.12.2147. [DOI] [PubMed] [Google Scholar]
- 7.Rothwell NJ, Stock MJ. A role for brown adipose tissue in diet-induced thermogenesis. Obesity research. 1997;5(6):650–656. doi: 10.1002/j.1550-8528.1997.tb00591.x. [DOI] [PubMed] [Google Scholar]
- 8.van der Lans aa JJ, Wierts R, Vosselman MJ, Schrauwen P, Brans B, van Marken Lichtenbelt WD. Cold-activated brown adipose tissue in human adults: methodological issues. AJP: Regulatory, Integrative and Comparative Physiology. 2014;307(2):R103–R113. doi: 10.1152/ajpregu.00021.2014. [DOI] [PubMed] [Google Scholar]
- 9.Brooks SL, Neville AM, Rothwell NJ, Stock MJ, Wilson S. Sympathetic activation of brown-adipose-tissue thermogenesis in cachexia. Bioscience Reports. 1981;512(1):509–517. doi: 10.1007/BF01121584. [DOI] [PubMed] [Google Scholar]
- 10.Foster DO, Frydman ML. Nonshivering thermogenesis in the rat. II. Measurements of blood flow with microspheres point to brown adipose tissue as the dominant site of the calorigenesis induced by noradrenaline. Canadian journal of physiology and pharmacology. 1978;56(1):110–122. doi: 10.1139/y78-015. [DOI] [PubMed] [Google Scholar]
- 11.Lowell BB, S-Susulic V, Hamann A, Lawitts Ja, Himms-Hagen J, Boyer BB, Kozak LP, Flier JS. Development of obesity in transgenic mice after genetic ablation of brown adipose tissue. Nature. 1993;366(6457):740–742. doi: 10.1038/366740a0. [DOI] [PubMed] [Google Scholar]
- 12.Cypess AM, Haft CR, Laughlin MR, Hu HH. Brown fat in humans: consensus points and experimental guidelines. Cell metabolism. 2014;20(3):408–15. doi: 10.1016/j.cmet.2014.07.025. [DOI] [PMC free article] [PubMed] [Google Scholar]
- 13.Cannon B, Nedergaard J. Metabolic consequences of the presence or absence of the thermogenic capacity of brown adipose tissue in mice (and probably in humans) International journal of obesity (2005) 2010;34(Suppl 1)(S1):S7–16. doi: 10.1038/ijo.2010.177. [DOI] [PubMed] [Google Scholar]
- 14.Nedergaard J, Bengtsson T, Cannon B. Unexpected evidence for active brown adipose tissue in adult humans. American journal of physiology. Endocrinology and metabolism. 2007;293(2):E444–E452. doi: 10.1152/ajpendo.00691.2006. [DOI] [PubMed] [Google Scholar]
- 15.van Marken Lichtenbelt W, Vanhommerig J, Smulders N, Drossearts J, Kemerink G, Bouvy N, Schrauwen P, Teule J. Cold-Activated Brown Adipose Tissue in Healthy Men. New England Journal of Medicine. 2009;360(15):1500–1508. doi: 10.1056/NEJMoa0808718. [DOI] [PubMed] [Google Scholar]
- 16.Ma S, Foster D. Uptake of glucose and release of fatty acids and glycerol by rat brown adipose tissue in vivo. CAN J PHYSIOL PHARMACOL. 1986;64:609–614. doi: 10.1139/y86-101. [DOI] [PubMed] [Google Scholar]
- 17.Orava J, Nuutila P, Lidell ME, Oikonen V, Noponen T, Viljanen T, Scheinin M, Taittonen M, Niemi T, Enerbäck S, et al. Different metabolic responses of human brown adipose tissue to activation by cold and insulin. Cell Metabolism. 2011;14(2):272–279. doi: 10.1016/j.cmet.2011.06.012. [DOI] [PubMed] [Google Scholar]
- 18.Bauwens M, Wierts R, Van Royen B, Bucerius J, Backes W, Mottaghy F, Brans B. Molecular imaging of brown adipose tissue in health and disease. European Journal of Nuclear Medicine and Molecular Imaging. 2014;41(4):776–791. doi: 10.1007/s00259-013-2611-8. [DOI] [PubMed] [Google Scholar]
- 19.Chen YI, Cypess aM, Chen YC, Palmer M, Kolodny G, Kahn CR, Kwong KK. Measurement of human brown adipose tissue volume and activity using anatomic MR imaging and functional MR imaging. Journal of Nuclear Medicine. 2013;54(9):1584–1587. doi: 10.2967/jnumed.112.117275. [DOI] [PMC free article] [PubMed] [Google Scholar]
- 20.Rasmussen JM, Entringer S, Nguyen A, Van Erp TGM, Guijarro A, Oveisi F, Swanson JM, Piomelli D, Wadhwa PD, Buss C, et al. Brown adipose tissue quantification in human neonates using water-fat separated MRI. PLoS ONE. 2013;8(10) doi: 10.1371/journal.pone.0077907. [DOI] [PMC free article] [PubMed] [Google Scholar]
- 21.Aherne W, Hull D. The Site of Heat Production in the Newborn Infant. Proceedings of the Royal Society of Medicine. 1964;57:1172–3. doi: 10.1177/003591576405701226. [DOI] [PMC free article] [PubMed] [Google Scholar]
- 22.Branca RT, Zhang L, Warren WS, Auerbach E, Khanna A, Degan S, Ugurbil K, Maronpot R. In Vivo Noninvasive Detection of Brown Adipose Tissue through Intermolecular Zero-Quantum MRI. PLoS ONE. 2013;8(9) doi: 10.1371/journal.pone.0074206. [DOI] [PMC free article] [PubMed] [Google Scholar]
- 23.Kortelainen ML, Pelletier G, Ricquier D, Bukowiecki LJ. Immunohistochemical detection of human brown adipose tissue uncoupling protein in an autopsy series. The journal of histochemistry and cytochemistry: official journal of the Histochemistry Society. 1993;41(5):759–764. doi: 10.1177/41.5.8468458. [DOI] [PubMed] [Google Scholar]
- 24.Kellman GM, Kneeland B, Middleton WD, Cates JD, Pech P, Grist TM, Foley DW, Jesmanowicz A, Froncisz W, Hyde JS. MR Imaging of the Supraclavicular Region: Normal Anatomy. American Journal of Roentgenology. 1987;148(1):77–82. doi: 10.2214/ajr.148.1.77. [DOI] [PubMed] [Google Scholar]
- 25.Gifford A, Towse TF, Walker RC, Avison MJ, Welch EB. Characterizing Active and Inactive Brown Adipose Tissue in Adult Humans Using PET-CT and MR Imaging. American Journal of Physiology - Endocrinology And Metabolism. 2016 doi: 10.1152/ajpendo.00482.2015. ajpendo.00482.2015. [DOI] [PMC free article] [PubMed] [Google Scholar]
- 26.Zhong X, Nickel MD, Kannengiesser SAR, Dale BM, Kiefer B, Bashir MR. Liver fat quantification using a multi-step adaptive fitting approach with multi-echo GRE imaging. Magnetic Resonance in Medicine. 2014;72(5):1353–1365. doi: 10.1002/mrm.25054. [DOI] [PubMed] [Google Scholar]
- 27.Hu HH, Perkins TG, Chia JM, Gilsanz V. Characterization of Human Brown Adipose Tissue by Chemical-Shift Water-Fat MRI. AJR Am J Roentgenol. 2013;200(1):177–183. doi: 10.2214/AJR.12.8996. [DOI] [PMC free article] [PubMed] [Google Scholar]
- 28.Ren J, Dimitrov I, Sherry DA, Malloy CR. Composition of Adipose Tissue and Marrow Fat by 1H MR Spectroscopy at 7 Tesla. Journal of lipid research. 2008;49:2055–2062. doi: 10.1194/jlr.D800010-JLR200. [DOI] [PMC free article] [PubMed] [Google Scholar]
- 29.Yu H, Shimakawa A, Hines CDG, McKenzie CA, Hamilton G, Sirlin CB, Brittain JH, Reeder SB. Combination of complex-based and magnitude-based multiecho water-fat separation for accurate quantification of fat-fraction. Magnetic Resonance in Medicine. 2011;66(1):199–206. doi: 10.1002/mrm.22840. [DOI] [PMC free article] [PubMed] [Google Scholar]
- 30.Kinahan PE, Fletcher JW. PET/CT Standardized Uptake Values (SUVs) in Clinical Practice and Assessing Response to Therapy. Semin Ultrasound CT MR. 2010;31(6):496–505. doi: 10.1053/j.sult.2010.10.001. [DOI] [PMC free article] [PubMed] [Google Scholar]
- 31.Bernard CP, Liney GP, Manton DJ, Turnbull LW, Langton CM. Comparison of fat quantification methods: A phantom study at 3.0T. Journal of Magnetic Resonance Imaging. 2008;27(1):192–197. doi: 10.1002/jmri.21201. [DOI] [PubMed] [Google Scholar]
- 32.Hernando D, Sharma SD, Kramer H, Reeder SB. On the confounding effect of temperature on chemical shift-encoded fat quantification. Magnetic Resonance in Medicine. 2014;72(2):464–470. doi: 10.1002/mrm.24951. [DOI] [PMC free article] [PubMed] [Google Scholar]
- 33.Vosselman MJ, Brans B, Van Der Lans AAJJ, Wierts R, Van Baak MA, Mottaghy FM, Schrauwen P, Van Marken Lichtenbelt WD. Brown adipose tissue activity after a high-calorie meal in humans. American Journal of Clinical Nutrition. 2013;98(1):57–64. doi: 10.3945/ajcn.113.059022. [DOI] [PubMed] [Google Scholar]
- 34.Vosselman MJ, van der Lans AAJJ, Brans B, Wierts R, Van Baak MA, Schrauwen P, van Marken Lichtenbelt WD. Systemic [ Beta ]-Adrenergic Stimulation of Thermogenesis Is Not … Diabetes. 2012;61(12):3106–3113. doi: 10.2337/db12-0288. [DOI] [PMC free article] [PubMed] [Google Scholar]
- 35.Soret M, Bacharach SL, Buvat I. Partial-volume effect in PET tumor imaging. Journal of nuclear medicine: official publication, Society of Nuclear Medicine. 2007;48(6):932–945. doi: 10.2967/jnumed.106.035774. [DOI] [PubMed] [Google Scholar]
- 36.Lundström E, Strand R, Johansson L, Bergsten P, Ahlström H, Kullberg J. Magnetic Resonance Imaging Cooling-Reheating Protocol Indicates Decreased Fat Fraction via Lipid Consumption in Suspected Brown Adipose Tissue. Plos One. 2015;10(4):e0126705. doi: 10.1371/journal.pone.0126705. [DOI] [PMC free article] [PubMed] [Google Scholar]
- 37.Bydder M, Yokoo1 T, Hamilton G, Middleton MS, Chavez AD, Schwimmer JB, Lavine JE, Sirlin CB. Relaxation Effects in the Quantification of Fat using Gradient Echo Imaging. Magnetic Resonance Imaging. 2008;26(3):347–359. doi: 10.1016/j.mri.2007.08.012. [DOI] [PMC free article] [PubMed] [Google Scholar]
- 38.Franz D, Karampinos DC, Rummeny EJ, Souvatzoglou M, Beer AJ, Nekolla SG, Schwaiger M, Eiber M. Discrimination Between Brown and White Adipose Tissue Using a 2-Point Dixon Water-Fat Separation Method in Simultaneous PET/MRI. Journal of Nuclear Medicine. 2015;56(11):1742–1747. doi: 10.2967/jnumed.115.160770. [DOI] [PubMed] [Google Scholar]
- 39.Hu HH, Tovar JP, Pavlova Z, Smith ML, Gilsanz V. Unequivocal identification of brown adipose tissue in a human infant. Journal of Magnetic Resonance Imaging. 2012;35(4):938–942. doi: 10.1002/jmri.23531. [DOI] [PMC free article] [PubMed] [Google Scholar]
- 40.van Rooijen BD, van der Lans AaJJ, Brans B, Wildberger JE, Mottaghy FM, Schrauwen P, Backes WH, van Marken Lichtenbelt WD. Imaging Cold-Activated Brown Adipose Tissue Using Dynamic T2*-Weighted Magnetic Resonance Imaging and 2-Deoxy-2-[18F]fluoro-D-glucose Positron Emission Tomography. Investigative Radiology. 2013;48(10):1–7. doi: 10.1097/RLI.0b013e31829363b8. [DOI] [PubMed] [Google Scholar]
- 41.Johannesen HH, Löfgren J, Donkin I, Hansen AE, Loft A, Højgaard L, Kjær A. Identification and characterization of human brown adipose tissue (BAT) content and metabolism in adults using [(18)F]-FDG PET/MR - a pilot study. EJNMMI physics. 2014;1(Suppl 1):A68. doi: 10.1186/2197-7364-1-S1-A68. [DOI] [PMC free article] [PubMed] [Google Scholar]
- 42.Zingaretti MC, Crosta F, Vitali A, Guerrieri M, Frontini A, Cannon B, Nedergaard J, Cinti S. The presence of UCP1 demonstrates that metabolically active adipose tissue in the neck of adult humans truly represents brown adipose tissue. The FASEB Journal. 2009;23(9):3113–3120. doi: 10.1096/fj.09-133546. [DOI] [PubMed] [Google Scholar]
- 43.Lee P, Zhao JT, Swarbrick MM, Gracie G, Bova R, Greenfield JR, Freund J, Ho KKY. High prevalence of brown adipose tissue in adult humans. The Journal of clinical endocrinology and metabolism. 2011;96(8):2450–2455. doi: 10.1210/jc.2011-0487. [DOI] [PubMed] [Google Scholar]
- 44.Branca RT, He T, Zhang L, Floyd CS, Freeman M, White C, Burant A. Detection of brown adipose tissue and thermogenic activity in mice by hyperpolarized xenon MRI. Proceedings of the National Academy of Sciences. 2014;111(50):18001–18006. doi: 10.1073/pnas.1403697111. [DOI] [PMC free article] [PubMed] [Google Scholar]
- 45.Hu HH, Smith DL, Nayak KS, Goran MI, Nagy TR. Identification of brown adipose tissue in mice with fat-water IDEAL-MRI. Journal of Magnetic Resonance Imaging. 2010;31(5):1195–1202. doi: 10.1002/jmri.22162. [DOI] [PMC free article] [PubMed] [Google Scholar]
- 46.Frontini A, Cinti S. Distribution and Development of Brown Adipocytes in the Murine and Human Adipose Organ. Cell Metabolism. 2016;11(4):253–256. doi: 10.1016/j.cmet.2010.03.004. [DOI] [PubMed] [Google Scholar]
- 47.Lau Z, Chen P, Gu Y, Ladouceur-Wodzak M, Nayak KS, Cunningham CH. Noninvasive identification and assessment of functional brown adipose tissue in rodents using hyperpolarized (13)C imaging. International Journal of Obesity. 2014;38(1):126–31. doi: 10.1038/ijo.2013.58. [DOI] [PubMed] [Google Scholar]
- 48.Wu J, Boström P, Sparks LM, Ye L, Choi JH, Giang A-H, Khandekar M, Virtanen KA, Nuutila P, Schaart G, et al. Beige Adipocytes Are a Distinct Type of Thermogenic Fat Cell in Mouse and Human. Cell. 2016;150(2):366–376. doi: 10.1016/j.cell.2012.05.016. [DOI] [PMC free article] [PubMed] [Google Scholar]
Associated Data
This section collects any data citations, data availability statements, or supplementary materials included in this article.
Supplementary Materials
Supporting Figure S1. Example of FF maps obtained with different FF separation algorithms for an axial slice encompassing the supraclavicular fat depot from subject P. a. FF map obtained by using the magnitude-based algorithm b. FF map obtained by using the combined magnitude-based and complex-based separation algorithm. c. Difference map. Right side shows the supraclavicular fat depot with outlined in red the region corresponding to BATMRI (FF>40%). No differences in FF were observed within the supraclavicular fat depot.
Supporting Figure S2. Plots showing FF values obtained with the two different algorithms for each voxel within the supraclavicular fat depot identified as BATMRI (FF>40%). For all 5 subjects, the FF values obtained with the two algorithms displayed a linear relationship with a R2=1, slope=1, and y int.<10−11.
Supporting Figure S3. Plots of FDG uptake vs. FF and R2* for all voxels identified as BATMRI (FF>40) for seven participants. A linear regression analysis was run on both plots as well as on both the R2* and FF data together allowing for quadratic and interaction terms. R2 values are given for each fit. No clear, general trend was observed between FF or R2* and glucose uptake in any of the subjects. Participant I, R2: FF=0.013 R2*=0.006 Combination=0.04. Participant J, R2: FF=0.002 R2*=0.026 Combination=0.04. Participant K, R2: FF=0.020 R2*=0.025 Combination=0.068. Participant M, R2: FF=0.0001 R2*=0.020 Combination= 0.040. Participant N, R2: FF=0.002 R2*=0.0001 Combination=0.079. Participant O, R2: FF=0.053 R2*=0.014 Combination=0.057. Participant P, R2: FF=0.001 R2*=0.011 Combination=0.029.
Supporting Figure S4. Average FF values for the BATPET/MRI volume identified in subjects C, E, F, and G measured during cold exposure. Subjects E, and F (b. and c.) showed a decrease in the average BAT fat fraction value during the individualized cooling protocol while participants C and G (a. and d.) did not.