

Abstract
Next‐generation sequencing in combination with quantitative polymerase chain reaction analysis revealed a dynamic miRNA signature in the interdigital mesoderm of the chick embryonic hinlimb in the course of interdigit remodelling. During this period, 612 previously known chicken miRNAs (gga‐miRNAs) and 401 non‐identified sequences were expressed in the interdigital mesoderm. Thirty‐six microRNAs, represented by more than 750 reads per million, displayed differential expression between stages HH29 (6 id) and HH32 (7.5 id), which correspond to the onset and the peak of interdigital cell death. Twenty miRNAs were upregulated by at least 1.5‐fold, and sixteen were downregulated by at least 0.5‐fold. Upregulated miRNAs included miRNAs with recognized proapoptotic functions in other systems (miR‐181 family, miR‐451 and miR‐148a), miRNAs associated with inflammation and cell senescence (miR‐21 and miR‐146) and miRNAs able to induce changes in the extracellular matrix (miR‐30c). In contrast, miRNAs with known antiapoptotic effects in other systems, such as miR‐222 and miR‐205, became downregulated. In addition, miR‐92, an important positive regulator of cell proliferation, was also downregulated. Together, these findings indicate a role for miRNAs in the control of tissue regression and cell death in a characteristic morphogenetic embryonic process based on massive apoptosis.
Keywords: apoptosis, INZ, limb development, programmed cell death, senescence
Introduction
In the last decade, non‐coding small RNAs (miRNAs) have emerged as new and important signals that regulate cell proliferation and differentiation in embryonic, adult and tumoural systems. It has been well established that miRNAs negatively control the function of target genes (Krol et al. 2010). At a mechanistic level, miRNAs cause degradation or translational repression of mRNAs, and the specificity of this degradation is produced by the complementarity of a 7–8 nucleotide sequence at the 5′ end of the miRNA molecule with the target mRNAs.
In developing systems, miRNAs show specific temporal and spatial expression patterns (Ahmed et al. 2015), and have been functionally implicated in events requiring cell fate determination. The numerous developmental processes involving an active role of miRNAs include gametogenesis, preimplantation and early embryonic stages, neurogenesis and somitogenesis (Ahmed et al. 2015; Lopez‐Sanchez et al. 2015; Bhattacharya et al. 2017). However, the association of developmental defects with miRNA mutations in humans and other mammals is rare (de Pontual et al. 2011; Parchem et al. 2015; Yang et al. 2015).
The possible involvement of miRNAs in the regulation of embryonic programmed cell death remains largely unknown despite the central importance of cell death in organ morphogenesis and tissue differentiation (Hurle & Ojeda, 1979; Hurle et al. 1996). In contrast, functional analysis of miRNAs in the regulation of cell death in tumoural tissues has been the focus of considerable interest. It has been shown that miRNAs modulate progression and chemotherapy sensitivity in a large variety of cancers, but the mechanistic basis of this regulation is variable. Numerous miRNAs modulate tumour progression, directly targeting the expression of genes involved in either the intrinsic or extrinsic apoptotic pathways (for review, see Su et al. 2015). Hence, there are pro‐oncogenic miRNAs that target factors of the extrinsic apoptotic pathway, thereby protecting cancer cells from apoptosis induced by anti‐tumoural treatments (Wang et al. 2013). Other miRNAs have similar anti‐chemotherapeutic effects on cancer, but act by targeting components of the intrinsic apoptotic pathway such as Bak (Zhou et al. 2010) or the executioner caspases (Tsang & Kwok, 2008). In a complementary fashion, miRNAs may also inhibit cancer growth and metastasis, promoting cell death by targeting anti‐apoptotic factors such as Bcl‐2 or Bcl‐XL (Cimmino et al. 2005; Ji et al. 2013). These miRNAs often appear downregulated in various tumoural lineages. miRNAs have also been functionally associated with oxidative stress (Mikhed et al. 2015), which is a central feature in embryonic degenerative processes (Covarrubias et al. 2008; Lorda‐Diez et al. 2015a). Various miRNAs are upregulated in response to oxidative stress, and the overexpression of these miRNAs leads to endothelial cell apoptosis and senescence (Magenta et al. 2016).
In addition to the direct regulation of the apoptotic molecular cascades, the regulation of apoptosis by miRNAs can be mediated by the indirect targeting of regulatory signals, which in turn regulate cell death. Notably, various miRNAs such as miR‐21 or miR‐590‐5p, modulate intracellular effectors of TGFβ signalling (Li et al. 2013; Lan et al. 2014; Jafarzadeh & Soltani, 2016), and miR‐140‐5p and miR‐130 modulate BMP2 signalling in embryonic vertebrates (Lopez‐Sanchez et al. 2015; Gan et al. 2016). Furthermore, miRNAs may also be involved in DNA damage and in senescence, which are degradative processes associated with embryonic programmed cell death (Lorda‐Diez et al. 2015a; Montero et al. 2016).
The findings reviewed above suggest miRNAs as potential regulatory signals of embryonic cell death. The present study was designed to identify the microRNA signature in a highly characteristic model of embryonic programmed cell death, using next‐generation sequencing. To this end, we have selected the areas of massive cell death that sculpt the shape of the digits in the embryonic limb autopod of tetrapods. The autopod is the distal region of the embryonic limb. Its mesoderm, which originates from the lateral plate, forms digit and interdigit precursors. In the digit regions, mesodermal progenitors aggregate to form cartilage. In contrast, in species with free digits, the interdigital regions undergo degeneration and are eliminated. The remodelling process includes massive apoptosis, growth arrest, senescence and degradation of the extracellular matrix (Hurle et al. 1996; Lorda‐Diez et al. 2015a). This morphogenetic process is finely regulated by TGFβ signalling.
Materials and methods
We employed chick embryos at 6 and 7.5 days of incubation (id), which represent developmental stages HH29 and HH32, respectively. These stages correspond with the onset and the peak of the remodelling of the interdigital tissue in the embryonic limb. We also employed duck embryos ranging between incubation days 7.5 and 11.5 (7.5 id–11.5 id).
miRNA extraction and high‐throughput sequencing
We performed next‐generation sequencing of miRNAs extracted from embryonic limb interdigits at incubation day 6 (6 id) and incubation day 7.5 (7.5 id). A total of 12 interdigits were microdissected from hindlimbs of each stage. We employed the mirPremier miRNA isolation kit (Sigma). RNA concentrations and quality were determined in the Agilent 2100 bioanalyzer (Agilent Technologies) with a RNA 6000 Nano chip. We next prepared cDNA libraries for subsequent cluster generation, using the Illumina TruSeq Small RNA sample preparation protocol. The amplified cDNA samples were run in the bioanalyser before their purification in the Pippin Sage system (Sage Science). Final libraries were analysed by absolute quantitative polymerase chain reaction (qPCR) to establish the number of copies of each miRNA, and they were then sequenced by BGI (Beijing Genomics Institute). Because the limits of the 6 id interdigits are not defined as well as those of stage 7.5 id, a second sample of 6 id interdigits was analysed to exclude the posibility that the values of miRNA expression were distorted by differences in the amount of tissue obtained in the course of interdigit microdissection. The number and the expression rate of miRNAs were almost identical in the two samples. Hence, the data reflected in the tables correspond to the mean values of the two readings.
For the identification of known miRNAs, reads were aligned against the reference miRNA data from Ensembl v. 74 genome assembly Galgal4.
Real‐time qPCR
To validate the data obtained from deep sequencing, we performed qPCR analysis of a panel of representative miRNAs regulated in the course of interdigit remodelling in chick embryos, including miR‐21, miR‐30a, miR‐92, miR‐144, miR‐146c, miR‐181‐a and miR‐451. The study was performed: (i) in normal chick regressing interdigits; (ii) in tissue samples from the digit rays of chick autopod prior to and during the interdigit remodelling process; and (iii) in the third interdigit of duck embryos prior to, during and after physiological interdigital cell death.
Total RNA was extracted using TRIzol (Invitrogen). Reverse transcription (RT) was performed using TaqMan® MicroRNA Reverse Transcription Kits (Life Technologies). The resulting cDNAs were quantitatively amplified in a StepOne qPCR System (Life Technologies) using TaqMan® MicroRNA assays (Life Technologies) for the 3′ and 5′ chains. miRNA levels were normalized to RNU6B or 18S ribosomal RNA. Mean values for fold changes were calculated. Expression levels were evaluated relative to a calibrator according to the 2−ΔΔCt equation (Livak & Schmittgen, 2001). Data were analysed using Student's t‐test or anova followed by Bonferroni's test for post hoc comparisons. Statistical significance was set at P < 0.05.
Neutral red vital staining of interdigital cell death
To establish the pattern of interdigital cell death, both chick and duck embryos were vital stained with neutral red. For this purpose the embryonic limbs were dissected free and incubated at 37 °C in a solution of neutral red at 1/10−5 g mL−1 in phosphate‐buffered saline (PBS) until cell death was clearly perceptible. When cell death staining was optimal, samples were transferred to PBS and photographed under a dissecting microscope.
Results and discussion
Interdigits of embryonic limbs at 6 id and 7.5 id were selected for comparison of the miRNA signatures at the onset and at peak of interdigital cell death (Fig. 1) via next‐generation sequencing. We detected 612 previously known chicken miRNAs (gga‐miRNAs) and 401 still uncharacterized sequences expressed in the course of interdigit remodelling. Establishing a cutoff line of 750 reads per million (RPM), we selected a total of 71 known miRNAs and nine still uncharacterized transcripts for further study. In Fig. 2, the heatmap summarizes the expression level in combination with the rate of regulation of the selected miRNAs in the course of interdigit remodelling establishing 10 hierarchical clusters. However, in the forthcoming analysis and discussion, we simplified the miRNAs clusters based on their level of expression, and according to their positive or negative regulation.
Figure 1.
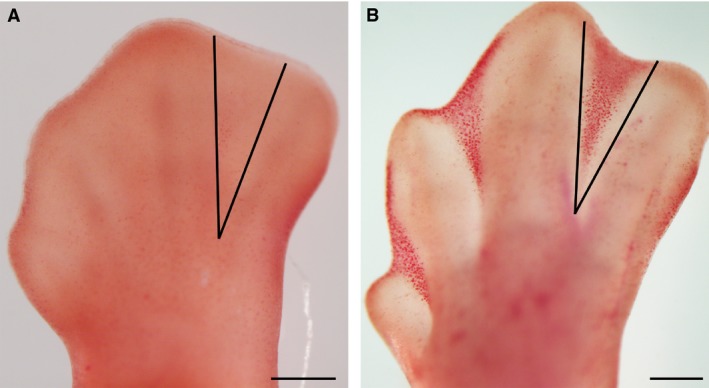
(A,B) Embryonic chicken limb autopods at (A) 6 id and (B) 7.5 id, stained with neutral red in order to visualize cell death in the interdigital tissue during development. Note the absence of cell death in (A) in comparison with (B) (dark red spotted labelling). Microdissection of the interdigits was performed as indicated by black lines. Scale bars: 200 μm.
Figure 2.
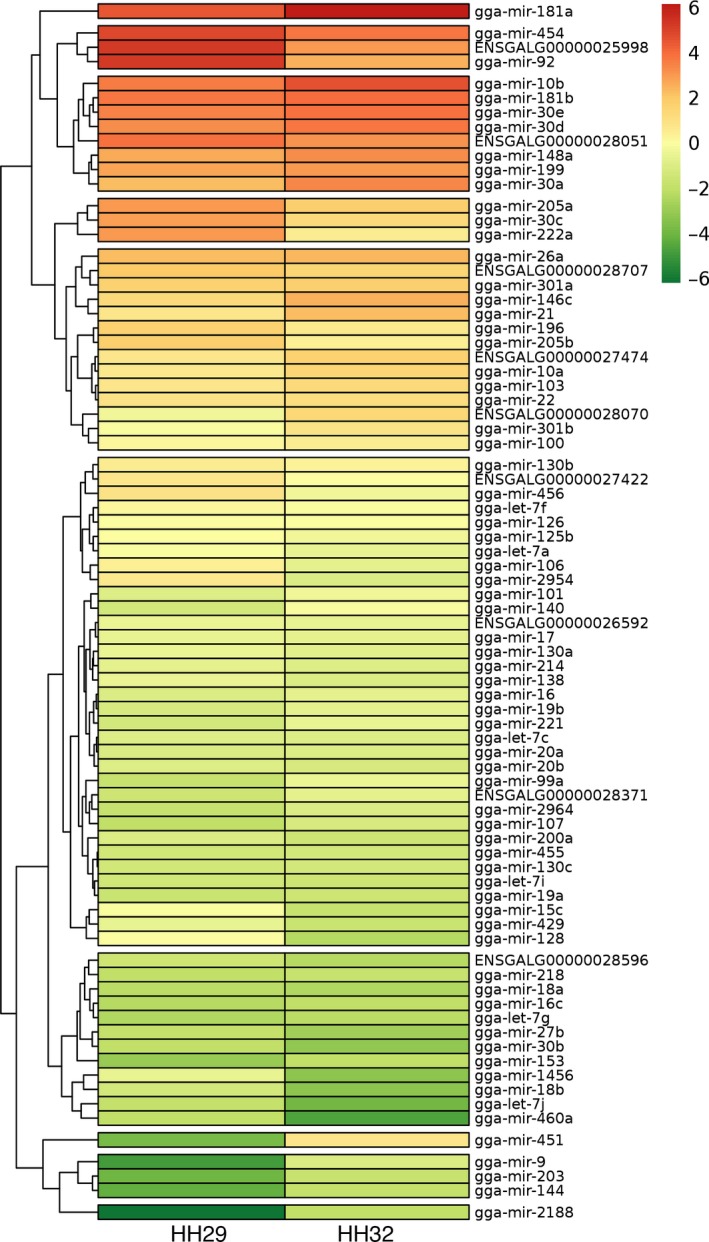
Interdigital miRNA expression heat map. The y‐axis on the dendogram shows the hierarchical clustering according to the level of expression and the rate of regulation between the 6 id (stage HH29) and 7.5 id (stage HH32). The colour palette sets the expression levels according to a colour scale from deep red (highest expression) to dark green (lowest expression).
Highly expressed interdigital miRNAs
Tables 1 and 2 show the interdigit miRNAs, ordered according to their expression level at each stage. As indicated in the tables, the top 10 miRNAs represented over 50% of the total number of transcripts present in the interdigit mesoderm. Two miRNA families, miR‐181 and miR‐30, which are involved in the control of apoptosis (Ouyang et al. 2012; Huang et al. 2015; Li et al. 2016) and in the regulation of TGFβ signalling (Carrella et al. 2015; Ye et al. 2015), showed very high expression levels in the interdigits. The miR‐181 family was represented by miR‐181a and ‐181b members (including the distinct precursor sequences miR‐181a‐1, a‐2, b‐1 and b‐2) that together constituted over 10% of the total miRNAs at 6 id and 30% at 7.5 id. The miR‐30 family was represented by miR‐30a, miR‐30b, miR‐30c (including c‐1 and c‐2), miR‐30d and miR‐30e, and constituted more than 10% of the total miRNAs at 7.5 id. miR‐92 was the most highly expressed miRNA at 6 id, representing more than 10% of the total number of counts. It belongs to the cluster miR‐17‐92, which also includes miR‐17, miR‐18a, miR‐18b, miR‐19a and miR‐19b (Du et al. 2015), all of which were expressed at much lower levels, and either showed no change in expression (17, 18a, 19a and 19b) or were downregulated (92, 18b) in the course of interdigit remodelling.
Table 1.
The chosen 71 interdigital miRNAs are listed in correlation with their level of expression (RPM) at 6 id (stage HH29) upon next‐generation sequencing analyses.
| Rank 6 id (29HH) | Name miRNA | RPM (mean) | % Change between samples | Rank 6 id (29HH) | Name miRNA | RPM (nean) | % Change between samples |
|---|---|---|---|---|---|---|---|
| 1 | gga‐mir‐92 | 127 453.8 | 9.0 | 37 | gga‐mir‐429 | 2390.1 | 6.5 |
| 2 | gga‐mir‐454 | 97 778.6 | 2.2 | 38 | gga‐mir‐17 | 2317.5 | 9.4 |
| 3 | gga‐mir‐181a | 79 730.6 | 1.2 | 39 | gga‐mir‐1456 | 2297.3 | 5.8 |
| 4 | gga‐mir‐181b | 46 060.8 | 3.0 | 40 | gga‐mir‐214 | 2106.7 | 8.6 |
| 5 | gga‐mir‐10b | 44 018.7 | 9.2 | 41 | gga‐mir‐20b | 1817.3 | 6.6 |
| 6 | gga‐mir‐30e | 39 253.1 | 3.2 | 42 | gga‐mir‐101 | 1808.7 | 9.6 |
| 7 | gga‐mir‐30d | 32 357.5 | 4.5 | 43 | gga‐let‐7c | 1780.8 | 12.3 |
| 8 | gga‐mir‐222a | 28 509.0 | 2.0 | 44 | gga‐mir‐200a | 1697.3 | 6.8 |
| 9 | gga‐mir‐205a | 27 106.6 | 4.2 | 45 | gga‐mir‐20a | 1690.7 | 3.2 |
| 10 | gga‐mir‐30c | 25 854.5 | 1.4 | 46 | gga‐mir‐16 | 1587.0 | 7.2 |
| 11 | gga‐mir‐199 | 23 550.9 | 0.6 | 47 | gga‐mir‐19b | 1545.2 | 12.5 |
| 12 | gga‐mir‐148a | 22 097.3 | 7.1 | 48 | gga‐mir‐18b | 1446.4 | 1.3 |
| 13 | gga‐mir‐30a | 16 980.6 | 4.4 | 49 | gga‐mir‐140 | 1431.9 | 9.2 |
| 14 | gga‐mir‐26a | 15 983.0 | 10.7 | 50 | gga‐mir‐221 | 1356.3 | 8.9 |
| 15 | gga‐mir‐205b | 11 626.6 | 0.8 | 51 | gga‐mir‐130c | 1277.9 | 5.8 |
| 16 | gga‐mir‐301a | 10 853.0 | 2.1 | 52 | gga‐mir‐455 | 1253.9 | 1.7 |
| 17 | gga‐mir‐196 | 10 624.5 | 5.8 | 53 | gga‐let‐7i | 1253.4 | 4.1 |
| 18 | gga‐mir‐146c | 8536.9 | 8.2 | 54 | gga‐mir‐19a | 1116.1 | 1.6 |
| 19 | gga‐mir‐456 | 6659.1 | 7.6 | 55 | gga‐mir‐2964 | 1017.6 | 2.5 |
| 20 | gga‐mir‐22 | 6446.2 | 1.6 | 56 | gga‐mir‐99a | 960.4 | 12.5 |
| 21 | gga‐mir‐21 | 6183.1 | 12.2 | 57 | gga‐let‐7j | 909.0 | 12.8 |
| 22 | gga‐mir‐103 | 6031.7 | 1.1 | 58 | gga‐mir‐27b | 897.2 | 2.9 |
| 23 | gga‐mir‐2954 | 5706.8 | 2.1 | 59 | gga‐mir‐218 | 860.9 | 2.3 |
| 24 | gga‐mir‐10a | 5608.1 | 11.4 | 60 | gga‐mir‐460a | 854.1 | 7.0 |
| 25 | gga‐mir‐130b | 5211.5 | 1.2 | 61 | gga‐mir‐107 | 821.5 | 0.8 |
| 26 | gga‐mir‐106 | 4572.3 | 0.4 | 62 | gga‐mir‐30b | 795.2 | 5.5 |
| 27 | gga‐let‐7f | 4042.7 | 5.9 | 63 | gga‐mir‐18a | 775.2 | 1.5 |
| 28 | gga‐mir‐100 | 3816.8 | 6.6 | 64 | gga‐mir‐16c | 675.7 | 1.9 |
| 29 | gga‐mir‐125b | 3508.6 | 3.7 | 65 | gga‐let‐7g | 616.7 | 1.1 |
| 30 | gga‐mir‐126 | 3461.8 | 5.9 | 66 | gga‐mir‐153 | 420.4 | 3.1 |
| 31 | gga‐mir‐128 | 3432.4 | 9.1 | 67 | gga‐mir‐451 | 245.9 | 6.8 |
| 32 | gga‐mir‐301b | 3386.3 | 0.1 | 68 | gga‐mir‐203 | 210.7 | 0.2 |
| 33 | gga‐let‐7a | 3293.2 | 10.7 | 69 | gga‐mir‐144 | 175.8 | 13.5 |
| 34 | gga‐mir‐15c | 3177.3 | 2.7 | 70 | gga‐mir‐9 | 111.7 | 9.6 |
| 35 | gga‐mir‐138 | 2563.0 | 8.5 | 71 | gga‐mir‐2188 | 47.1 | 5.2 |
| 36 | gga‐mir‐130a | 2450.4 | 2.5 |
The reads per million (RPM) values are the mean between two independent analyses. As mentioned in the text, these 71 miRNAs were selected because they displayed expression higher than 750 RPM at least at one of the two stages selected for studying interdigit degeneration (either 6 id, shown in this table, or 7.5 id shown below in Table 2).
Table 2.
The chosen 71 interdigital miRNAs are listed in correlation with their level of expression (RPM) at 7.5 id (stage HH32) upon next‐generation sequencing analysis.
| Rank 7.5 id (32HH) | Name miRNA | RPM 7.5 id (32HH) | Fold change 7.5 id vs. 6 id | Rank 7.5 id (32HH) | Name miRNA | RPM 7.5 id (32HH) | Fold change 7.5 id vs. 6 id |
|---|---|---|---|---|---|---|---|
| 1 | gga‐mir‐181a | 254 280 | 3.19 | 37 | gga‐mir‐17 | 2258 | 0.97 |
| 2 | gga‐mir‐10b | 84 990 | 1.93 | 38 | gga‐mir‐106 | 2216 | 0.48 |
| 3 | gga‐mir‐181b | 58 616 | 1.27 | 39 | gga‐mir‐19b | 2146 | 1.39 |
| 4 | gga‐mir‐30e | 53 041 | 1.35 | 40 | gga‐mir‐130a | 1974 | 0.81 |
| 5 | gga‐mir‐30d | 47 993 | 1.48 | 41 | gga‐let‐7c | 1804 | 1.01 |
| 6 | gga‐mir‐454 | 47 705 | 0.49 | 42 | gga‐mir‐214 | 1792 | 0.85 |
| 7 | gga‐mir‐30a | 37 389 | 2.20 | 43 | gga‐mir‐20a | 1779 | 1.05 |
| 8 | gga‐mir‐148a | 34 377 | 1.56 | 44 | gga‐mir‐2964 | 1750 | 1.72 |
| 9 | gga‐mir‐199 | 27 641 | 1.17 | 45 | gga‐mir‐9 | 1727 | 15.46 |
| 10 | gga‐mir‐146c | 21 193 | 2.48 | 46 | gga‐mir‐2954 | 1720 | 0.30 |
| 11 | gga‐mir‐92 | 20 633 | 0.16 | 47 | gga‐mir‐138 | 1691 | 0.66 |
| 12 | gga‐mir‐26a | 18 478 | 1.10 | 48 | gga‐mir‐20b | 1574 | 0.87 |
| 13 | gga‐mir‐21 | 17 356 | 2.81 | 49 | gga‐mir‐107 | 1519 | 1.85 |
| 14 | gga‐mir‐205a | 11 792 | 0.44 | 50 | gga‐mir‐455 | 1452 | 1.16 |
| 15 | gga‐mir‐301a | 11 765 | 1.08 | 51 | gga‐mir‐130c | 1412 | 1.11 |
| 16 | gga‐mir‐10a | 9965 | 1.78 | 52 | gga‐let‐7i | 1234 | 0.98 |
| 17 | gga‐mir‐103 | 8820 | 1.46 | 53 | gga‐mir‐200a | 1220 | 0.72 |
| 18 | gga‐mir‐30c | 8360 | 0.32 | 54 | gga‐mir‐19a | 1183 | 1.06 |
| 19 | gga‐mir‐22 | 8130 | 1.26 | 55 | gga‐mir‐429 | 1078 | 0.45 |
| 20 | gga‐mir‐301b | 6882 | 2.03 | 56 | gga‐mir‐15c | 1033 | 0.33 |
| 21 | gga‐mir‐451 | 6164 | 25.07 | 57 | gga‐mir‐218 | 988 | 1.15 |
| 22 | gga‐mir‐196 | 5431 | 0.51 | 58 | gga‐mir‐203 | 971 | 4.61 |
| 23 | gga‐mir‐222a | 5165 | 0.18 | 59 | gga‐mir‐144 | 900 | 5.12 |
| 24 | gga‐mir‐100 | 5056 | 1.32 | 60 | gga‐mir‐16c | 879 | 1.30 |
| 25 | gga‐mir‐205b | 4680 | 0.40 | 61 | gga‐mir‐2188 | 851 | 18.09 |
| 26 | gga‐mir‐130b | 4465 | 0.86 | 62 | gga‐mir‐153 | 832 | 1.98 |
| 27 | gga‐mir‐126 | 3590 | 1.04 | 63 | gga‐let‐7g | 755 | 1.22 |
| 28 | gga‐let‐7f | 3465 | 0.86 | 64 | gga‐mir‐128 | 722 | 0.21 |
| 29 | gga‐mir‐140 | 3304 | 2.31 | 65 | gga‐mir‐18a | 651 | 0.84 |
| 30 | gga‐mir‐125b | 2895 | 0.83 | 66 | gga‐mir‐27b | 491 | 0.55 |
| 31 | gga‐mir‐101 | 2736 | 1.51 | 67 | gga‐mir‐30b | 407 | 0.51 |
| 32 | gga‐mir‐456 | 2725 | 0.41 | 68 | gga‐mir‐1456 | 353 | 0.15 |
| 33 | gga‐mir‐99a | 2638 | 2.75 | 69 | gga‐mir‐18b | 347 | 0.24 |
| 34 | gga‐let‐7a | 2473 | 0.75 | 70 | gga‐let‐7j | 236 | 0.26 |
| 35 | gga‐mir‐221 | 2376 | 1.75 | 71 | gga‐mir‐460a | 137 | 0.16 |
| 36 | gga‐mir‐16 | 2277 | 1.43 |
As mentioned in the text, these 71 miRNAs were selected because they displayed expression higher than 750 reads per million (RPM) at least at one of the two stages selected for studying interdigit degeneration (either 6 id, shown above in Table 1, or 7.5 id, shown in this table).
Other miRNAs expressed at high levels included miR‐454, miR‐10b/miR‐10a, miR‐222a and miR‐205a/miR‐205b. miR‐454 has been functionally implicated in tumour biology (Yu et al. 2015), but its significance in developmental systems has not yet been characterized. miR‐10b and miR‐10a were expressed at elevated levels in the interdigits. Previous studies have associated this miRNA family with angiogenesis (Wang et al. 2016), the modulation of TGFβ signalling in the growth and metastasis of breast cancer (Han et al. 2014), and the regulation of Hox gene expression. miR‐222a, miR‐205a and miR‐205b were expressed at high levels in 6 id interdigits, but their expression was significantly lower at 7.5 id. As for most miRNAs identified in this study, the functional significance of these miRNAs has been associated with oncogenesis, but their function involves inhibition of apoptosis (Zhang et al. 2015; Brognara et al. 2016). In addition, there is also information suggesting a physiological role of these miRNAs in various aspects of skeletogenesis and bone differentiation targeting RUNX2, which is a master transcription factor of osteogenesis (Zhang et al. 2012; Yan et al. 2016).
The 20 miRNAs upregulated during interdigit remodelling
Of the 71 total known microRNAs represented by more than 750 RPM, 36 showed differential expression between 6 id and 7.5 id. As shown in Table 3, 20 miRNAs were upregulated by 1.5‐fold or more in the course of regression. In addition to the miR‐181, miR‐30 and miR‐10 families analysed above, 16 miRNAs were upregulated in the course of interdigit remodelling.
Table 3.
Twenty miRNA that undergo upregulation during interdigit degeneration.
| Name miRNA | RPMs 6 id (mean) | RPMs 7.5 id | % Change | Fold change |
|---|---|---|---|---|
| gga‐mir‐451 | 245.87 | 6164.04 | 2406.98 | 25.07 |
| gga‐mir‐2188 | 47.05 | 851.27 | 1709.20 | 18.09 |
| gga‐mir‐9 | 111.66 | 1726.60 | 1446.35 | 15.46 |
| gga‐mir‐144 | 175.82 | 900.43 | 412.12 | 5.12 |
| gga‐mir‐203 | 210.66 | 971.45 | 361.14 | 4.61 |
| gga‐mir‐181a | 79 730.62 | 254 280.30 | 218.92 | 3.19 |
| gga‐mir‐21 | 6183.10 | 17 355.59 | 180.69 | 2.81 |
| gga‐mir‐99a | 960.39 | 2637.85 | 174.66 | 2.75 |
| gga‐mir‐146c | 8536.91 | 21 193.16 | 148.25 | 2.48 |
| gga‐mir‐140 | 1431.88 | 3303.67 | 130.72 | 2.31 |
| gga‐mir‐30a | 16 980.62 | 37 389.09 | 120.19 | 2.20 |
| gga‐mir‐301b | 3386.31 | 6881.89 | 103.23 | 2.03 |
| gga‐mir‐153 | 420.35 | 831.93 | 97.91 | 1.98 |
| gga‐mir‐10b | 44 018.66 | 84 989.75 | 93.08 | 1.93 |
| gga‐mir‐107 | 821.45 | 1518.71 | 84.88 | 1.85 |
| gga‐mir‐10a | 5608.09 | 9965.12 | 77.69 | 1.78 |
| gga‐mir‐221 | 1356.32 | 2375.50 | 75.14 | 1.75 |
| gga‐mir‐2964 | 1017.59 | 1750.20 | 71.99 | 1.72 |
| gga‐mir‐148a | 22 097.28 | 34 376.77 | 55.57 | 1.56 |
| gga‐mir‐101 | 1808.72 | 2735.93 | 51.26 | 1.51 |
They are organized according to the level of regulation shown. The table shows the reads per million (RPM) at the different stages under study, the percentage of upregulation in miRNA expression, and the observed fold change in expression.
The most marked upregulation was shown by miR‐451. This miRNA was expressed at low levels in 6 id, but underwent a very intense upregulation in the course of interdigit regression (25.07‐fold). Studies in a variety of cancers have shown an important anti‐tumourigenic role for this miRNA in the promotion of apoptosis (Pan et al. 2013). miR‐451 forms a cluster and shares functional properties with miR‐144 (Pan et al. 2013), which is also upregulated in the interdigit (5.12‐fold), although its expression level was lower.
miR‐21 and miR‐146c were upregulated and expressed at elevated levels in the interdigital tissue. These miRNAs have previously been found to be associated with inflammation and senescence in tumoural and non‐embryonic systems (Olivieri et al. 2015). Emerging evidence indicates that interdigit remodelling involves a process of cell senescence that includes the acquisition of a proinflammatory secretory phenotype (Lorda‐Diez et al. 2015a,b). Therefore, both miRNAs may represent new components of the so‐called senescence‐associated secretome observed in the course of interdigit remodelling.
miR‐99a was upregulated 2.75‐fold in the course of regression. Although its expression in the interdigit was not very high, the roles performed by this miRNA in other systems suggest its potential involvement in digit development. In breast cancer, miR‐99a exerts an antiproliferative function and interacts with IGF‐1 (Xia et al. 2016). In addition, in mesenchymal stem cells, this miRNA has an antichondrogenic effect, targeting the type 2 BMP receptor (Zhou et al. 2016).
miR‐148a was upregulated to a low degree (1.56‐fold), but was expressed at high levels (more than 30 000 RPM at 7.5 id). Among the functions assigned to this miRNA in tumoural systems are the activation of the extrinsic (Joshi et al. 2015) and intrinsic apoptotic pathways (Liu et al. 2015), and the negative regulation of TGFβ2 signalling (Zhang & Li, 2016).
Some miRNAs were markedly upregulated but still expressed at low levels. It is likely that this expression pattern was produced by minority cell lineages present in the interdigits. This might be the case for miR‐2188, which showed an intense upregulation (18‐fold) that contrasts with a low level of expression (47 and 851 RPM at 6 id and 7.5 id, respectively). Considering that this miRNA has been implicated in angiogenesis (Soares et al. 2012), it is likely that its expression was associated with the blood vessels, which represent a minor population in the interdigits. Other upregulated miRNAs expressed at low levels are miR‐9, miR‐203, miR‐140, miR‐153, miR‐301b, miR‐107, miR‐2964, miR‐101 and miR‐221.
The 16 miRNAs downregulated during interdigit remodelling
As shown in Table 4, 16 miRNAs were downregulated by 0.5‐fold or less during the course of interdigit remodelling. Half of the downregulated miRNAs, including miR‐460a, miR‐1456, miR‐128, miR‐18b, miR‐let‐7j and miR‐15c, were expressed at very low levels. It is therefore unlikely that they would play significant functional roles in interdigit remodelling. Other downregulated miRNAs, including miR‐222a, miR‐205, miR‐92, mir‐454 and miR‐30c, were expressed at very high levels. As mentioned above, miR‐222a and miR‐205, which promote proliferation and inhibit cell death in tumoural systems, are expressed at high levels and downregulated in the course of interdigit regression. miR‐454 may target Btg1, a tumour suppressor gene responsible for inhibiting the growth and differentiation of digit skeletal progenitors (Lorda‐Diez et al. 2015a). miR‐92 was expressed at almost 127.453 RPM at 6 id and decreased fivefold to 20 633 RPM at 7.5 id. Notably, miR‐92 is one among the small number of miRNAs associated with a limb phenotype (Penzkofer et al. 2014). Mice deficient in miR‐92 and humans deficient in the miR‐17‐92 cluster (Feingold syndrome) are characterized by small body size, brachymesophalangy (de Pontual et al. 2011; Penzkofer et al. 2014) and partial syndactyly (Celli et al. 2003). miR‐30c is abundant in the interdigits of hindlimbs at 6 id and, unlike the other members of the miR‐30 family analysed above, became threefold downregulated in the course of interdigit remodelling. This finding is consistent with the demonstrated effect of miR‐30c in promoting proliferation in other embryonic tissues (Sun et al. 2016). However, it is likely that this miRNA was involved in the changes in the extracellular matrix occurring in the course of interdigit remodelling associated with the onset of interdigit regression (Diaz‐Mendoza et al. 2013). Notably, miR‐30 targets important components of the interdigit such as CTGF, Snail and Tgfβ2 (Roy et al. 2015) and, most importantly, its decay causes anoikis (Moreno‐Mateos et al. 2013), which is a type of cell death induced by loss of attachment to the extracellular matrix.
Table 4.
Sixteen miRNAs that showed downregulation during interdigit degeneration.
| Name miRNA | RPMs 6 id (mean) | RPMs 7.5 id | % Change | Fold change |
|---|---|---|---|---|
| gga‐mir‐1456 | 2297.34 | 352.83 | −84.64 | 0.15 |
| gga‐mir‐460a | 854.05 | 137.33 | −83.92 | 0.16 |
| gga‐mir‐92 | 127 453.83 | 20 633.25 | −83.81 | 0.16 |
| gga‐mir‐222a | 28 508.99 | 5164.61 | −81.88 | 0.18 |
| gga‐mir‐128 | 3432.42 | 722.34 | −78.96 | 0.21 |
| gga‐mir‐18b | 1446.38 | 347.19 | −76.00 | 0.24 |
| gga‐let‐7j | 909.01 | 235.98 | −74.04 | 0.26 |
| gga‐mir‐2954 | 5706.82 | 1720.16 | −69.86 | 0.30 |
| gga‐mir‐30c | 25 854.48 | 8360.42 | −67.66 | 0.32 |
| gga‐mir‐15c | 3177.28 | 1032.92 | −67.49 | 0.33 |
| gga‐mir‐205b | 11 626.60 | 4680.44 | −59.74 | 0.40 |
| gga‐mir‐456 | 6659.10 | 2724.88 | −59.08 | 0.41 |
| gga‐mir‐205a | 27 106.55 | 11 792.22 | −56.50 | 0.44 |
| gga‐mir‐429 | 2390.11 | 1078.05 | −54.90 | 0.45 |
| gga‐mir‐106 | 4572.27 | 2216.42 | −51.52 | 0.48 |
| gga‐mir‐454 | 97 778.63 | 47 705.19 | −51.21 | 0.49 |
They are organized according to the level of regulation shown. The table shows the reads per million (RPM) at the different stages under study, the percentage of downregulation in miRNA expression, and the observed fold change in expression.
miR‐2954, miR‐456, miR‐429 and miR‐106 are also downregulated during interdigit remodeling, but their association with programmed cell death is difficult to explain. The expression levels of these miRNAs were in the range of 2000–6000 RPM. miR‐2954 appears to be an avian‐specific miRNA expressed in the sexually dimorphic brain regions involved in song production and perception (Lin et al. 2014). miR‐456 has been associated with the maintenance of the undifferentiated state of chick blastoderm cells (Lee et al. 2011). miR‐429 and miR‐106 are oncomirs functionally associated with cell migration.
Analysis of still uncharacterized putative miRNA sequences
As shown in Table 5, nine uncharacterized putative miRNA sequences that were previously included in the database ENSEMBL v. 74 genome assembly Galgal4 were expressed over 750 RPM in the interdigits. Two of these sequences (ENSGALG00000028371 and ENSGALG00000026592) have no relation with any known miRNAs. The other seven are still unnamed, but they are sequentially and structurally related with miR‐143 (ENSGALG00000028070), miR‐182 (ENSGALG00000027474), miR‐19 (ENSGALG00000028596), miR‐363 (ENSGALG00000028707), miR‐26 (ENSGALG00000028051), miR‐10 (ENSGALG00000027422) and miR‐25 (ENSGALG00000025998). In particular, the miR‐143 homologous sequence is highly upregulated in the course of regression. This miRNA targets bcl2 in other systems, thereby promoting apoptosis (Liu et al. 2012). Similarly, the miR‐25 homologous sequence is intensely downregulated in the course of regression. miR‐25 belongs to the miR‐92 family, which include members that are expressed and downregulated in the course of regression (see above). Notably, miR‐25 in other systems protects against oxidative damage and inhibits apoptosis (Li et al. 2014; Pan et al. 2015).
Table 5.
Putative miRNA sequences expressed at over 750 RPM
| ENSEMBL Gene | RPM 6 id | % Variation | RPM 7.5 id | FC | Putative miRNA |
|---|---|---|---|---|---|
| ENSGALG00000028070 | 2684.0 | −1.4 | 9648 | 3.59 | mir‐143 |
| ENSGALG00000028371 | 1135.1 | −23.3 | 2141 | 1.89 | XXX |
| ENSGALG00000027474 | 6184.0 | 1.2 | 10 759 | 1.74 | mir‐182 |
| ENSGALG00000026592 | 2434.2 | −26.3 | 2460 | 1.01 | XXX |
| ENSGALG00000028707 | 14 070.3 | 4.1 | 10 228 | 0.73 | mir‐363 |
| ENSGALG00000028051 | 49 509.3 | 0.3 | 32 094 | 0.65 | mir‐26 |
| ENSGALG00000028596 | 1166.5 | −17.8 | 744 | 0.64 | mir‐19 |
| ENSGALG00000027422 | 5991.9 | 14.1 | 3779 | 0.63 | mir‐10 |
| ENSGALG00000025998 | 124 907.8 | 6.8 | 28 898 | 0.23 | mir‐25 |
The second column shows the mean reads per million (RPM) value at 6 id. The third column shows the percentage of variation between the two sequenced samples. The fourth column shows the RPM at 7.5 id. The fifth column shows the fold change in RPM between 6 id and 7.5 id. The sixth column shows the putative chicken miR deduced by their secondary structure.
Validation of deep sequencing data
To validate the data obtained from deep sequencing, we performed a complementary expression analysis by RT‐qPCR of seven miRNAs that appeared upregulated or downregulated in the deep sequencing. As shown in Fig. 3, quantification by qPCR confirmed the upregulation of miR‐451‐5p, miR‐144‐5p, miR‐21‐5p, miR‐146c‐5p, miR‐30a‐5p and miR‐181a (both ‐5p and ‐3p), and the downregulation of miR‐92‐3p. Together, these data indicate that the deep sequencing data represent actual miRNA expression levels. Consistently with findings in other tissue models, the 3′ chains of those miRNAs were almost undetectable except for miR‐181a and miR‐92, indicating that they undergo rapid degradation. In contrast to other miRNAs, miR‐92 was largely represented by the 3′ chain. At 6 id, expression of miR‐92‐5p in the interdigit was 10−3‐fold lower than miR‐92‐3p. miR‐181a‐3p, also termed miR‐213, was expressed at high levels (Fig. 2; Tables 1 and 2) and was also upregulated during the course of interdigit regression. This miRNA belongs to a group of miRNAs that coordinate the molecular mechanisms activated in the cells in response to environmental stress, termed miRStress (Jacobs et al. 2013) and actively participates in the differentiation of avian germ cells (Lee et al. 2011). Other miRNAs, present in the miRStress database are also expressed during the course of interdigit regression, including miR‐181b, miR‐21 and miR‐106 (Jacobs et al. 2013) but, except for miR‐21, they are not upregulated during interdigit regression.
Figure 3.
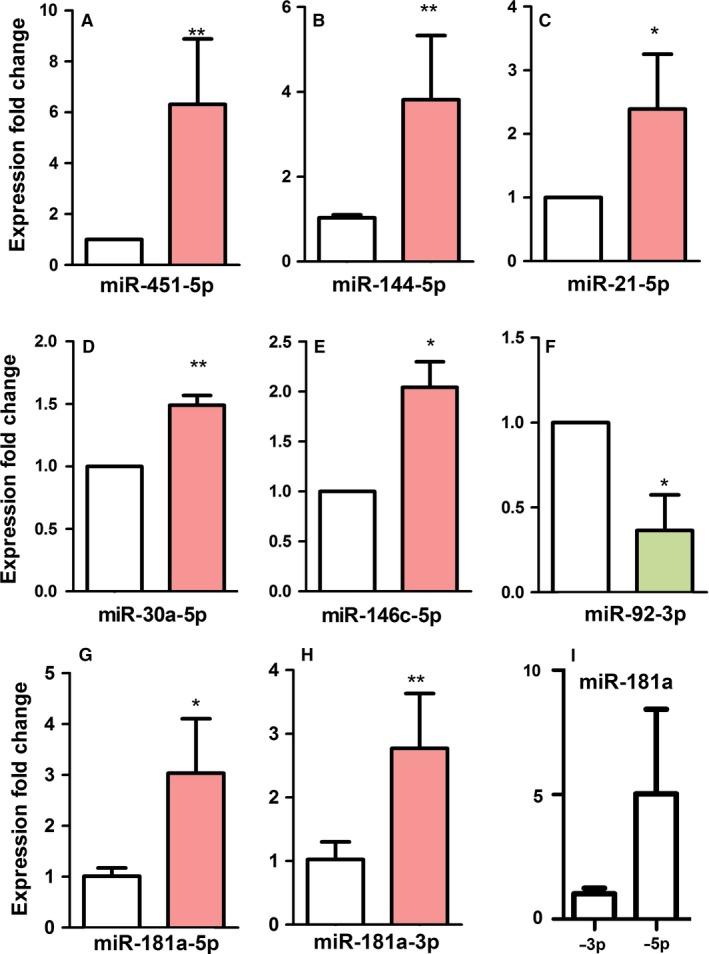
(A–I) Quantitative polymerase chain reaction (qPCR) analysis of the expression levels of the miR‐451, miR‐144, miR‐21, miR‐30, miR146, miR‐92 and miR‐181a in interdigits at 6 id (29HH stage) vs. 7.5 id interdigits (32HH stage). (A–E) The data confirmed the upregulation of (A) miR‐451, (B) miR‐144, (C) miR‐21, (D) miR‐30, (E) miR‐146 and (G,H) miR181a at 7.5 id (red right bars) when compared with the expression level at 6 id (white left bars). In the case of miR‐181a, both miR‐181a‐5′ and miR‐181a‐3′ were highly expressed and upregulated at stages of interdigital cell death. (I) Comparison of the expression levels of miR‐181a‐3′ and miR‐181a‐5′ at 7.5 id. (F) qPCR data also confirmed the downregulation of miR‐92 at 7.5 id (green right bar) with respect to the expression level at 6 id (left white bar) in the course of interdigital cell death. *P‐value > 0.05; **P‐value > 0.01.
Differential miRNA expression in interdigits vs. digit rays, and comparative analysis in duck embryos
To exclude the possibility that upregulation of miRNAs in the interdigit was due to tissue maturation rather than tissue degeneration, we analysed the expression levels in the developing digit rays of miRNAs upregulated in the degenerating interdigit. For this purpose, the distal region of the third digit was dissected free at 6 id and 7.5 id, and the expression levels of miR‐451‐5p, miR‐144‐5p, miR‐181a‐5p, miR‐21‐5p, miR‐30a‐5p and miR‐146c‐5p were analysed by qPCR. As shown in Fig. 4A, no significant differences were detected between digits at 6 id and 7.5 id. Furthermore, except for miR‐146c, their expression levels in the digit rays at 7.5 id were significantly lower than those in the interdigital tissue (Fig. 4B).
Figure 4.

Expression levesl of selected miRNAs in the course of digit development and comparative analysis with the interdigital tissue. (A) Chart showing the fold changes in expression in the third digit at 7.5 id (HH32) in comparison with digits at 6 id (HH29; dotted line). (B) Chart showing the fold change expression in the digit ray 3 at 7.5 id (HH32) in comparison with the third interdigit at the same stage (HH32, dotted line). *P‐value > 0.05; **P‐value > 0.01.
To further support the relationship between upregulation of miRNAs and interdigital tissue regression, the expression levels of miR‐451‐5p, miR‐144‐5p, miR‐181a‐5p, miR‐21‐5p, miR‐30a‐5p and miR‐146c‐5p were also analysed in the third interdigit of the duck embryonic limb, which, instead of disappearing, forms a prominent interdigital web. We first characterized the pattern of interdigital cell death in the duck autopod. As shown in Fig. 5, cell death in the third interdigit of the duck limb was more intense than previously thought. To perform the qPCR analysis, we selected three characteristic stages of development: at 8 id, the ‘pre‐apoptosis stage’, digits and interdigits are well defined in the duck autopod, and cell death is absent from the interdigit (Fig. 5A). Between 10.25 id and 10.75 id, the ‘stage of apoptosis’, cell death is widespread in the distal region of the interdigit (Fig. 5B–E) and correlates closely with the elimination of the most distal region of the interdigit (the space between the claws). However, as shown in Fig. 5D, the proximal part of the interdigit still exhibits a considerable level of cell death, despite the fact that this region is not sculpted in the duck. After 11 id, in the ‘post‐apoptosis stage’, the interdigit has its adult appearance and cell death is absent (Fig. 5F). As shown in Fig. 5G, the expression levels of miR‐21, miR‐451, miR‐181a and miR‐30a during these three stages appear to be regulated in a manner consistent with their involvement in the process of cell death. In contrast to those miRNAs, the expression of miR‐144 drops in the post‐apoptosis stage, but was not upregulated in the apoptotic stage. Finally, the expression of miR‐146c increases in the apoptotic stage, but does not drop at the post‐apoptotic stage.
Figure 5.
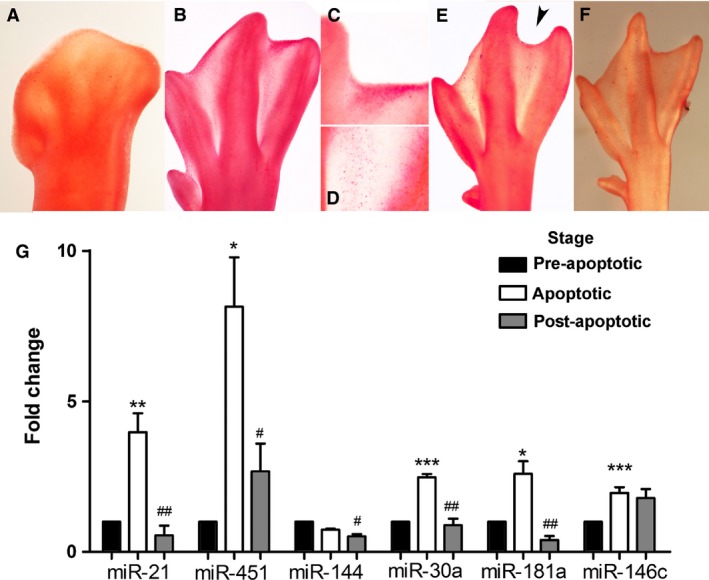
(A–F) Neutral red staining for cell death of embryonic duck limb autopods at (A) 8 id, (B) 10½ id, (E) 10¾ id and (F) 11 id (F). (C and D) Detailed views of the distal (C) and proximal (D) zones of the third interdigit of the autopod shown in (B). Note that interdigital cell death is highest in (B), including not only the distal margin of the interdigit (C) but also the proximal interdigit (D). Note in (E), the notch in the distal margin of the interdigit sculptured by cell death (arrowhead). (G) Expression level of miR‐21, miR‐451, miR‐144, miR‐30a, miR‐181a and miR‐146c in the third interdigit of duck autopods during tissue remodelling. The chart shows quantitative polymerase chain reaction (qPCR)‐evaluated fold changes in the expression of the miRNAs at stages of maximum apoptosis (10.5 id; white columns) and post‐apoptosis (11 id; grey columns) compared with their expression levels prior to the onset of tissue regression (8 id; black columns). Asterisks: P‐values between pre‐apoptosis and apoptotic stages; ***P < 0.001; **P < 0.01; *P < 0.05. Hashtags: significance of differences between post‐apoptotic and apoptotic stages, ###P < 0.001; ##P < 0.01; #P < 0.05.
Altogether, our study provides the miRNA profile associated with a characteristic process of embryonic tissue remodelling supporting the active and redundant participation of miRNAs in programmed cell death and senescence in a fashion similar to that observed in cancer. Studies are now in progress to confirm or discard at the functional level the significance of the distinct miRNAs identified in the present expression analysis.
Author contributions
BGR, CILD, JAM, JAGP, JMH: conceived and designed the experiments; BGR, CILD, JCMLl, JAM, JMH: performed the experiments; BGR, CILD, JCMLl, JAM, JMH: analysed the data; CILD, JAM, JMH: writing of the manuscript.
Conflict of interest
The authors declare no conflict of interest.
Acknowledgements
Thanks are due to Montse Fernandez‐Calderon, Sonia Perez‐Mantecón and Susana Dawalibi for technical assistance. Thanks are also due to Dr J.M. Garcia‐Lobo for help and suggestions to perform next‐generation sequencing. This work was supported by Grants (BFU2011‐24169 and BFU2014‐54026P) from the Spanish Ministry of Economy, Industry and Competitiveness to J.M.H.
Contributor Information
Juan M. Hurle, Email: hurlej@unican.es
Juan A. Montero, Email: monteroja@unican.es.
References
- Ahmed A, Ward NJ, Moxon S, et al. (2015) A database of microRNA expression patterns in Xenopus laevis . PLoS One 10, e0138313. [DOI] [PMC free article] [PubMed] [Google Scholar]
- Bhattacharya M, Sharma AR, Sharma G, et al. (2017) The crucial role and regulations of miRNAs in zebrafish development. Protoplasma 254, 17–31. [DOI] [PubMed] [Google Scholar]
- Brognara E, Fabbri E, Montagner G, et al. (2016) High levels of apoptosis are induced in human glioma cell lines by co‐administration of peptide nucleic acids targeting miR‐221 and miR‐222. Int J Oncol 48, 1029–1038. [DOI] [PubMed] [Google Scholar]
- Carrella S, Barbato S, D'Agostino Y, et al. (2015) TGF‐beta controls miR‐181/ERK regulatory network during retinal axon specification and growth. PLoS One 10, e0144129. [DOI] [PMC free article] [PubMed] [Google Scholar]
- Celli J, van Bokhoven H, Brunner HG (2003) Feingold syndrome: clinical review and genetic mapping. Am J Med Genet A 122A, 294–300. [DOI] [PubMed] [Google Scholar]
- Cimmino A, Calin GA, Fabbri M, et al. (2005) MiR‐15 and miR‐16 induce apoptosis by targeting BCL2. Proc Natl Acad Sci USA 102, 13 944–13 949. [DOI] [PMC free article] [PubMed] [Google Scholar]
- Covarrubias L, Hernandez‐Garcia D, Schnabel D, et al. (2008) Function of reactive oxygen species during animal development: passive or active? Dev Biol 320, 1–11. [DOI] [PubMed] [Google Scholar]
- Diaz‐Mendoza MJ, Lorda‐Diez CI, Montero JA, et al. (2013) Interdigital cell death in the embryonic limb is associated with depletion of Reelin in the extracellular matrix. Cell Death Dis 4, e800. [DOI] [PMC free article] [PubMed] [Google Scholar]
- Du P, Wang L, Sliz P, et al. (2015) A biogenesis step upstream of microprocessor controls miR‐17 approximately 92 expression. Cell 162, 885–899. [DOI] [PMC free article] [PubMed] [Google Scholar]
- Gan S, Huang Z, Liu N, et al. (2016) MicroRNA‐140‐5p impairs zebrafish embryonic bone development via targeting BMP‐2. FEBS Lett 590, 1438–1446. [DOI] [PubMed] [Google Scholar]
- Han X, Yan S, Weijie Z, et al. (2014) Critical role of miR‐10b in transforming growth factor‐beta1‐induced epithelial‐mesenchymal transition in breast cancer. Cancer Gene Ther 21, 60–67. [DOI] [PubMed] [Google Scholar]
- Huang P, Ye B, Yang Y, et al. (2015) MicroRNA‐181 functions as a tumor suppressor in non‐small cell lung cancer (NSCLC) by targeting Bcl‐2. Tumour Biol 36, 3381–3387. [DOI] [PubMed] [Google Scholar]
- Hurle JM, Ojeda JL (1979) Cell death during the development of the truncus and conus of the chick embryo heart. J Anat 129, 427–439. [PMC free article] [PubMed] [Google Scholar]
- Hurle JM, Ros MA, Climent V, et al. (1996) Morphology and significance of programmed cell death in the developing limb bud of the vertebrate embryo. Microsc Res Tech 34, 236–246. [DOI] [PubMed] [Google Scholar]
- Jacobs LA, Bewicke‐Copley F, Poolman MG, et al. (2013) Meta‐analysis using a novel database, miRStress, reveals miRNAs that are frequently associated with the radiation and hypoxia stress‐responses. PLoS One 8, e80844. [DOI] [PMC free article] [PubMed] [Google Scholar]
- Jafarzadeh M, Soltani BM (2016) Hsa‐miR‐590‐5p interaction with SMAD3 transcript supports its regulatory effect on the TGFbeta signaling pathway. Cell J 18, 7–12. [DOI] [PMC free article] [PubMed] [Google Scholar]
- Ji F, Zhang H, Wang Y, et al. (2013) MicroRNA‐133a, downregulated in osteosarcoma, suppresses proliferation and promotes apoptosis by targeting Bcl‐xL and Mcl‐1. Bone 56, 220–226. [DOI] [PubMed] [Google Scholar]
- Joshi P, Jeon YJ, Lagana A, et al. (2015) MicroRNA‐148a reduces tumorigenesis and increases TRAIL‐induced apoptosis in NSCLC. Proc Natl Acad Sci USA 112, 8650–8655. [DOI] [PMC free article] [PubMed] [Google Scholar]
- Krol J, Loedige I, Filipowicz W (2010) The widespread regulation of microRNA biogenesis, function and decay. Nat Rev Genet 11, 597–610. [DOI] [PubMed] [Google Scholar]
- Lan SH, Wu SY, Zuchini R, et al. (2014) Autophagy suppresses tumorigenesis of hepatitis B virus‐associated hepatocellular carcinoma through degradation of microRNA‐224. Hepatology 59, 505–517. [DOI] [PMC free article] [PubMed] [Google Scholar]
- Lee SI, Lee BR, Hwang YS, et al. (2011) MicroRNA‐mediated posttranscriptional regulation is required for maintaining undifferentiated properties of blastoderm and primordial germ cells in chickens. Proc Natl Acad Sci USA 108, 10 426–10 431. [DOI] [PMC free article] [PubMed] [Google Scholar]
- Li Q, Zhang D, Wang Y, et al. (2013) MiR‐21/Smad 7 signaling determines TGF‐beta1‐induced CAF formation. Sci Rep 3, 2038. [DOI] [PMC free article] [PubMed] [Google Scholar]
- Li M, Guan X, Sun Y, et al. (2014) MiR‐92a family and their target genes in tumorigenesis and metastasis. Exp Cell Res 323, 1–6. [DOI] [PubMed] [Google Scholar]
- Li XH, Ha CT, Xiao M (2016) MicroRNA‐30 inhibits antiapoptotic factor Mcl‐1 in mouse and human hematopoietic cells after radiation exposure. Apoptosis 21, 708–720. [DOI] [PMC free article] [PubMed] [Google Scholar]
- Lin YC, Balakrishnan CN, Clayton DF (2014) Functional genomic analysis and neuroanatomical localization of miR‐2954, a song‐responsive sex‐linked microRNA in the zebra finch. Front Neurosci 8, 409. [DOI] [PMC free article] [PubMed] [Google Scholar]
- Liu L, Yu X, Guo X, et al. (2012) MiR‐143 is downregulated in cervical cancer and promotes apoptosis and inhibits tumor formation by targeting Bcl‐2. Mol Med Rep 5, 753–760. [DOI] [PubMed] [Google Scholar]
- Liu XY, He YJ, Yang QH, et al. (2015) Induction of autophagy and apoptosis by miR‐148a through the sonic hedgehog signaling pathway in hepatic stellate cells. Am J Cancer Res 5, 2569–2589. [PMC free article] [PubMed] [Google Scholar]
- Livak KJ, Schmittgen TD (2001) Analysis of relative gene expression data using real‐time quantitative PCR and the 2(−Delta Delta C(T)) Method. Methods 25, 402–408. [DOI] [PubMed] [Google Scholar]
- Lopez‐Sanchez C, Franco D, Bonet F, et al. (2015) Negative Fgf8‐Bmp2 feed‐back is regulated by miR‐130 during early cardiac specification. Dev Biol 406, 63–73. [DOI] [PubMed] [Google Scholar]
- Lorda‐Diez CI, Garcia‐Riart B, Montero JA, et al. (2015a) Apoptosis during embryonic tissue remodeling is accompanied by cell senescence. Aging (Albany NY) 7, 974–985. [DOI] [PMC free article] [PubMed] [Google Scholar]
- Lorda‐Diez CI, Montero JA, Garcia‐Porrero JA, et al. (2015b) Interdigital tissue regression in the developing limb of vertebrates. Int J Dev Biol 59, 55–62. [DOI] [PubMed] [Google Scholar]
- Magenta A, Dellambra E, Ciarapica R, et al. (2016) Oxidative stress, microRNAs and cytosolic calcium homeostasis. Cell Calcium 60, 207–217. [DOI] [PubMed] [Google Scholar]
- Mikhed Y, Gorlach A, Knaus UG, et al. (2015) Redox regulation of genome stability by effects on gene expression, epigenetic pathways and DNA damage/repair. Redox Biol 5, 275–289. [DOI] [PMC free article] [PubMed] [Google Scholar]
- Montero JA, Sanchez‐Fernandez C, Lorda‐Diez CI, et al. (2016) DNA damage precedes apoptosis during the regression of the interdigital tissue in vertebrate embryos. Sci Rep 6, 35 478. [DOI] [PMC free article] [PubMed] [Google Scholar]
- Moreno‐Mateos MA, Barragan V, Torres B, et al. (2013) Novel small RNA expression libraries uncover Hsa‐miR‐30b and Hsa‐miR‐30c as important factors in anoikis resistance. RNA 19, 1711–1725. [DOI] [PMC free article] [PubMed] [Google Scholar]
- Olivieri F, Albertini MC, Orciani M, et al. (2015) DNA damage response (DDR) and senescence: shuttled inflamma‐miRNAs on the stage of inflamm‐aging. Oncotarget 6, 35 509–35 521. [DOI] [PMC free article] [PubMed] [Google Scholar]
- Ouyang YB, Lu Y, Yue S, et al. (2012) MiR‐181 targets multiple Bcl‐2 family members and influences apoptosis and mitochondrial function in astrocytes. Mitochondrion 12, 213–219. [DOI] [PMC free article] [PubMed] [Google Scholar]
- Pan X, Wang R, Wang ZX (2013) The potential role of miR‐451 in cancer diagnosis, prognosis, and therapy. Mol Cancer Ther 12, 1153–1162. [DOI] [PubMed] [Google Scholar]
- Pan L, Huang BJ, Ma XE, et al. (2015) MiR‐25 protects cardiomyocytes against oxidative damage by targeting the mitochondrial calcium uniporter. Int J Mol Sci 16, 5420–5433. [DOI] [PMC free article] [PubMed] [Google Scholar]
- Parchem RJ, Moore N, Fish JL, et al. (2015) MiR‐302 is required for timing of neural differentiation, neural tube closure, and embryonic viability. Cell Rep 12, 760–773. [DOI] [PMC free article] [PubMed] [Google Scholar]
- Penzkofer D, Bonauer A, Fischer A, et al. (2014) Phenotypic characterization of miR‐92a‐/‐ mice reveals an important function of miR‐92a in skeletal development. PLoS One 9, e101153. [DOI] [PMC free article] [PubMed] [Google Scholar]
- de Pontual L, Yao E, Callier P, et al. (2011) Germline deletion of the miR‐17 approximately 92 cluster causes skeletal and growth defects in humans. Nat Genet 43, 1026–1030. [DOI] [PMC free article] [PubMed] [Google Scholar]
- Roy S, Benz F, Vargas Cardenas D, et al. (2015) MiR‐30c and miR‐193 are a part of the TGF‐beta‐dependent regulatory network controlling extracellular matrix genes in liver fibrosis. J Dig Dis 16, 513–524. [DOI] [PubMed] [Google Scholar]
- Soares AR, Reverendo M, Pereira PM, et al. (2012) Dre‐miR‐2188 targets Nrp2a and mediates proper intersegmental vessel development in zebrafish embryos. PLoS One 7, e39417. [DOI] [PMC free article] [PubMed] [Google Scholar]
- Su Z, Yang Z, Xu Y, et al. (2015) MicroRNAs in apoptosis, autophagy and necroptosis. Oncotarget 6, 8474–8490. [DOI] [PMC free article] [PubMed] [Google Scholar]
- Sun T, Li W, Ling S (2016) MiR‐30c and semaphorin 3A determine adult neurogenesis by regulating proliferation and differentiation of stem cells in the subventricular zones of mouse. Cell Prolif 49, 270–280. [DOI] [PMC free article] [PubMed] [Google Scholar]
- Tsang WP, Kwok TT (2008) Let‐7a microRNA suppresses therapeutics‐induced cancer cell death by targeting caspase‐3. Apoptosis 13, 1215–1222. [DOI] [PubMed] [Google Scholar]
- Wang P, Zhuang L, Zhang J, et al. (2013) The serum miR‐21 level serves as a predictor for the chemosensitivity of advanced pancreatic cancer, and miR‐21 expression confers chemoresistance by targeting FasL. Mol Oncol 7, 334–345. [DOI] [PMC free article] [PubMed] [Google Scholar]
- Wang X, Ling CC, Li L, et al. (2016) MicroRNA‐10a/10b represses a novel target gene mib1 to regulate angiogenesis. Cardiovasc Res 110, 140–150. [DOI] [PubMed] [Google Scholar]
- Xia M, Li H, Wang JJ, et al. (2016) MiR‐99a suppress proliferation, migration and invasion through regulating insulin‐like growth factor 1 receptor in breast cancer. Eur Rev Med Pharmacol Sci 20, 1755–1763. [PubMed] [Google Scholar]
- Yan J, Guo D, Yang S, et al. (2016) Inhibition of miR‐222‐3p activity promoted osteogenic differentiation of hBMSCs by regulating Smad5‐RUNX2 signal axis. Biochem Biophys Res Commun 470, 498–503. [DOI] [PubMed] [Google Scholar]
- Yang SL, Yang M, Herrlinger S, et al. (2015) MiR‐302/367 regulate neural progenitor proliferation, differentiation timing, and survival in neurulation. Dev Biol 408, 140–150. [DOI] [PMC free article] [PubMed] [Google Scholar]
- Ye Z, Zhao L, Li J, et al. (2015) MiR‐30d blocked transforming growth factor beta1‐induced epithelial‐mesenchymal transition by targeting snail in ovarian cancer cells. Int J Gynecol Cancer 25, 1574–1581. [DOI] [PubMed] [Google Scholar]
- Yu L, Gong X, Sun L, et al. (2015) MiR‐454 functions as an oncogene by inhibiting CHD5 in hepatocellular carcinoma. Oncotarget 6, 39 225–39 234. [DOI] [PMC free article] [PubMed] [Google Scholar]
- Zhang W, Li Y (2016) MiR‐148a downregulates the expression of transforming growth factor‐beta2 and SMAD2 in gastric cancer. Int J Oncol 48, 1877–1885. [DOI] [PMC free article] [PubMed] [Google Scholar]
- Zhang Y, Xie RL, Gordon J, et al. (2012) Control of mesenchymal lineage progression by microRNAs targeting skeletal gene regulators Trps1 and Runx2. J Biol Chem 287, 21 926–21 935. [DOI] [PMC free article] [PubMed] [Google Scholar]
- Zhang H, Zhang X, Yuan X, et al. (2015) MicroRNA‐205 inhibits renal cells apoptosis via targeting CMTM4. Iran J Basic Med Sci 18, 1020–1026. [PMC free article] [PubMed] [Google Scholar]
- Zhou M, Liu Z, Zhao Y, et al. (2010) MicroRNA‐125b confers the resistance of breast cancer cells to paclitaxel through suppression of pro‐apoptotic Bcl‐2 antagonist killer 1 (Bak1) expression. J Biol Chem 285, 21 496–21 507. [DOI] [PMC free article] [PubMed] [Google Scholar]
- Zhou X, Wang J, Sun H, et al. (2016) MicroRNA‐99a regulates early chondrogenic differentiation of rat mesenchymal stem cells by targeting the BMPR2 gene. Cell Tissue Res 366, 143–153. [DOI] [PubMed] [Google Scholar]