

Abstract
Background and Purpose
Previous studies indicate that prostaglandin EP2 receptors selectively couple to AC2 in non‐lipid raft domains of airway smooth muscle (ASM) cells, where they regulate specific cAMP‐dependent responses. The goal of the present study was to identify the cellular microdomains where EP2 receptors stimulate cAMP production.
Experimental Approach
FRET‐based cAMP biosensors were targeted to different subcellular locations of primary human ASM cells. The Epac2‐camps biosensor, which expresses throughout the cell, was used to measure bulk cytoplasmic responses. Epac2‐MyrPalm and Epac2‐CAAX were used to measure responses associated with lipid raft and non‐raft regions of the plasma membrane respectively. Epac2‐NLS was used to monitor responses at the nucleus.
Key Results
Activation of AC with forskolin or β2‐adrenoceptors with isoprenaline increased cAMP in all subcellular locations. Activation of EP2 receptors with butaprost produced cAMP responses that were most readily detected by the non‐raft and nuclear sensors, but only weakly detected by the cytosolic sensor and not detected at all by the lipid raft sensor. Exposure to rolipram, a PDE4 inhibitor, unmasked the ability of EP2 receptors to increase cAMP levels associated with lipid raft domains. Overexpression of AC2 selectively increased EP2 receptor‐stimulated production of cAMP in non‐raft membrane domains.
Conclusions and Implications
EP2 receptor activation of AC2 leads to cAMP production in non‐raft and nuclear compartments of human ASMs, while β2 adrenoceptor signalling is broadly detected across microdomains. The activity of PDE4 appears to play a role in maintaining the integrity of compartmentalized EP2 receptor responses in these cells.
Abbreviations
- AKAP
A kinase‐anchoring protein
- ASM
airway smooth muscle
- CREB
cAMP response element binding protein
- ECFP
enhanced cyan fluorescent protein
- Epac2‐camps
exchange protein activated by cAMP type 2 based cAMP biosensor
- Epac2‐CAAX
Epac2‐camps biosensor with a prenylation targeting sequence
- Epac2‐MyrPalm
Epac2‐camps biosensor with an acylation targeting sequence
- Epac2‐NLS
Epac2‐camps biosensor with a nuclear localization signal
- EYFP
enhanced yellow fluorescent protein
- FRET
fluorescence resonance energy transfer
Introduction
Stimulation of cAMP production regulates bronchomotor tone by causing relaxation of airway smooth muscle (ASM) cells (Pelaia et al., 2008; Noble et al., 2014). Furthermore, disruption of cAMP signalling is believed to contribute to hyper‐responsiveness to contractile stimuli, resulting in respiratory problems associated with asthma and chronic obstructive pulmonary disease (Pelaia et al., 2008). However, cAMP regulates a number of other important cellular activities, including carbohydrate and lipid metabolism, gene expression as well as cell growth and proliferation (Billington et al., 2013). In human ASM cells, cAMP production is linked to the activation of β2‐adrenoceptors as well as prostaglandin EP2 receptors (Bogard et al., 2011). However, these receptors do not all produce the same cAMP‐dependent responses. For example, only β2‐adrenoceptor activation leads to enhanced arborization (Bogard et al., 2012), a cell shape change that reflects cytoskeletal reorganization (Gros et al., 2006), while only EP2 receptor activation increases expression of the cytokine IL‐6 (Bogard et al., 2014). This raises the question as to how a cell is able to discriminate between cAMP signals that are produced by these two types of receptors.
The current hypothesis is that β2 adrenoceptors and EP2 receptors produce cAMP in different subcellular compartments. This is supported by the fact that these receptors are found in different membrane domains (Ostrom et al., 2001). The plasma membrane of most cells contains cholesterol‐ and sphingomyelin‐rich areas referred to as lipid rafts. In ASM cells, β2 adrenoceptors are found in lipid raft fractions associated specifically with caveolins, which are membrane‐bound scaffolding proteins that can contribute to the formation of caveolae. EP2 receptors, in contrast, are excluded from lipid raft fractions of the plasma membrane. Previous studies also indicate that different cAMP‐dependent responses are associated with specific isoforms of adenylyl cyclase (AC). ASM cells express multiple AC isoforms, including AC2 as well as AC6 (Xu et al., 2001; Bogard et al., 2011). Furthermore, AC6 is found specifically in lipid raft fractions of the plasma membrane, while AC2 is excluded from these domains. In addition, overexpression of AC6 enhances β2‐adrenoceptor production of cAMP and cAMP‐dependent arborization in ASM cells (Bogard et al., 2012), whereas overexpression of AC2 enhances EP2 receptor production of cAMP as well as cAMP‐dependent expression of IL‐6 (Bogard et al., 2014).
The evidence described above is consistent with the idea that receptor‐dependent production of cAMP is spatially restricted to subcellular locations associated with different membrane microdomains. They also show that distinct AC isoforms exist in these separate domains and couple specifically to co‐localized receptors. The purpose of this study was to directly test this hypothesis by measuring cAMP activity in live, primary human ASM cells using the genetically encoded fluorescence resonance energy transfer (FRET)‐based biosensor Epac2‐camps targeted to different subcellular locations. Epac2‐camps consists of a cAMP‐binding domain from the type 2 exchange protein activated by cAMP, to which enhanced yellow fluorescent protein (EYFP) has been added to the N‐terminus and enhanced cyan fluorescent protein (ECFP) to the C‐terminus. Binding of cAMP causes a conformational change resulting in a loss of energy transfer between the two fluorophores that can be detected as an increase in the ECFP/EYFP fluorescence ratio. Epac2‐camps itself is a probe that lacks any targeting sequences and was used to measure cAMP responses in the bulk cytoplasmic compartment of the cell (Nikolaev et al., 2004). Addition of either an acylation (Epac2‐MyrPalm) or prenylation (Epac2‐CAAX) sequence was used to target the probe to lipid raft and non‐lipid raft domains of the plasma membrane, so that we could measure cAMP responses associated with those subcellular locations (Agarwal et al., 2014). We also measured responses using Epac2‐NLS, which is targeted to the nucleus of the cell (DiPilato et al., 2004).
Our results demonstrate that stimulation of β2‐adrenoceptors and EP2 receptors results in the production of cAMP in distinctly different subcellular locations in primary human ASM cells. While β2‐adrenoceptors produce cAMP that is detected uniformly throughout all sites examined, EP2 receptors have the greatest effect on cAMP production in subcellular locations associated with non‐lipid raft domains of the plasma membrane as well as the nucleus.
Methods
Cell culture
Human ASM cells were provided by Dr Raymond Penn (Thomas Jefferson University). Cells were derived from human tracheae and primary bronchi as previously described and used between passage 6 and 9 (Yan et al., 2011). Experiments were conducted using multiple samples of primary cells derived from different patients. Cells were maintained in Ham's F12 nutrient mixture supplemented with 10% FBS, 100 U mL−1 penicillin, 100 μg·mL−1 streptomycin. For FRET and confocal microscopy experiments, cells were plated on 35 mm glass‐bottom fluorodishes (World Precision Instruments, Inc., Sarasota, FL, USA). Cells were transduced with adenovirus constructs containing Epac2‐based cAMP biosensors for 48 h. For AC overexpression experiments, adenoviral constructs expressing AC2 were used to transduce cells; a viral titre previously shown to produce >90% transduction was used (Bogard et al., 2011). All experiments were conducted at room temperature.
FRET biosensor construction
The Epac2‐camps, Epac2‐MyrPalm, and Epac2‐CAAX biosensors used in the present study have been characterized previously (Nikolaev et al., 2004; Agarwal et al., 2014). For nuclear targeting, a nuclear localization signal (NLS), PKKKRKVEDA, was added to the C‐terminus of the Epac2‐camps probe (DiPilato et al., 2004). In vitro calibration of Epac2‐NLS (Supporting Information Figure S1) was performed as described previously (Agarwal et al., 2014). The EC50 and Hill coefficient for cAMP activation of each of the probes used in this study are listed in Supporting Information Table S1.
FRET microscopy
Live cell imaging experiments were conducted using human ASM cells bathed in the following solution (in mM): NaCl 137, KCl 5.4, MgCl2 0.5, CaCl2 1.0, NaH2PO4 0.33, glucose 5.5 and HEPES 5 (pH 7.4). A plastic insert (Warner Instruments, LLC, Hamden, CT, USA) was used to reduce the total fluid volume of the fluorodish to ~200 μL, and drug‐containing solutions were introduced using a gravity‐fed perfusion system at a rate of ~1 mL·min−1. FRET imaging was conducted using an Olympus IX71 inverted microscope equipped with an Hamamatsu OrcaD2 dual chip CCD camera and HCImage data acquisition and analysis software (Hamamatsu Corporation, Bridgewater, NJ, USA), as described previously (Agarwal et al., 2014). Changes in cAMP activity were defined as the change in background and bleed‐through corrected ECFP/EYFP fluorescence intensity ratio (ΔR) relative to the baseline ratio (R0) measured in a specified region of interest (ROI). FRET ratios were measured once every 10 s. A control period of at least 5 min was recorded before the application of any drug in order to allow the baseline to stabilize. Responses were calculated relative to the average baseline ratio measured over the 30 s period immediately preceding the application of drugs.
To control for variations in the absolute size of responses, we normalized these values to the magnitude of the maximal probe response observed in the same cell following exposure to saturating concentrations of the non‐specific PDE inhibitor IBMX plus the direct AC activator forskolin or the β adrenoceptor agonist isoprenaline. For Epac2‐camps, Epac2‐MyrPalm and Epac2‐CAAX, FRET responses were measured using a circular ROI approximately 5 μm in diameter placed over a cytoplasmic region of the cell, being sure to avoid the nucleus. Consistent with the results of Billington et al. (2008), the data obtained using ROIs placed at different locations did not affect the results. For cells expressing Epac2‐NLS, the ROI was drawn around the entire nucleus.
Confocal microscopy
Confocal imaging was performed using an Olympus Fluoview 1000 confocal microscope with an oil immersion objective (60×, 1.42 NA). The confocal aperture was fixed at 1 Airy unit. Images were captured at 1024 × 1024 pixels with a 20 μs per pixel dwell time and 2× zoom in raster scan mode using a laser power of 5–10%. EYFP in cells expressing the different biosensors was excited using the 515 nm line of an argon laser, and the fluorescence images were captured using a BA535‐565 emission filter. Images were stored in tiff file format. The brightness and contrast of these images were adjusted in ImageJ software for presentation purposes.
Statistics
All data are expressed as the mean ± SEM of the indicated number of experiments conducted using individual cells (n). Statistical significance (P < 0.05) was determined by Student's t‐test or one‐way ANOVA with Holm‐Sidak post hoc analysis to identify significant outliers, where appropriate, using SigmaPlot (Systat Software, Inc., San Jose, CA, USA). The data and statistical analysis comply with the recommendations on experimental design and analysis in pharmacology (Curtis et al., 2015).
Materials
Rolipram was obtained from Tocris Bioscience (Bristol, UK). Ham's F12 medium, penicillin, streptomycin, and FBS were purchased from Life Technologies (Carlsbad, CA, USA). All other reagents were purchased from Sigma‐Aldrich (St. Louis, MO, USA). Isoprenaline and IBMX‐containing solutions were prepared fresh daily. Forskolin and butaprost‐containing solutions were prepared from frozen aliquots.
Nomenclature of targets and ligands
Key protein targets and ligands in this article are hyperlinked to corresponding entries in http://www.guidetopharmacology.org, the common portal for data from the IUPHAR/BPS Guide to PHARMACOLOGY (Southan et al., 2016), and are permanently archived in the Concise Guide to PHARMACOLOGY 2015/16 (Alexander et al., 2015a,b).
Results
In order to monitor changes in cAMP levels associated with specific subcellular locations, we employed genetically encoded Epac2‐based biosensors with or without different targeting sequences (DiPilato et al., 2004; Agarwal et al., 2014). When expressed in human ASM cells, we observed distinct patterns of expression for each of these probes (Figure 1A). As expected, Epac2‐camps, the probe without any targeting sequence, exhibited diffuse fluorescence throughout the cytosol. Epac2‐MyrPalm and Epac2‐CAAX, which are targeted to lipid raft and non‐raft membrane domains, respectively (Zacharias et al., 2002; Agarwal et al., 2014), were found primarily in the plasma membrane. However, these two probes exhibited distinctly different expression patterns. Wide‐field images of Epac2‐MyrPalm‐expressing cells revealed that this probe is expressed uniformly throughout the surface membrane of these cells. However, the Epac2‐CAAX probe appears to be concentrated more around the nucleus, suggesting an association between non‐raft domains of the plasma membrane and the perinuclear space (Figure 1B, left‐hand panels). In cells expressing Epac2‐NLS, a highly localized nuclear fluorescence pattern was distinctly visible. These results indicate that each of our cAMP biosensors is targeted to a distinctly different subcellular location.
Figure 1.
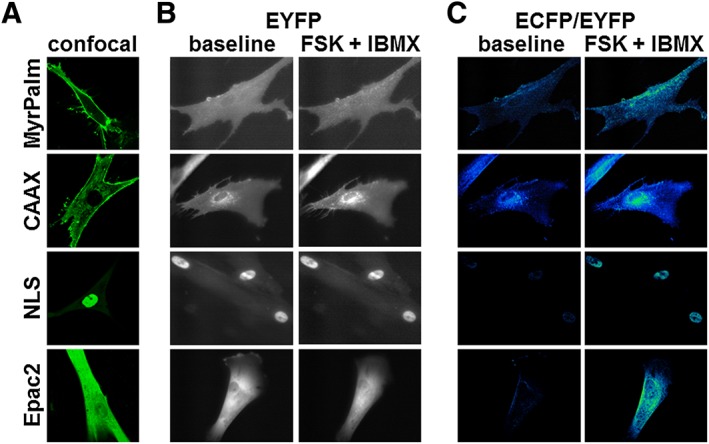
Expression pattern of Epac2‐based biosensors targeted to different subcellular locations. (A) Representative confocal images of human ASM cells expressing Epac2‐MyrPalm (MyrPalm, n = 27), Epac2‐CAAX (CAAX, n = 68), Epac2‐NLS (NLS, n = 25) and Epac2‐camps (Epac2, n = 18). (B) Representative wide‐field images (EYFP fluorescence) before (left) and after (right) stimulation of cAMP production by exposure to the AC activator forskolin (FSK, 10 μM) plus the PDE inhibitor IBMX (100 μM). Note that there is no obvious change in distribution of biosensor following stimulation of cAMP production. (C) Corresponding pseudocolour images depicting the change in ECFP/EYFP fluorescence intensity ratio before (left) and after (right) exposure to FSK plus IBMX. MyrPalm (n = 6), CAAX (n = 6), NLS (n = 9) and Epac2 (n = 8).
Next, we conducted experiments to verify that these probes were able to respond to changes in cAMP levels. Exposure to forskolin (10 μM), to directly activate AC activity, in combination with IBMX (100 μM), a non‐specific inhibitor of PDE activity, was used to produce a saturating cAMP response. Comparing the left and right hand panels of Figure 1B, we found no obvious change in the distribution pattern of the probes following stimulation. However, the change in activity was readily detectible as a change in the ECFP/EYFP fluorescence ratio illustrated as pseudocolour images in Figure 1C. Interestingly, the time course experiments illustrated in Figure 2 demonstrate that exposure to 100 μM IBMX alone, a concentration that should maximally inhibit most PDE isoforms, produced responses that were only 16 to 26% of that observed following maximal activation of each probe upon subsequent addition of 10 μM forskolin. These results suggest that under basal conditions, total PDE activity is similar in all four locations. They also suggest that basal AC activity in these locations is low. Consistent with this conclusion, exposure to 100 μM MDL‐12,330A, an AC inhibitor, did not produce a significant decrease in the baseline FRET responses detected by any of our probes (see Supporting Information Figure S2). This suggests that basal levels of cAMP are below the threshold for detection by our probes (Agarwal et al., 2014).
Figure 2.
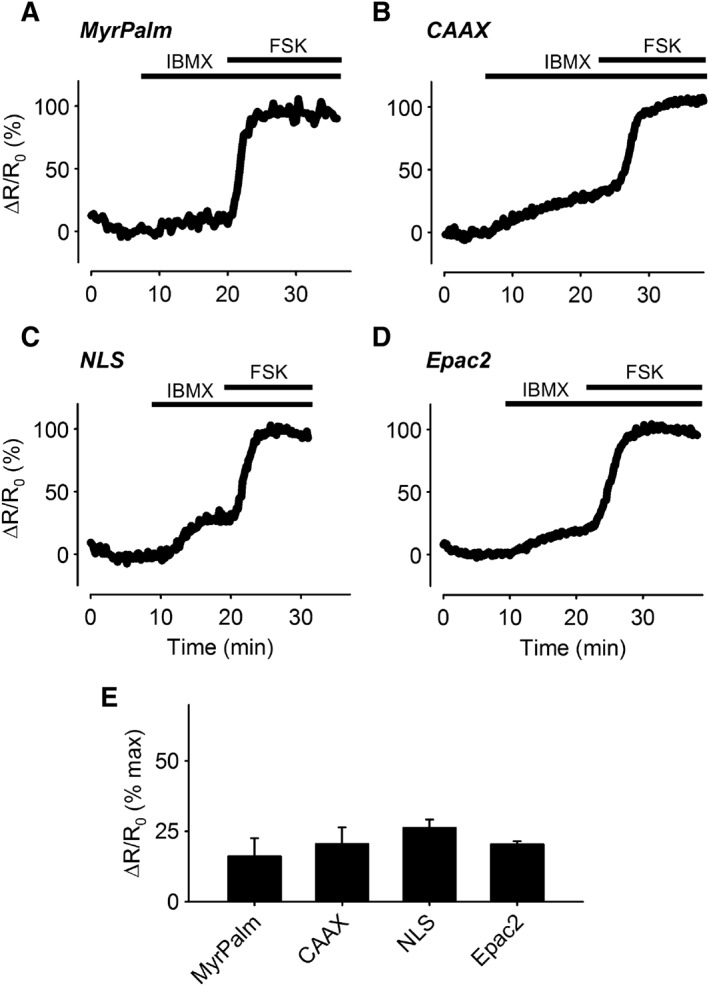
Changes in cAMP responses in different subcellular domains following PDE inhibition. (A–D) Representative time course of changes in the magnitude of the normalized FRET response (ΔR/R0) in human ASM cells expressing Epac2‐MyrPalm (MyrPalm), Epac2‐CAAX (CAAX), Epac2‐NLS (NLS) and Epac2‐camps (Epac2), under control conditions, following exposure to 100 μM IBMX, and IBMX plus 10 μM forskolin (FSK). (E) Size of average FRET response to 100 μM IBMX alone normalized to the magnitude of the maximal response measured in the presence of IBMX plus FSK. There was no statistical difference (one‐way ANOVA) in the size of the responses detected by MyrPalm (n = 6), CAAX (n = 6), NLS (n = 9) and Epac2 (n = 8).
To determine if there are differences in the relative amount of AC activity capable of contributing to cAMP production in different subcellular locations upon stimulation, we examined the concentration dependence of the responses to forskolin (Figure 3). While all four probes responded to forskolin in a concentration‐dependent manner, there were differences in the apparent sensitivity. Exposure to 0.1 μM forskolin produced responses that could be detected by every probe except Epac2‐MyrPalm. Exposure to 0.3 μM forskolin produced responses that could be detected by all four probes, although Epac2‐CAAX and Epac2‐NLS appeared to be the most sensitive. Exposure to 10 μM forskolin produced responses that resulted in saturation or near saturation of all four probes. These results indicate that even though basal AC activity appears to be low, agonist‐stimulated AC activity is quite significant. However, there appear to be some differences in the relative amount of AC activity contributing to cAMP production in different subcellular locations.
Figure 3.
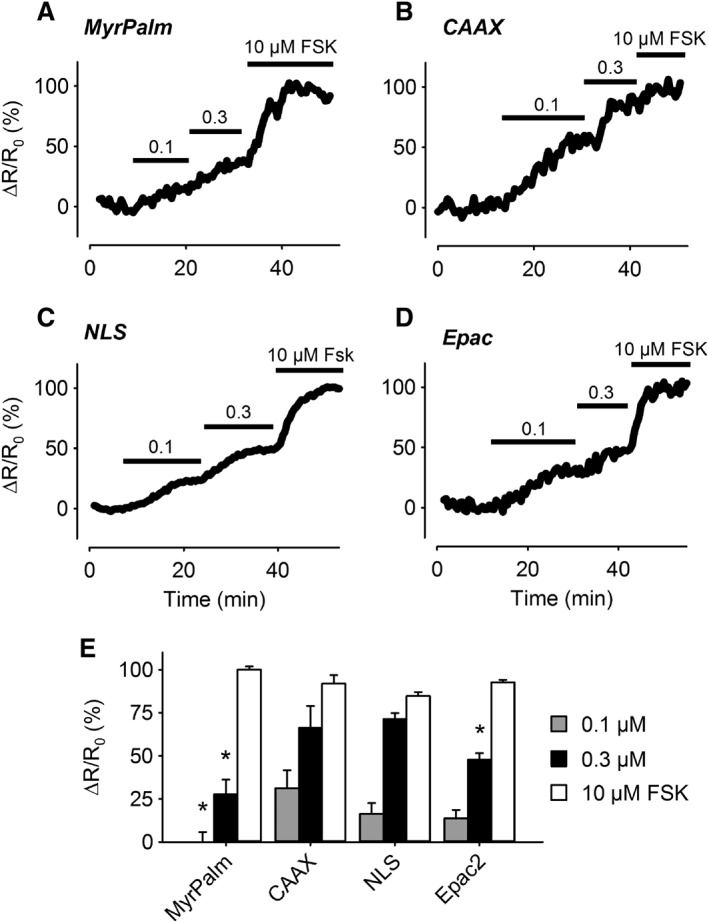
Changes in cAMP responses in different subcellular domains following AC activation. (A–D) Representative time course of changes in the magnitude of the normalized FRET response (ΔR/R0) in cells expressing Epac2‐MyrPalm (MyrPalm), Epac2‐CAAX (CAAX), Epac2‐NLS (NLS), and Epac2‐camps (Epac2), under control conditions, and following exposure to 0.1, 0.3 and 10 μM forskolin (FSK). (E) Size of average FRET responses to FSK. The 0.1 μM FSK response detected by MyrPalm (n = 6) was significantly smaller than that detected by CAAX (n = 6), but not NLS (n = 6) and Epac2 (n = 8). The 0.3 μM FSK responses detected by MyrPalm (n = 6) and Epac2 (n = 7) were significantly smaller than those detected by CAAX (n = 6) and NLS (n = 14). The 10 μM FSK responses detected by CAAX (n = 5), MyrPalm (n = 6), NLS (n = 13) and Epac2 (n = 6) were not significantly different from one another. Statistical significance was tested using one‐way ANOVA followed by Holm‐Sidak method for pairwise multiple comparisons. All responses were normalized to the maximal responses elicited by 10 μM FSK plus 100 μM IBMX.
We next compared responses to GPCR activation. Exposure to the β adrenoceptor agonist isoprenaline produced concentration‐dependent increases in cAMP activity throughout the cell (Figure 4), without any apparent differences in the sensitivity of the responses detected by each of the probes. Exposure to 1 nM isoprenaline produced responses that were 22 to 42% of maximal, while 3 nM isoprenaline produced responses that were between 55 and 82% of maximal. Exposure to a maximally stimulating concentration of isoprenaline (1 μM) produced responses that were approximately the same size as those observed in the presence of 1 μM isoprenaline plus 100 μM IBMX. These results suggest that β2‐adrenoceptor stimulation produces cAMP levels that are roughly equal throughout human ASM cells.
Figure 4.
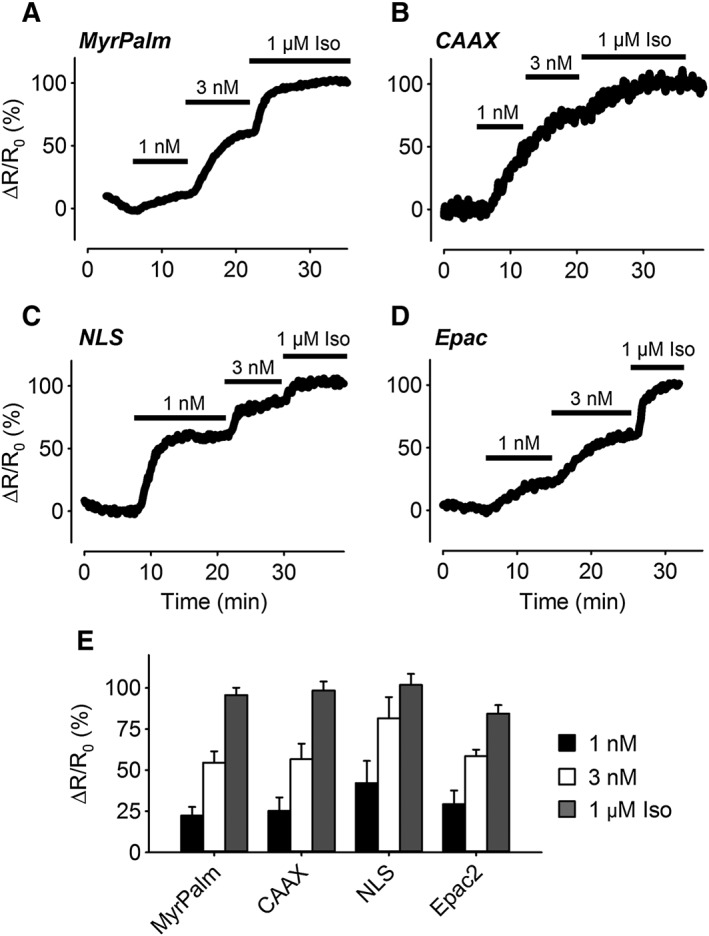
Changes in cAMP responses in different subcellular domains following β‐adrenoceptor stimulation. (A–D) Representative time course of changes in the magnitude of the normalized FRET response (ΔR/R0) in cells expressing Epac2‐MyrPalm (MyrPalm), Epac2‐CAAX (CAAX), Epac2‐NLS (NLS) and Epac2‐camps (Epac), under control conditions, and following exposure to 1 nM, 3 nM and 1 μM isoprenaline (Iso). (E) Size of average FRET responses to Iso; 1 nM Iso: MyrPalm, (n = 13); CAAX (n = 9); NLS (n = 7) and Epac2 (n = 7). Iso 3 nM: MyrPalm, (n = 13), CAAX (n = 9); NLS (n = 7) and Epac2 (n = 7). Iso 1 μM: MyrPalm, (n = 18); CAAX (n = 19); NLS (n = 15) and Epac2 (n = 11). There were no significant differences (one‐way ANOVA) in the size of the responses to any given concentration of Iso. All responses were normalized to the maximal responses elicited by 1 μM Iso plus 100 μM IBMX.
Contrary to the effects of β2‐adrenoceptor stimulation, exposure to the EP2 receptor agonist butaprost produced a significantly different pattern of responses (Figure 5). Exposure to 0.3 and 1 μM butaprost produced concentration‐dependent increases in cAMP activity detected by the Epac2‐CAAX and Epac2‐NLS biosensors. In sharp contrast, the cytosolic biosensor Epac2‐camps responded to 1 μM but not 0.3 μM butaprost, and the lipid raft‐targeted probe Epac2‐MyrPalm did not respond to either concentration of butaprost. These results suggest that EP2 receptor stimulation elicits a localized increase in cAMP activity in subcellular locations associated with non‐raft regions of the plasma membrane. Furthermore, while the cAMP produced by these receptors is unable to reach the subcellular locations associated with lipid rafts, it is readily able to reach the nucleus.
Figure 5.
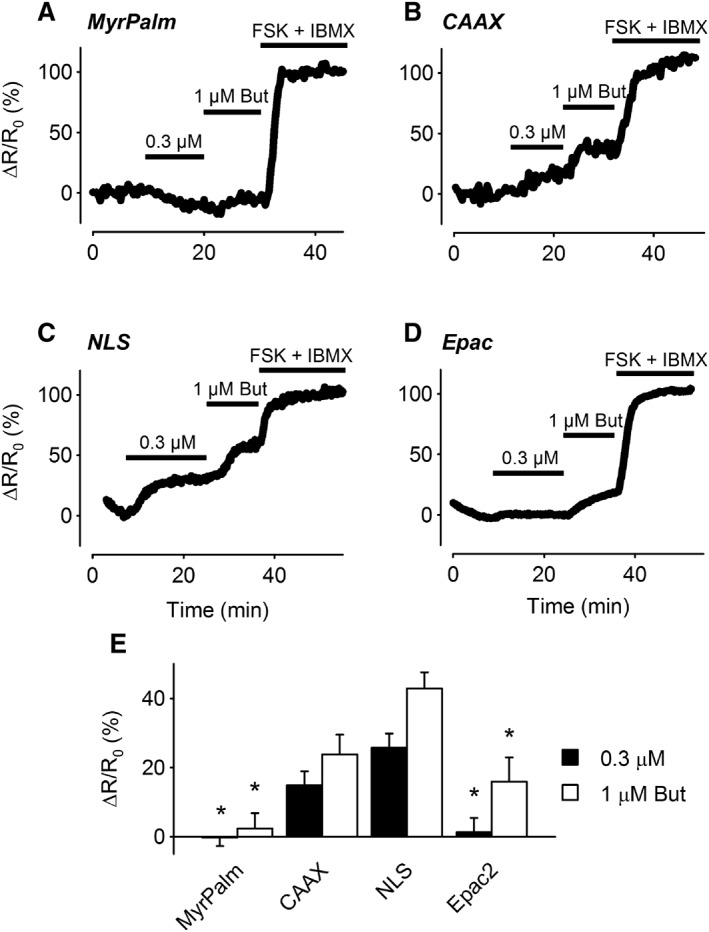
Changes in cAMP responses in different subcellular domains following EP2 receptor stimulation. (A–D) Representative time course of changes in the magnitude of the normalized FRET response (ΔR/R0) in cells expressing Epac2‐MyrPalm (MyrPalm), Epac2‐CAAX (CAAX), Epac2‐NLS (NLS) and Epac2‐camps (Epac2), under control conditions, and following exposure to 0.3 and 1 μM butaprost (But). (E) Size of average FRET responses to butaprost. The responses to 0.3 μM butaprost detected by MyrPalm (n = 11) and Epac2 (n = 8) were significantly smaller than those detected by CAAX (n = 12) and NLS (n = 7). The response to 1 μM butaprost detected by MyrPalm (n = 11) was significantly smaller than the responses detected by CAAX (n = 10), NLS (n = 7) and Epac2 (n = 8). The Epac2 response was also significantly smaller than the NLS response. Statistical significance was tested using one‐way ANOVA followed by Holm‐Sidak method for pairwise multiple comparisons. All responses were normalized to the maximal responses elicited by 10 μM FSK plus 100 μM IBMX.
It has previously been shown that inhibition of PDE4 enables EP2 receptor stimulation to cause arborization of ASM cells (Bogard et al., 2012). This suggests that PDE4 is involved in limiting the spread of cAMP produced by EP2 receptors. To test this hypothesis, we examined the effect of the selective PDE4 inhibitor rolipram on the cAMP responses produced by butaprost (Figure 6). Exposure to 10 μM rolipram alone had no significant effect on cAMP activity detected by any of the probes. However, the presence of rolipram did alter the response to 1 μM butaprost, eliminating any significant difference in the magnitude of the responses detected by any of the probes. Most notable was the fact that the Epac2‐MyrPalm probe was able to detect a change in cAMP activity following exposure to 1 μM butaprost. This is in contrast to the absence of any change in cAMP activity detected by this probe when butaprost was applied in the absence of rolipram (see Figure 5).
Figure 6.
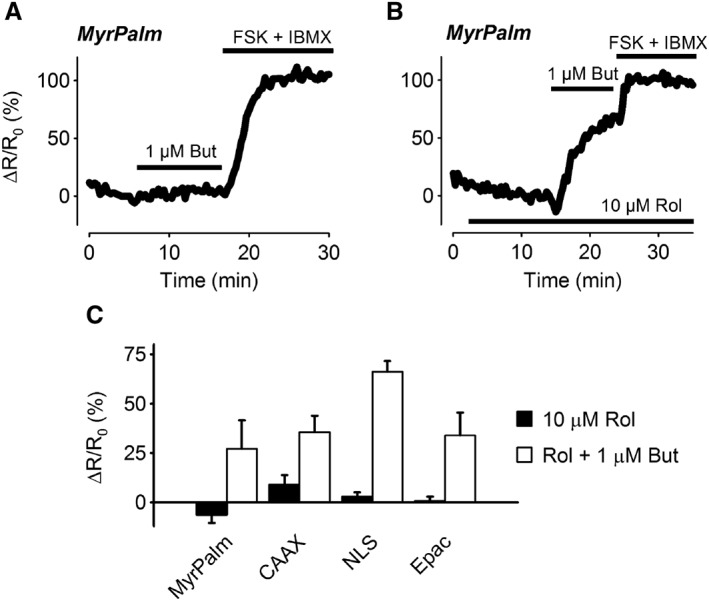
Effect of PDE4 inhibition on cAMP responses elicited by EP2 receptor stimulation. Representative time course of changes in the magnitude of the FRET response (ΔR/R0) in cells expressing Epac2‐MyrPalm (MyrPalm), following exposure to 1 μM butaprost (But) in the absence (A) or presence (B) of the PDE4 inhibitor rolipram (Rol, 10 μM). (C) Size of average FRET responses to 10 μM Rol or Rol plus 1 μM butaprost. There were no significant differences in the size of the responses to 1 μM Rol detected by MyrPalm (n = 10), Epac2‐CAAX (CAAX; n = 8), Epac2‐NLS (NLS; n = 6) and Epac2‐camps (Epac2; n = 5). There were also no significant differences in the size of the responses to 1 μM butaprost in the presence of 10 μM Rol detected by MyrPalm (n = 7), CAAX (n = 8), NLS (n = 6) and Epac2 (n = 5). Statistical significance was tested using one‐way ANOVA. All responses were normalized to the maximal response elicited by 10 μM forskolin (FSK) plus 100 μM IBMX.
Previous studies have suggested that EP2 receptors couple specifically to AC2 in non‐raft regions of the plasma membrane in ASM cells (Bogard et al., 2011; Bogard et al., 2012; Bogard et al., 2014). To examine this possibility, we compared the cAMP responses detected by the lipid raft‐targeted Epac2‐MyrPalm and non‐raft‐targeted Epac2‐CAAX probes in ASM overexpressing AC2 (Figure 7). The results demonstrate that AC2 overexpression had no effect on the inability of butaprost to elicit a response detected by Epac2‐MyrPalm. However, AC2 overexpression did significantly enhance the response to 1 μM butaprost detected by Epac2‐CAAX (Figure 7D). To verify that this result was specific for EP2 receptor activation, we also examined the effect of AC2 overexpression on the responses to β2‐adrenoceptor stimulation (Figure 8). The results demonstrate the AC2 overexpression did not enhance the responses to isoprenaline detected by either Epac2‐MyrPalm or Epac2‐CAAX. If anything, the responses to isoprenaline measured by both of these probes were slightly decreased.
Figure 7.
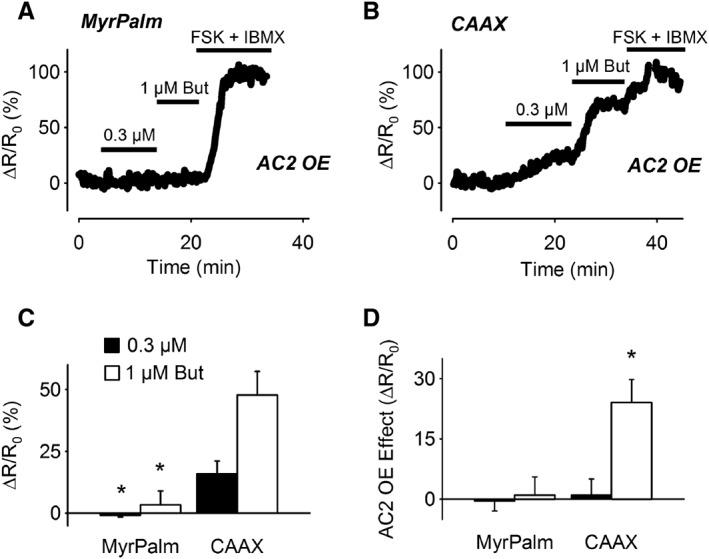
Effect of AC2 overexpression on cAMP responses elicited by EP2 receptor stimulation. Representative time course of changes in the normalized FRET response (ΔR/R0) detected by Epac2‐MyrPalm (MyrPalm) (A) and Epac2‐CAAX (CAAX) (B) following exposure to 0.3 and 1 μM butaprost in cells overexpressing AC2. (C) Size of average FRET responses in AC2 overexpressing (AC2 OE) cells. The size of the response to 0.3 μM butaprost detected by MyrPalm (n = 5) was significantly smaller than that detected by CAAX (n = 9). The size of the response to 1 μM butaprost detected by MyrPalm (n = 3) was also significantly smaller than that detected by CAAX (n = 9). (D) Difference in magnitude of butaprost responses due to AC2 overexpression (OE); 0.3 μM butaprost responses: MyrPalm (n = 11); CAAX (n = 12); 1 μM butaprost responses: MyrPalm (n = 11); CAAX (n = 10). The effect of AC2 overexpression on the response to 1 μM butaprost detected by CAAX was significantly greater than that detected by MyrPalm. Statistical significance was tested using one‐way ANOVA followed by Holm‐Sidak method for pairwise multiple comparisons. All responses were normalized to the maximal response elicited by 10 μM forskolin (FSK) plus 100 μM IBMX.
Figure 8.
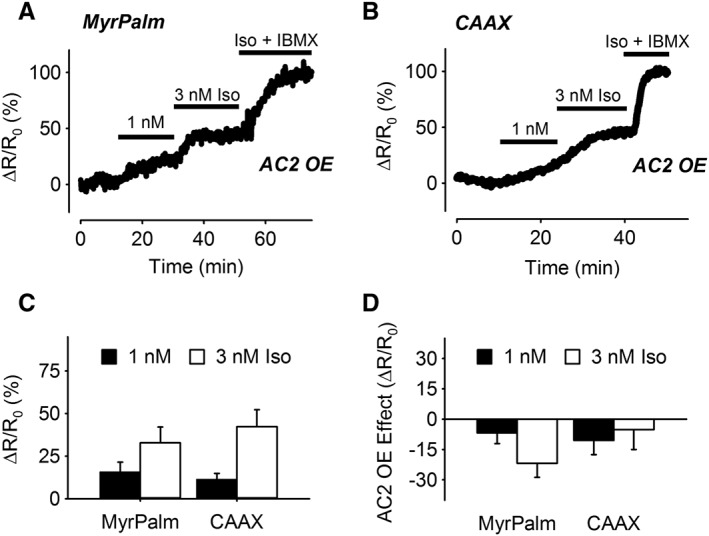
Effect of AC2 overexpression on cAMP responses elicited by β‐adrenoceptor stimulation. Representative time course of changes in the normalized FRET response (ΔR/R0) detected by Epac2‐MyrPalm (MyrPalm) (A) and Epac2‐CAAX (CAAX) (B), following exposure to 1 and 3 nM isoprenaline (Iso) in cells overexpressing AC2. (C) Size of average FRET responses in AC2 overexpressing (OE) cells; 1 nM Iso: MyrPalm (n = 5); CAAX (n = 3); 3 nM Iso: MyrPalm (n = 5); CAAX (n = 3). (D) Difference in magnitude of Iso responses due to AC2 overexpression; 1 nM Iso: MyrPalm (n = 13); CAAX (n = 11); 3 nM Iso: MyrPalm (n = 13); CAAX (n = 11). There was no significant difference in the effects of AC2 overexpression on the responses detected by the different biosensors (one‐way ANOVA). All responses were normalized to the maximal response elicited by 1 μM Iso plus 100 μM IBMX.
Discussion
Human ASM cells, like most cell types, express several GPCRs linked to the production of cAMP. A long‐standing quandary is how these receptors, which respond to a vast array of neurohumoural signals, yield different cellular responses via the same second messenger. The results of the present study demonstrate that the segregation of signalling proteins into different membrane domains plays an important role in generating spatially localized cAMP production in human ASM cells (Bogard et al., 2011; Bogard et al., 2012; Ostrom et al., 2012; Bogard et al., 2014). Specifically, our results support the conclusion that EP2 receptor activation of AC2 generates a localized pool of cAMP in subcellular locations associated with non‐lipid raft domains of the plasma membrane. This is based on two primary observations. First, EP2 receptor stimulation causes a rise in cAMP levels that are detected by the non‐raft‐targeted Epac2‐CAAX biosensor, but not the raft‐anchored Epac2‐MyrPalm probe (see Figure 5). Second, overexpression of AC2 augments EP2 receptor stimulation of cAMP in non‐raft domains, but not lipid raft‐associated domains (see Figure 7), without enhancing β2‐adrenoceptor responses in either location (see Figure 8). These data indicate that EP2 receptor and β2‐adrenoceptor exist in distinct microdomains and couple selectively to different AC isoforms, consistent with previous findings (Bogard et al., 2011; Bogard et al., 2012).
Previous reports indicate that activation of AC2 regulates the production of IL‐6 in ASM cells (Bogard et al., 2014). IL‐6 gene expression involves PKA activation of the cAMP response element binding protein (CREB) and subsequent enhancement of gene transcription (Yamamoto et al., 1988). It is believed that the binding of cAMP to PKA releases the catalytic subunit of the kinase, allowing it to translocate from cytoplasm into the nucleus where it phosphorylates CREB (Harootunian et al., 1993; Altarejos and Montminy, 2011). If this is the case, then activation of PKA anywhere in the cell might be expected to equally regulate all CRE‐containing gene promoters. However, the fact that AC6‐derived cAMP production does not affect the expression of IL‐6 and AC2‐derived cAMP production does not increase expression of somatostatin, another cAMP response element (CRE)‐regulated gene (Bogard et al., 2014), suggests that this is not the case. It implies that the subcellular location of cAMP production is important for how the nucleus interprets such signals. Consistent with this idea, EP2 receptor stimulation was also able to produce significant changes in cAMP that could be detected by our nuclear‐targeted biosensor Epac2‐NLS. In fact, EP2 receptor stimulation produced changes in cAMP at the nucleus that appeared to be greater than those detected near the plasma membrane by Epac2‐CAAX (see Figure 5). The explanation for this difference is not immediately obvious, but may be due to EP2 receptors being expressed in nuclear membranes. It is interesting to note that the probe targeted to non‐lipid raft domains of the plasma membrane appears to concentrate around the nucleus (see Figure 1B).
β2‐adrenoceptor activation was also able to produce changes in cAMP that were detected by the nuclear probe, indicating that signals emanating from lipid raft domains are able to reach the nucleus as well. Thus, a complex model of how cAMP signals convey information to the nucleus is needed. It may be that cAMP signals originating from different locations activate different arrays of PKA‐phosphorylated signalling proteins, such that the resulting information flowing to the nucleus is unique for each locale. Future studies are needed to determine whether the subcellular pattern of PKA activation correlates directly with that of cAMP production. A kinase‐anchoring proteins (AKAPs) could fulfil some of the role in targeting PKA action in specific signalling complexes. AKAPs shape β2‐adrenoceptor responses in human ASMs by regulating receptor and PDE phosphorylation to create negative feedback (Horvat et al., 2012; Ostrom et al., 2012). Different AKAPs bind specific AC isoforms, creating the likelihood that these proteins organize downstream elements into signalling complexes (Efendiev and Dessauer, 2011).
It has also been reported that cAMP produced by the EP2 receptor and AC2 in non‐raft domains are not able to regulate ASM cell arborization (a response robustly enhanced by β2‐adrenoceptor and AC6) unless a PDE4 inhibitor is added (Bogard et al., 2012). Again, differences in the subcellular location of cAMP production are likely to be involved in explaining these observations. The present results demonstrate that β2‐adrenoceptor stimulation was able to increase cAMP to similar levels in all locations examined (see Figure 4). By contrast, EP2 receptors failed to produce a detectable change in cAMP in locations associated with lipid raft domains of the plasma membrane and more weakly produced cAMP detected by the cytosolic sensor (Figure 5). Because the non‐raft‐targeted probe was concentrated centrally, in the membrane around the nucleus, whereas the lipid raft‐targeted probe was found more uniformly throughout the plasma membrane, it is conceivable that cAMP produced in the periphery of the cell may be more important in regulating cell shape. IBMX did not have drastically different effects on cAMP levels detected by the Epac2‐CAAX sensor. However, overexpression of AC2 increased cAMP signalling in the non‐raft domain but did not produce ‘spillover’ into the lipid raft domain (as sensed by Epac2‐MyrPalm), implying that cAMP diffusion from the EP2 receptor‐AC2 complex in the non‐raft domain is more restricted.
PDE activity is thought to play an essential role in compartmentation of cAMP responses, and PDE4 is believed to be the predominant isoform regulating cAMP activity in human ASM cells (Conti et al., 2003; Houslay and Adams, 2003; Méhats et al., 2003; Billington et al., 2008; Nino et al., 2009; Xin et al., 2015). In fact, previous studies found that inhibition of PDE4 unmasks the ability of AC2‐mediated cAMP production to cause arborization of ASM cells (Bogard et al., 2012). Consistent with this observation, we found that inhibition of PDE4 activity was also able to significantly increase the diffusion of EP2 receptor‐mediated cAMP production. Most notable was the fact that inhibition of PDE4 revealed a cAMP response previously undetectable by Epac2‐MyrPalm in subcellular locations associated with lipid rafts (see Figure 6). This could be explained if PDE4 activity is more concentrated in subcellular locations associated with lipid rafts, limiting the ability of cAMP produced in non‐raft domains from diffusing in and reaching significant levels. If true, then the increase in PDE4D activity that occurs with asthma (Trian et al., 2011) might be expected to limit cAMP signalling associated specifically with these microdomains.
It is worth noting, however, that IBMX, which inhibits most PDE isoforms, produced a small, but significant change in basal cAMP activity in all subcellular locations (see Figure 2). This indicates that all microdomains contain some PDE activity. However, if IBMX had inhibited all PDE activity, we would have expected to see saturating responses. The fact that we did not suggests that there must be some IBMX‐insensitive PDE activity in these cells. Furthermore, because inhibition of PDE4 activity alone had no significant effect (see Figure 6), this suggests that human ASM cells also express IBMX‐sensitive PDE isoforms other than just PDE4. Modelling studies have also suggested that while PDE activity is essential, it alone cannot explain cAMP compartmentation (Saucerman et al., 2014). In addition to segregation of receptors and ACs in distinct physical locations, other contributing factors are likely to include slow diffusion of cAMP that is independent of PDE activity (Agarwal et al., 2016) as well as restricted spaces defined by cell morphology (Feinstein et al., 2012; Yang et al., 2016). As a result, once cAMP is produced by a particular AC isoform in a specific location, that signal is not freely diffusible so these distinct signals can regulate different downstream responses by the cell (Figure 9).
Figure 9.
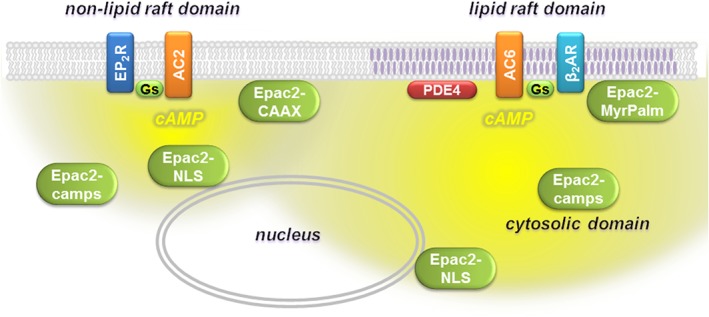
Compartmentalized cAMP signalling in human ASM cells. EP2 receptor stimulation of AC2 in non‐lipid raft domains of the plasma membrane produces cAMP that can be detected by Epac2‐CAAX, Epac2‐NLS and Epac2‐camps biosensors. β2‐adrenoceptor (AR) stimulation of AC6 in lipid raft domains of the plasma membrane produces cAMP that can be detected by Epac2‐MyrPalm, Epac2‐camps, Epac2‐NLS and Epac2‐CAAX biosensors.
Smooth muscle cells can undergo phenotypic changes with time in culture. However, it has been reported that cAMP responses are maintained in human ASM cells well beyond the passage number used in the present study (Stewart et al., 1997). Furthermore, the receptor‐specific cAMP responses we observed are consistent with previous results obtained using similar cells (Bogard et al., 2011; 2012; 2014).
In conclusion, our study provides the first direct evidence for the generation of receptor‐mediated production of spatially localized pools of cAMP within different microdomains of primary human ASM cells. EP2 receptor‐stimulated cAMP signalling is clearly more restricted than β2‐adrenoceptor‐stimulated cAMP signalling in near‐membrane regions even though both receptors elicit cAMP signalling at the nucleus. The results add to our understanding of how this common second messenger may elicit distinct receptor‐specific functional responses in these cells.
Author contributions
R.D.H. and R.S.O. conceived and designed the experiments. K.M., S.R.A. and H.L. conducted the experiments and analysed the data. R.D.H., S.R.A. and R.S.O. were involved in interpretation of the results. S.R.A. and R.D.H. drafted the manuscript. R.S.O. revised the manuscript for intellectual content. All authors critically reviewed the content and approved the final version of the manuscript.
Conflict of interest
The authors declare no conflicts of interest.
Declaration of transparency and scientific rigour
This Declaration acknowledges that this paper adheres to the principles for transparent reporting and scientific rigour of preclinical research recommended by funding agencies, publishers and other organisations engaged with supporting research.
Supporting information
Figure S1 In vitro calibration of Epac2‐NLS biosensor. Concentration‐response curve for cAMP activation of Epac2‐NLS (n = 5). EC50 and Hill slope were 1.04 ± 0.13 μM and 0.84 ± 0.087, respectively. Experiments were conducted as described previously (Agarwal et al., 2014).
Figure S2 Exposure to the AC inhibitor MDL‐12,330A (MDL). FRET response (ΔR/R0) observed following 10 min exposure to 100 μM MDL. Because MDL alone had no effect, subsequent exposure to IBMX plus forskolin was used at the end of each experiment as a positive control. There was no statistical difference (One Way ANOVA) in the FRET responses detected by MyrPalm (n = 5), CAAX (n = 5), NLS (n = 7), and Epac2 (n = 6).
Table S1 cAMP affinity of FRET‐based biosensors.
Acknowledgements
The authors thank Dr Raymond Penn and Dr Tonio Pera, Thomas Jefferson University, for supplying the human ASM cells. This work was supported by National Institute of General Medical Sciences grants R01 GM107094 (R.S.O.) and R01 GM101928 (R.D.H.).
Agarwal, S. R. , Miyashiro, K. , Latt, H. , Ostrom, R. S. , and Harvey, R. D. (2017) Compartmentalized cAMP responses to prostaglandin EP2 receptor activation in human airway smooth muscle cells. British Journal of Pharmacology, 174: 2784–2796. doi: 10.1111/bph.13904.
References
- Agarwal SR, Clancy CE, Harvey RD (2016). Mechanisms restricting diffusion of intracellular cAMP. Sci Rep 6 https://doi.org/10.1038/srep19577. [DOI] [PMC free article] [PubMed] [Google Scholar]
- Agarwal SR, Yang PC, Rice M, Singer CA, Nikolaev VO, Lohse MJ et al. (2014). Role of membrane microdomains in compartmentation of cAMP signaling. PLoS One 9: e95835. [DOI] [PMC free article] [PubMed] [Google Scholar]
- Alexander SPH, Davenport AP, Kelly E, Marrion N, Peters JA, Benson HE et al. (2015a). The Concise Guide to PHARMACOLOGY 2015/16: G protein‐coupled receptors. Br J Pharmacol 172: 5744–5869. [DOI] [PMC free article] [PubMed] [Google Scholar]
- Alexander SPH, Fabbro D, Kelly E, Marrion N, Peters JA, Benson HE et al. (2015b). The Concise Guide to PHARMACOLOGY 2015/16: Enzymes. Br J Pharmacol 172: 6024–6109. [DOI] [PMC free article] [PubMed] [Google Scholar]
- Altarejos JY, Montminy M (2011). CREB and the CRTC co‐activators: sensors for hormonal and metabolic signals. Nat Rev Mol Cell Biol 12: 141–151. [DOI] [PMC free article] [PubMed] [Google Scholar]
- Billington CK, Le Jeune IR, Young KW, Hall IP (2008). A major functional role for phosphodiesterase 4D5 in human airway smooth muscle cells. Am J Respir Cell Mol Biol 38: 1–7. [DOI] [PubMed] [Google Scholar]
- Billington CK, Ojo OO, Penn RB, Ito S (2013). cAMP regulation of airway smooth muscle function. Pulm Pharmacol Ther 26: 112–120. [DOI] [PMC free article] [PubMed] [Google Scholar]
- Bogard AS, Adris P, Ostrom RS (2012). Adenylyl cyclase 2 selectively couples to E prostanoid type 2 receptors, whereas adenylyl cyclase 3 is not receptor‐regulated in airway smooth muscle. J Pharmacol Exp Ther 342: 586–595. [DOI] [PMC free article] [PubMed] [Google Scholar]
- Bogard AS, Birg AV, Ostrom RS (2014). Non‐raft adenylyl cyclase 2 defines a cAMP signaling compartment that selectively regulates IL‐6 expression in airway smooth muscle cells: differential regulation of gene expression by AC isoforms. Naunyn Schmiedebergs Arch Pharmacol 387: 329–339. [DOI] [PMC free article] [PubMed] [Google Scholar]
- Bogard AS, Xu C, Ostrom RS (2011). Human bronchial smooth muscle cells express adenylyl cyclase isoforms 2, 4, and 6 in distinct membrane microdomains. J Pharmacol Exp Ther 337: 209–217. [DOI] [PMC free article] [PubMed] [Google Scholar]
- Conti M, Richter W, Mehats C, Livera G, Park JY, Jin C (2003). Cyclic AMP‐specific PDE4 phosphodiesterases as critical components of cyclic AMP signaling. J Biol Chem 278: 5493–5496. [DOI] [PubMed] [Google Scholar]
- Curtis MJ, Bond RA, Spina D, Ahluwalia A, Alexander SP, Giembycz MA et al. (2015). Experimental design and analysis and their reporting: new guidance for publication in BJP. Br J Pharmacol 172: 3461–3471. [DOI] [PMC free article] [PubMed] [Google Scholar]
- DiPilato LM, Cheng X, Zhang J (2004). Fluorescent indicators of cAMP and Epac activation reveal differential dynamics of cAMP signaling within discrete subcellular compartments. Proc Natl Acad Sci U S A 101: 16513–16518. [DOI] [PMC free article] [PubMed] [Google Scholar]
- Efendiev R, Dessauer CW (2011). A kinase‐anchoring proteins and adenylyl cyclase in cardiovascular physiology and pathology. J Cardiovasc Pharmacol 58: 339–344. [DOI] [PMC free article] [PubMed] [Google Scholar]
- Feinstein WP, Zhu B, Leavesley SJ, Sayner SL, Rich TC (2012). Assessment of cellular mechanisms contributing to cAMP compartmentalization in pulmonary microvascular endothelial cells. Am J Physiol Cell Physiol 302: C839–C852. [DOI] [PMC free article] [PubMed] [Google Scholar]
- Gros R, Ding Q, Chorazyczewski J, Pickering GJ, Limbird LE, Feldman RD (2006). Adenylyl cyclase isoform–selective regulation of vascular smooth muscle proliferation and cytoskeletal reorganization. Circ Res 99: 845–852. [DOI] [PubMed] [Google Scholar]
- Harootunian AT, Adams SR, Wen W, Meinkoth JL, Taylor SS, Tsien RY (1993). Movement of the free catalytic subunit of cAMP‐dependent protein kinase into and out of the nucleus can be explained by diffusion. Mol Biol Cell 4: 993–1002. [DOI] [PMC free article] [PubMed] [Google Scholar]
- Horvat SJ, Deshpande DA, Yan H, Panettieri RA, Codina J, DuBose TD Jr et al. (2012). A‐kinase anchoring proteins regulate compartmentalized cAMP signaling in airway smooth muscle. FASEB J 26: 3670–3679. [DOI] [PMC free article] [PubMed] [Google Scholar]
- Houslay MD, Adams DR (2003). PDE4 cAMP phosphodiesterases: modular enzymes that orchestrate signalling cross‐talk, desensitization and compartmentalization. Biochem J 370: 1–18. [DOI] [PMC free article] [PubMed] [Google Scholar]
- Méhats C, Jin SLCL, Wahlstrom J, Law E, Umetsu DT, Conti M (2003). PDE4D plays a critical role in the control of airway smooth muscle contraction. FASEB J 17: 1831–1841. [DOI] [PubMed] [Google Scholar]
- Nikolaev VO, Bunemann M, Hein L, Hannawacker A, Lohse MJ (2004). Novel single chain cAMP sensors for receptor‐induced signal propagation. J Biol Chem 279: 37215–37218. [DOI] [PubMed] [Google Scholar]
- Nino G, Hu A, Grunstein JS, Grunstein MM (2009). Mechanism regulating proasthmatic effects of prolonged homologous beta2‐adrenergic receptor desensitization in airway smooth muscle. Am J Physiol Lung Cell Mol Physiol 297: L746–L757. [DOI] [PMC free article] [PubMed] [Google Scholar]
- Noble PB, Pascoe CD, Lan B, Ito S, Kistemaker L, Tatler AL et al. (2014). Airway smooth muscle in asthma: Linking contraction and mechanotransduction to disease pathogenesis and remodelling. Pulm Pharmacol Ther 29: 96–107. [DOI] [PubMed] [Google Scholar]
- Ostrom RS, Bogard AS, Gros R, Feldman RD (2012). Choreographing the adenylyl cyclase signalosome: sorting out the partners and the steps. Naunyn Schmiedebergs Arch Pharmacol 385: 5–12. [DOI] [PubMed] [Google Scholar]
- Ostrom RS, Gregorian C, Drenan RM, Xiang Y, Regan JW, Insel PA (2001). Receptor number and caveolar co‐localization determine receptor coupling efficiency to adenylyl cyclase. J Biol Chem 276: 42063–42069. [DOI] [PubMed] [Google Scholar]
- Pelaia G, Renda T, Gallelli L, Vatrella A, Busceti M, Agati S et al. (2008). Molecular mechanisms underlying airway smooth muscle contraction and proliferation: implications for asthma. Respir Med 102: 1173–1181. [DOI] [PubMed] [Google Scholar]
- Saucerman JJ, Greenwald EC, Polanowska‐Grabowska R (2014). Mechanisms of cyclic AMP compartmentation revealed by computational models. J Gen Physiol 143: 39–48. [DOI] [PMC free article] [PubMed] [Google Scholar]
- Southan C, Sharman JL, Benson HE, Faccenda E, Pawson AJ, Alexander SP et al. (2016). The IUPHAR/BPS Guide to PHARMACOLOGY in 2016: towards curated quantitative interactions between 1300 protein targets and 6000 ligands. Nucleic Acids Res 44: D1054–D1068. [DOI] [PMC free article] [PubMed] [Google Scholar]
- Stewart AG, Tomlinson PR, Wilson JW (1997). Beta 2‐adrenoceptor agonist‐mediated inhibition of human airway smooth muscle cell proliferation: importance of the duration of beta 2‐adrenoceptor stimulation. Br J Pharmacol 121: 361–368. [DOI] [PMC free article] [PubMed] [Google Scholar]
- Trian T, Burgess JK, Niimi K, Moir LM, Ge Q, Berger P et al. (2011). beta2‐Agonist induced cAMP is decreased in asthmatic airway smooth muscle due to increased PDE4D. PLoS One 6: e20000. [DOI] [PMC free article] [PubMed] [Google Scholar]
- Xin W, Feinstein WP, Britain AL, Ochoa CD, Zhu B, Richter W et al. (2015). Estimating the magnitude of near‐membrane PDE4 activity in living cells. Am J Physiol Cell Physiol 309: C415–C424. [DOI] [PMC free article] [PubMed] [Google Scholar]
- Xu D, Isaacs C, Hall IP, Emala CW (2001). Human airway smooth muscle expresses 7 isoforms of adenylyl cyclase: a dominant role for isoform V. Am J Physiol Lung Cell Mol Physiol 281: L832–L843. [DOI] [PubMed] [Google Scholar]
- Yamamoto KK, Gonzalez GA, Biggs WH 3rd, Montminy MR (1988). Phosphorylation‐induced binding and transcriptional efficacy of nuclear factor CREB. Nature 334: 494–498. [DOI] [PubMed] [Google Scholar]
- Yan H, Deshpande DA, Misior AM, Miles MC, Saxena H, Riemer EC et al. (2011). Anti‐mitogenic effects of beta‐agonists and PGE2 on airway smooth muscle are PKA dependent. FASEB J 25: 389–397. [DOI] [PMC free article] [PubMed] [Google Scholar]
- Yang PC, Boras BW, Jeng MT, Docken SS, Lewis TJ, McCulloch AD et al. (2016). A computational modeling and simulation approach to investigate mechanisms of subcellular cAMP compartmentation. PLoS Comput Biol 12 e1005005. [DOI] [PMC free article] [PubMed] [Google Scholar]
- Zacharias DA, Violin JD, Newton AC, Tsien RY (2002). Partitioning of lipid‐modified monomeric GFPs into membrane microdomains of live cells. Science 296: 913–916. [DOI] [PubMed] [Google Scholar]
Associated Data
This section collects any data citations, data availability statements, or supplementary materials included in this article.
Supplementary Materials
Figure S1 In vitro calibration of Epac2‐NLS biosensor. Concentration‐response curve for cAMP activation of Epac2‐NLS (n = 5). EC50 and Hill slope were 1.04 ± 0.13 μM and 0.84 ± 0.087, respectively. Experiments were conducted as described previously (Agarwal et al., 2014).
Figure S2 Exposure to the AC inhibitor MDL‐12,330A (MDL). FRET response (ΔR/R0) observed following 10 min exposure to 100 μM MDL. Because MDL alone had no effect, subsequent exposure to IBMX plus forskolin was used at the end of each experiment as a positive control. There was no statistical difference (One Way ANOVA) in the FRET responses detected by MyrPalm (n = 5), CAAX (n = 5), NLS (n = 7), and Epac2 (n = 6).
Table S1 cAMP affinity of FRET‐based biosensors.