

Abstract
Background and Purpose
The in vivo oestrogenicity of genistein and its glycoside genistin is still under debate. The present study aimed to develop a physiologically based kinetic (PBK) model that provides insight in dose‐dependent plasma concentrations of genistein aglycone and its metabolites and enables prediction of in vivo oestrogenic effective dose levels of genistein and genistin in humans.
Experimental Approach
A PBK model for genistein and genistin in humans was developed based on in vitro metabolic parameters. The model obtained was used to translate in vitro oestrogenic concentration–response curves of genistein to in vivo oestrogenic dose–response curves for intake of genistein and genistin.
Key Results
The model predicted that genistein‐7‐O‐glucuronide was the major circulating metabolite and that levels of the free aglycone were generally low [0.5–17% of total plasma genistein at oral doses from 0.01 to 50 mg (kg·bw)−1]. The predicted in vivo benchmark dose for 5% response values for oestrogenicity varied between 0.06 and 4.39 mg kg−1 genistein. For genistin, these values were 1.3‐fold higher. These values are in line with reported human data and show that oestrogenic responses can be expected at an Asian dietary and a supplementary intake, while intake resulting from a Western diet may not be effective.
Conclusions and Implications
The present study shows how plasma concentrations of genistein and its metabolites and oestrogenic dose levels of genistein in humans can be predicted by combining in vitro oestrogenicity with PBK model‐based reverse dosimetry, eliminating the need for human intervention studies.
Abbreviations
- AUC
area under the concentration‐time curve
- BMD05
benchmark dose for 5% response
- Cmax
maximum concentration
- ECin vitro/in vivo
effective in vitro or in vivo concentration
- ER
oestrogen receptor
- G‐4′G
genistein‐4′‐O‐glucuronide
- G‐4′G‐7S
genistein‐4′‐O‐glucuronide‐7‐O‐sulfate
- G‐4′7‐diG
G‐4′7‐O‐diglucuronide
- G‐4′S
genistein‐4′‐O‐sulfate
- G‐7G
genistein‐7‐O‐glucuronide
- G‐7G‐4′S
genistein‐7‐O‐glucuronide‐4′‐O‐sulfate
- G‐7S
genistein‐7‐O‐ sulfate
- PAPS
3′‐phosphoadenosine 5′‐phosphosulfate
- PBK
physiologically based kinetic
- Tmax
time to reach Cmax
- UDPGA
uridine 5′‐diphosphoglucuronide acid
Introduction
Isoflavones are a common group of polyphenols and are generally known as phytoestrogens as they can exert weak oestrogenic potencies due to their basic structural similarity to endogenous estradiol (Rietjens et al., 2013). Isoflavones have been reported to reduce the incidence of mammary tumours in experimental animal models (Hargreaves et al., 1999) and in observational epidemiologic studies (Yamamoto et al., 2003). However, there is also evidence suggesting that isoflavones can stimulate cell proliferation of breast cancer cells in vitro (Kuiper et al., 1998; Maggiolini et al., 2001; Han et al., 2002; Kinjo et al., 2004; Matsumura et al., 2005) and in ovariectomized animal models of breast cancer (Hsieh et al., 1998) in a dose‐dependent manner. These findings raised a concern about the safety of these isoflavones, especially in patients with existing oestrogen‐sensitive tumours and woman at risk of developing breast cancer. A possible mode of action underlying these positive and negative effects of isoflavones might be the modulation of oestrogen receptor (ER) signalling as agonist or antagonist depending on the endogenous concentration of ERs (Rietjens et al., 2013). ERs consist of two major isoforms: ERα that drives proliferation and ERβ that inhibits proliferation and stimulates apoptosis (Rietjens et al., 2013). The present study especially focused on this activity to regulate cell proliferation, while it is known that ERs may have many more functions (Lee et al., 2012; Paterni et al., 2014). With respect to cell proliferation, these two receptors moderate each other's effects, and therefore, their absolute concentration and ratio within a tissue may influence the cellular response toward different xenoestrogens (Sotoca et al., 2008). A recent scientific opinion of the European Food Safety Authority concluded that ‘there is no indication for adverse effects on the mammary gland, uterus, and thyroid function and no genotoxic concern in post‐menopausal women taking 30‐900 mg day‐1 isoflavones supplements for 3‐36 months, but that there are insufficient data to assess the risk of isoflavone supplements in post‐menopausal women with a current diagnosis or history of oestrogen‐dependent cancer’ (EFSA, 2015).
Genistein is the major isoflavone in soy occurring in plants mainly in its glycosylated form, genistin (genistein‐7‐O‐glucoside) (Islam et al., 2014), while fermentation increases the aglycone content in soy‐based products (Yuan et al., 2012a; Islam et al., 2014). The metabolic pathways of genistin and genistein are shown in Figure 1. The glycosylated genistin is hydrolyzed to genistein aglycone prior to absorption in the intestine by the brush‐border lactase, phlorizin hydrolase (Walsh et al., 2007) or by gut microflora (Bokkenheuser et al., 1987). Upon absorption, genistein is extensively metabolized by glucuronidation and sulfation in both intestinal cells and liver cells. Most of the absorbed genistein is present in the systemic circulation in the form of glucuronides, sulfates and mixed conjugates at positions 4′ and/or 7 (Hosoda et al., 2010; Hosoda et al., 2011; Yuan et al., 2012b).
Figure 1.
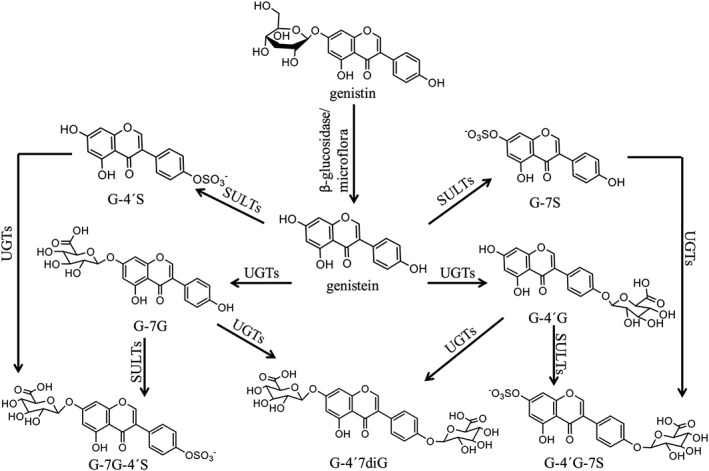
Proposed metabolic pathways of genistin and genistein in humans (Hosoda et al., 2010; Hosoda et al., 2011; Yuan et al., 2012b).
The genistein conjugates tested so far, including genistein‐7‐O‐glucuronide (G‐7G), genistein‐7‐O‐sulfate (G‐7S) and genistein‐4′‐O‐sulfate (G‐4′S), appeared inactive in assays for oestrogenicity, leading to the conclusion that the action of the soy phytoestrogen genistein will be mainly related to the plasma and tissue concentration of the free aglycone (Yuan et al., 2012a; Islam et al., 2015).
Available data on the oestrogenic activity of genistein in humans under realistic exposure scenarios are contradicting and inconclusive. In some human studies, genistein and other isoflavones have been reported to exert an oestrogenic response especially in healthy premenopausal women (Petrakis et al., 1996; Niculescu et al., 2007; Khan et al., 2012; van der Velpen et al., 2014). In contrast, some human studies report no oestrogenic response of genistein/isoflavones in healthy as well as breast cancer women even at supplementary doses (Hargreaves et al., 1999; Sartippour et al., 2004; van der Velpen et al., 2013; Wu et al., 2015). Given that the oestrogenicity of genistein might strongly depend on the plasma levels of its aglycone, it is necessary to have a better understanding of the absorption, distribution, metabolism and excretion of genistein in humans and the actual plasma levels of genistein and its various metabolites in human subjects. The aim of the present study was to develop a physiologically based kinetic (PBK) model that provides insight in the dose‐dependent, plasma concentration of genistein aglycone and its metabolites and enables prediction of the in vivo dose–response curves for oestrogenicity of genistein and genistin in humans based on in vitro concentration–response curves. The outcomes obtained can be used to determine whether and if so at what oral dose levels genistein or genistin may elicit oestrogenic effects in vivo.
Methods
Enzymatic conjugation of genistein and genistein mono‐conjugates with pooled human tissue fractions
Kinetic constants for sulfation of genistein and conjugation of the mono‐conjugates G‐7G, G‐4′G and G‐7S to di‐conjugates, needed as parameters in the PBK models, were obtained from in vitro incubations with pooled mixed‐gender human small intestine and liver S9 fractions based on methods described by Islam et al. (2014) with some modifications. Use of mixed‐gender human tissue fractions was considered adequate to represent both male and female individuals because no significant gender differences in maximum concentration (Cmax), area under the concentration‐time curve (AUC) and time to reach Cmax (Tmax) in plasma of total genistein (genistein aglycone and its metabolites) and because no gender differences in plasma concentrations of individual different mono‐ and di‐conjugates containing sulfate and/or glucuronide moiety as well as genistein aglycone were observed between male and female human volunteers following consumption of soy foods (Cassidy et al., 2006; Soukup et al., 2016).
For glucuronidation, 100 μL incubation mixtures (final volume) were prepared containing 10 mM MgCl2, 20 mM D‐saccharic acid 1,4‐lactone (pH 7.4), 10 mM UDPGA and human tissue fractions in 50 mM Tris–HCl (pH 7.4). D‐saccharic acid 1,4‐lactone was added to inhibit β‐glucuronidase (Oleson and Court, 2008). A protein content of 0.8, 0.8 and 0.2 mg·mL−1 human small intestine S9 and of 1.2, 0.8 and 0.8 mg·mL−1 human liver S9 was applied for the incubations of G‐7G, G‐4′G and G‐7S respectively. The incubation mixtures were pretreated on ice with 0.025 mg·mL−1 alamethicin added from a 200 times concentrated stock solution in methanol for 15 min. After 1 min pre‐incubation at 37°C, the reactions were initiated by adding substrate (final concentration ranging from 0.5 to 400 μM) added from a 200 times concentrated stock solution in DMSO. The incubations of G‐7G, G‐4′G and G‐7S were terminated after 60, 180 and 40 min for incubations with human small intestine S9 and after 240, 240 and 240 min for incubations with human liver S9, respectively, by adding 25 μL ice‐cold acetonitrile. Blank incubations were carried out without UDPGA. Under the specified conditions, glucuronidation was linear in time and with protein content (data not shown).
For sulfation reactions, 100 μL incubation mixtures (final volume) were prepared containing 10 mM MgCl2, 20 mM D‐saccharic acid 1,4‐lactone (pH 7.4), 0.1 mM PAPS (3'‐phosphoadenosine‐5'‐phosphosulfate) and human tissue fractions in 50 mM Tris–HCl (pH 7.4). A protein content of 0.4, 0.8 and 0.8 mg·mL−1 human small intestine S9 or human liver S9 was applied for the incubations of genistein, G‐7G and G‐4′G respectively. The incubation mixtures were pre‐incubated for 1 min at 37°C prior to an addition of substrate (final concentration ranging from 0.5 to 400 μM) added from a 200 times concentrated stock solution in DMSO to initiate the reactions. The incubations of genistein, G‐7G and G‐4′G were terminated after 20, 240 and 180 min for incubations with human small intestine S9 and after 20, 240 and 240 min for incubations with human liver S9, respectively, by adding 25 μL ice‐cold acetonitrile. Blank incubations were carried out without PAPS. Under the specified conditions, sulfation was linear in time and with protein content (data not shown).
Identification and quantification of genistein metabolites
All samples were analysed on a UPLC‐DAD system consisting of a Waters (Milford, MA, USA) Acquity binary solvent manager, sample manager and photodiode array detector, equipped with a Waters Acquity UPLC BEH RP 18 column (1.7 μm, 2.1 × 50 mm). Before analysis, the samples were centrifuged at 21 460 × g for 5 min at 5°C to precipitate proteins, and 3.5 μL of the supernatant was subsequently analysed. A gradient was applied consisting of nanopure water containing 0.1% trifluoroacetic acid (eluent A) and acetonitrile (eluent B) with a flow rate of 0.6 mL·min−1 with the following profile: 0–10% B (0–0.58 min), 10–15% B (0.58–2.85 min), 15–50% B (2.85–4.28 min), 50–80% B (4.28–4.40 min), 80% B (4.40–4.52 min), 80–0% B (4.52–4.63 min) and 0% B (4.63–5.80 min).
Identification of the formed metabolites obtained from glucuronidation and sulfation reactions was carried out by comparing their UV‐spectra and retention times with those of commercially available reference compounds including G‐7S, G‐7G‐4′S and G‐4′7diG. The nature of the sulfate metabolite of G‐4′G and the glucuronide metabolite of G‐7S was confirmed by treating incubation samples with β‐glucuronidase/sulfatase as there was no commercially reference compound available. To this end, 50 μL of non‐terminated mixtures (incubation samples) were added to 50 μL of 0.1 M sodium acetate (pH 5.0) containing 189 units·mL−1 β‐glucuronidase and 1 units·mL−1 sulfatase. The reactions were carried out for 2 h at 37°C and were terminated by adding 25 μL of ice‐cold acetonitrile. Under the specified conditions, the conjugates were completely hydrolyzed to the aglycone (data not shown).
Metabolites were quantified by integrating the peak areas at 260 nm (Islam et al., 2014) and by using the calibration curves of their commercially available reference compounds. G‐4′G‐7S was quantified by using the calibration curve of G‐7G‐4′S, which was considered adequate because G‐4′G‐7S has the same UV‐spectrum as G‐7G‐4′S (data not shown) and was assumed to display a similar molar extinction coefficient.
Kinetic analysis
Kinetic constants namely the apparent maximum velocity (V max(app)) and apparent Michaelis–Menten constant (K m(app)) for formation of all metabolites were determined by fitting the data to the standard Michaelis–Menten equation. For reactions demonstrating substrate inhibition, the V max, K m, and inhibition constant (K i) were determined by fitting the data to the substrate inhibition equation. The substrate inhibition was observed for especially some sulfation reactions at increasing substrate concentrations. This has been reported before and has been ascribed to the formation of non‐productive ternary dead‐end enzyme complexes, assess of more than one substrates to the active binding site of the enzyme, and/or substrate‐induced changes in enzyme conformation (Wu, 2011). The kinetic constants were determined using GraphPad Prism version 5.04 (GraphPad Software, San Diego, CA, USA).
| (1) |
| (2) |
where [S] represents the substrate concentration. The values of V max, K m and K i were expressed in nmol·min−1·mg−1 protein, μM and μM respectively.
PBK model
A PBK model for genistein and its glycoside, genistin, in humans was developed in a similar manner as previously defined for quercetin (Boonpawa et al., 2014; Boonpawa et al., 2015). The model consists of separate compartments for the intestinal lumen, small intestine, liver, kidney, rapidly perfused tissues (e.g. heart, lung, brain) and slowly perfused tissues (e.g. skin, muscle, bone) as shown in Figure 2. Genistin was modelled to be hydrolyzed to its aglycone, genistein, in the intestinal lumen by the brush‐border lactase phlorizin hydrolase with a hydrolysis clearance of 9.6 L·h−1 as reported by Islam et al. (2014). The uptake of genistein to the small intestine compartment was described by first‐order kinetics with an absorption rate constant of 5.02 h−1 as reported by Steensma et al. (2004). The genistein aglycone was not modelled to be excreted in urine as only trace amounts of unconjugated genistein are detected in human urine following oral uptake of genistein (Hosoda et al., 2011; Yuan et al., 2012b). The kinetic parameters for excretion of genistein conjugates via urine, bile and intestinal efflux back to intestinal lumen were obtained by fitting the predicted dose‐dependent plasma concentration of total genistein (genistein aglycone plus metabolites) with available experimental plasma human data (Setchell et al., 2001; Hosoda et al., 2008; Hosoda et al., 2010; Hosoda et al., 2011; Yuan et al., 2012b), resulting in an average value of 4, 2 h−1 and 0.1 L·h−1 respectively. The fitting was carried out using the multiple‐curve fitting function in Berkeley Madonna, which minimizes the root mean square deviation between the reported in vivo data points and the model output. To prevent the program finding a local minimum instead of the global minimum, the starting and end values were set at the value of 0.01 and 20 for all three excretion parameters. The program then will find the best combination of the three excretion parameters that gives the best fit of the model prediction with the reported human data. The averages of the obtained excretion parameters from the fitting to each human study were used. Experimental human data were from studies using oral consumption of soy‐based food, genistein or genistin at a dose of 0.71 mg kg−1 genistein or 0.71 mg kg−1 genistin (Setchell et al., 2001), 0.92 mg kg−1 genistein and 0.86 mg kg−1 genistin (Hosoda et al., 2008), 0.92 mg kg−1 genistein and 0.76 mg kg−1 genistin (Hosoda et al., 2010), 0.18 mg kg−1 genistein and 0.15 mg kg−1 genistin (Hosoda et al., 2011) or 0.13 mg kg−1 genistein or 0.21 mg kg1 genistin (Yuan et al., 2012b). Genistein was modelled to undergo metabolic conversion via glucuronidation and sulfation reactions forming different mono‐ and di‐conjugates at positions 4′ and/or 7. The kinetic constants for glucuronidation of genistein were obtained from in vitro incubations by Islam et al. (2014). For other reactions including sulfation of genistein, G‐7G and G4′G as well as glucuronidation of G‐7G, G4′G and G‐7S, the kinetic constants were obtained in the present study based on in vitro experiments. The apparent V max values for formation of the different mono‐ and di‐conjugates were scaled to in vivo V max values using an S9 content of 11.4 and 143 mg (g tissue)−1 for small intestine and liver as scaling factors (Boonpawa et al., 2015). It is of importance to note that the current PBK model does not include the formation of the microflora metabolite equol, a potent oestrogenic metabolite (Morito et al., 2001; Hwang et al., 2006), because equol is a major metabolite of daidzein, not of genistein and only approximately one‐third to one‐half of the population are actually equol producers (Yuan et al., 2007). Dihydrogenistein is a corresponding metabolite formed of genistein by gut microflora; however, only a few studies have been reported on its oestrogenicity (Morito et al., 2001; Hwang et al., 2006). Morito et al. (2001) reported that dihydrogenistein showed similar binding affinity and induced similar transcriptional activation of human ERα and ERβ as genistein aglycone. However, Hwang et al. (2006) found that dihydrogenistein exerted much weaker oestrogenic responses in binding and inducing transcriptional activation of human ERα and ERβ as well as in stimulating ERα‐mediated cell proliferation than genistein aglycone. Given these contradicting reports on oestrogenicity, the formation of the microflora metabolite dihydrogenistein was not included in the PBK model.
Figure 2.
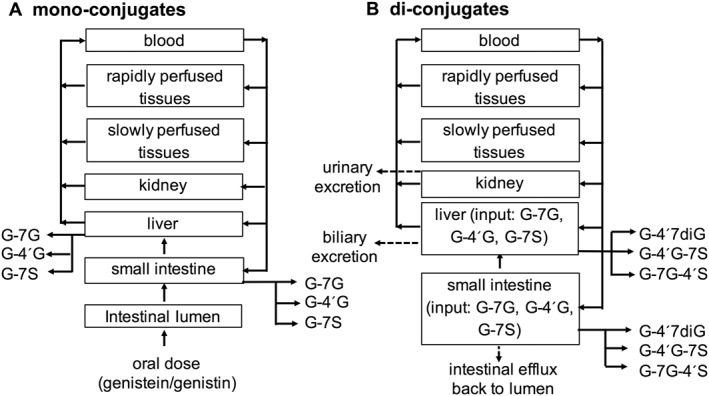
PBK model structure for mono‐conjugates (A) and di‐conjugates (B) of genistein: genistein‐7‐O‐glucuronide (G‐7G), genistein‐4′‐O‐glucuronide (G‐4′G), genistein‐7‐O‐sulfate (G‐7S), genistein‐4′‐O‐sulfate (G‐4′S), genistein‐4′,7‐O‐diglucuronide (G‐4′7diG), genistein‐7‐O‐glucuronide‐4′‐O‐sulfate (G‐7G‐4′S) and genistein‐4′‐O‐glucuronide‐7‐O‐sulfate (G‐4′G‐7S).
The physiological parameters including organ volumes, cardiac output and blood flows were obtained from Brown et al. (1997) and are shown in Supporting Information Table S1. The physico‐chemical parameters for genistein and its metabolites are shown in Table 1. Tissue : blood partition coefficients of genistein and its metabolites were estimated from log K ow according to a method described by DeJongh et al. (1997). Log K ow values were estimated from Clog P values obtained from Scifinder (American Chemical Society, USA) and ChemBioDraw Ultra 14.0 (Cambridge‐Soft, USA). Conversion of blood concentrations of genistein and its metabolites to plasma concentrations was done by dividing the blood concentrations by a blood/plasma ratio (R). The fraction unbound for genistein and its metabolites was calculated using Simcyp prediction tools (Simcyp, 2014a). The R values for genistein and its metabolites were calculated based on the fraction unbound (Simcyp, 2014a), compound type, pKa and log Kow of genistein and its metabolites at plasma pH of 7.4 using Simcyp prediction tools (Simcyp, 2014b), and the average R value of 0.66 thus obtained was used for the modelling. Mass balance equations were numerically integrated in Berkeley Madonna version 8.3.18 (Macey and Oster, UC Berkeley, CA, USA) using Rosenbrock's algorithm for stiff system. Mass balance equations for genistein and its metabolites were similar to those previously described by Boonpawa et al. (2014, 2015) for quercetin. Model performance was evaluated by comparing the predicted amounts of genistein metabolites excreted in urine to the reported amounts of genistein metabolites in human urine (Hosoda et al., 2011; Yuan et al., 2012b). A sensitivity analysis was performed to assess key parameters that contribute substantially to the Cmax of genistein aglycone in plasma following intake of genistein and genistin at oral doses of 0.5 and 7 mg kg−1, representing an average Asian dietary (Rietjens et al., 2013) and supplementary intake of genistein/genistin (EFSA, 2015) respectively. Normalized sensitivity coefficients (SCs) were calculated for the model parameters according to the method described by Evans and Andersen (2000) as follows:
| (3) |
where C is the initial value of the model output, C′ is the modified value of the model output resulting from an increase in parameter value, P is the initial parameter value and P′ is the modified parameter value assuming a 5% increase in its value.
Table 1.
Physico‐chemical parameters of genistein and its metabolites in human
| Tissue : blood partition coefficientse | |||||||||
|---|---|---|---|---|---|---|---|---|---|
| Compound | CLogP a | pKab | fuc | R d | Small intestine | Liver | Kidney | Rapidly perfused tissue | Slowly perfused tissue |
| Genistein | 3.11 | 6.51 | 0.03 | 0.73 | 6.44 | 6.44 | 3.01 | 3.01 | 4.08 |
| G‐7G | 0.84 | 2.73 | 0.16 | 0.64 | 0.86 | 0.86 | 0.92 | 0.92 | 0.90 |
| G‐4′G | 0.36 | 2.78 | 0.22 | 0.63 | 0.71 | 0.71 | 0.84 | 0.84 | 0.81 |
| G‐7S | 2.51 | −4.92 | 0.05 | 0.70 | 4.18 | 4.18 | 1.97 | 1.97 | 2.79 |
| G‐4′S | 2.03 | −4.24 | 0.07 | 0.68 | 2.56 | 2.56 | 1.46 | 1.46 | 1.87 |
| G‐7G‐4′S | −1.69 | – | – | – | 0.59 | 0.59 | 0.76 | 0.76 | 0.75 |
| G‐4′G‐7S | −1.69 | – | – | – | 0.59 | 0.59 | 0.76 | 0.76 | 0.75 |
| G‐4′7diG | −1.91 | 2.73 | 0.66 | 0.57 | 0.59 | 0.59 | 0.76 | 0.76 | 0.75 |
CLogP values for genistein and its metabolites were estimated using Scifinder (American Chemical Society, USA) and ChemBioDraw Ultra 14.0 (Cambridgesoft, USA).
pKa values were obtained from Scifinder (American Chemical Society, USA).
Fraction unbound (fu) was calculated using Simcyp prediction tools‐fu (Simcyp, 2014a).
Blood/plasma ratio (R) was calculated using Simcyp prediction tools‐blood to plasma partition ratio (Simcyp, 2014b).
Tissue : blood partition coefficients of genistein and its metabolites were calculated according to the method described by DeJongh et al. (1997).
Monte Carlo simulation was performed to assess the effect of interindividual human variation in the metabolism of genistein on the concentrations of genistein and its metabolites in plasma and urine as well as the resulting fold differences between predicted and observed values. To this end, a total of 10 000 simulations were performed focusing on the influential kinetic parameters (normalized SC in the sensitivity analysis >0.1) including the kinetic constants for formation of G‐7G in the small intestine and liver and the kinetic constants for formation of G‐7S in the liver. For each simulation, the V max and K m values were varied independently and randomly selected from a log‐normal distribution. The mean μw and standard deviation σ w describing these log‐normal distributions of the V max and K m values were derived using the following equation:
| (4) |
| (5) |
where μx is the mean V max and K m values, which was set to the values obtained from the pooled human small intestine and liver S9 (Table 3). CVx is the coefficient of variation of the non‐ln transformed V max and K m values. The in vitro kinetic constants (V max and K m values) for all reactions in the present study and in the study by Islam et al. (2014) were obtained from pooled mixed‐gender human tissue fractions, which implies that the respective confidence intervals are not the correct intervals to define the CVx values needed in the present study. All reactions were assumed to have the same CVx, which were set to be 0.3 as this is a general value applied when no information on the coefficient of variation is available (Covington et al., 2007). The following equations were added for formation of G‐7G in the small intestine (I) and liver (L) and the kinetic constants for formation of G‐7S in the liver to the human PBK model to perform Monte Carlo simulation:
| (6) |
| (7) |
| (8) |
| (9) |
| (10) |
| (11) |
Table 3.
Kinetic constants for formation of mono‐ and di‐conjugates of genistein obtained from in vitro incubations with human tissue fractions. For full concentration‐dependent activity curves from which these kinetic constants are derived, see Supporting Information Figure S1
| Substrate | Metabolites | Small intestine S9 | Liver S9 | ||||||
|---|---|---|---|---|---|---|---|---|---|
| K m a | V max b | Scaled V max c | CEd | K m a | V max b | Scaled V max c | CEd | ||
| Genistein | G‐7Ge | 5.8 | 0.7 | 0.48 | 0.08 | 22 | 1.50 | 12.87 | 0.59 |
| G‐4′Ge | 19 | 0.2 | 0.14 | 0.01 | 32 | 0.10 | 0.86 | 0.03 | |
| G7Sf | 0.11 | 0.03 | 0.02 | 0.19 | 0.11 | 0.02 | 0.17 | 1.56 | |
| G4′S | ndg | nd | – | – | nd | nd | – | – | |
| G‐7G | G‐4′,7diG | 229 | 0.04 | 0.03 | 0.0001 | nd | nd | – | – |
| G‐7G‐4′S | 134 | 0.003 | 0.002 | 0.00002 | 35 | 0.002 | 0.02 | 0.0005 | |
| G‐4′G | G‐4′,7diG | 665 | 0.51 | 0.35 | 0.001 | 196 | 0.01 | 0.09 | 0.0004 |
| G‐4′G‐7S | nd | nd | – | – | 152 | 0.02 | 0.17 | 0.001 | |
| G‐7S | G‐7S‐4′G | 18 | 0.65 | 0.44 | 0.02 | nd | nd | – | – |
μM.
nmol min (mg S9)−1.
Expressed as μmol h (g tissue)−1 and calculated from V max(app)/(1000 nmol·μmol−1) × (60 min·h−1) × mg S9 (g tissue)−1: S9 protein content yield 11.4 and 143 mg (g tissue)−1 for small intestine and liver, respectively.
Catalytic efficiency expressed as L h (g tissue)−1.
Kinetic constants for formation of genistein monoglucuronides were obtained from Islam et al. (2014).
Human liver S9 showed G‐7S substrate inhibition at concentration >1 μM; K i = 25 μM.
nd = no detection at specified conditions.
Translation of in vitro oestrogenic activity to in vivo oestrogenicity
PBK model‐based reverse dosimetry was carried out to predict in vivo oestrogenic responses upon exposure to genistein and genistin by relating the in vitro effect to plasma concentrations of genistein aglycone based on the methods described by Louisse et al. (2015) and Strikwold et al. (2013). The metric used for making the link between the in vitro and in vivo data in the PBK model was the plasma concentration. One could imagine that using actual tissue concentrations for potential target tissues would provide an even more refined approach. However, data on genistein levels in target tissues, needed to validate such values, are currently lacking. Furthermore, it can be expected that using the plasma concentration to model the exposure of cells in target tissues is in line with the in vitro model used to quantify the effects, since in the in vitro models, cells are exposed to genistein in the culture medium. We considered the plasma Cmax as relevant parameter for these conversions to predict dose dependent in vivo oestrogenic responses to genistein or genistin, because interaction of phytoestrogens with ERs is a short‐term effect. Furthermore, in vivo oestrogenicity of genistein and genistin will especially depend on plasma concentrations of the free aglycone since its phase II metabolites have been shown to exert no oestrogenic response in ERα‐positive MCF‐7 and T47D breast cancer cells (Yuan et al., 2012a; Islam et al., 2015). Even though genistein monoglucuronides were reported to moderately bind to recombinant human ERα and ERβ, this binding appears not to result in efficient transcriptional activation of both ERs as shown in yeast cells carrying human ERs (Kinjo et al., 2004). For translation, available concentration–response curves for in vitro oestrogenic activities of genistein available in literature were used, including concentration–response curves for (i) binding of genistein to human ERα and ERβ (Kuiper et al., 1998; Maggiolini et al., 2001; Han et al., 2002; Kinjo et al., 2004; Matsumura et al., 2005), (ii) genistein‐induced ERα and ERβ‐mediated gene expression in U2OS reporter gene assays (van der Woude et al., 2005; Sotoca et al., 2008; Djiogue et al., 2010; Islam et al., 2015) and (iii) genistein‐stimulated cell proliferation in ERα‐positive MCF‐7 and T47D breast cancer cells (Makela et al., 1994; Wang et al., 1996; Hsieh et al., 1998; Maggiolini et al., 2001; Han et al., 2002; Kinjo et al., 2004; Murata et al., 2004; Matsumura et al., 2005; Kuruto‐Niwa et al., 2007; Sotoca et al., 2008; Rajah et al., 2009; Yuan et al., 2012a; Islam et al., 2015).
Before making the in vitro to in vivo translation, it is of importance to realize that only the free fraction of the chemical will exert the effects, which implies that a correction is required for the binding of genistein to protein and lipid. This correction was made to take into account differences in albumin and lipid concentrations between in vitro and in vivo conditions. The binding of genistein to human ERα and ERβ was obtained from in vitro assays containing no protein and lipid, thus assumed 100% availability in vitro. In this case, each nominal in vitro effect concentration (ECin vitro) of genistein aglycone for the binding activity was extrapolated to an in vivo effect concentration (ECin vivo) by dividing the ECin vitro with free fraction (fu) of genistein in vivo. The fuin vivo of genistein in human plasma was estimated to be 0.03 (Table 1). For other oestrogenic responses, including genistein induced ERα and ERβ‐mediated gene expression and stimulated cell proliferation, each ECin vitro of genistein aglycone was extrapolated to an ECin vivo according to the extrapolation rule of Gülden and Seibert (2003).
| (12) |
where fbin vitro is the fraction of chemical bound to protein and lipid in culture medium, which is calculated from 1 – fuin vitro. V′L is the lipid fraction in serum and in vitro. P is the protein content in plasma serum and culture medium.
For the extrapolation, in vivo plasma albumin and lipid concentrations of 600 μM and 6 g·L−1 were used (Gülden and Seibert, 2003). The albumin and lipid concentrations in culture medium of the reported in vitro bioassays were estimated from the reported data by Gülden et al. (2002) that indicate that 5% FBS contains 18 μM BSA and 0.1 g·L−1 lipid. The fuin vitro of genistein in in vitro medium was estimated using the reported binding constant of genistein to BSA of 1.3 × 10⁴ M−1 and a binding site number of 0.9 (Shi and Cao, 2011). The numerical values of 18, 27 and 36 for Pin vitro, 0.1, 0.15 and 0.2 g·L−1 for V′L,in vitro, 0.17, 0.24 and 0.30 for fbin vitro were estimated for culture medium containing 5, 7.5 and 10% FBS respectively.
All individual data from the whole in vitro concentration–response curves were extrapolated to the in vivo concentration–response curves by correcting for differences in protein and lipid contents between the in vitro conditions and the in vivo situation. Each in vivo concentration was set equal to the plasma Cmax of genistein aglycone in the PBK model. The PBK model was subsequently used to calculate the corresponding oral dose levels in humans to derive the in vivo dose–response curves. The central and the 95% lower and upper confidence limit of the obtained in vivo dose–response curves were estimated and digitalized using GraphPad Prism version 5.04 (GraphPad Software, San Diego, CA, USA). The digitized data thus obtained were subsequently used to derive the benchmark dose for 5% response (BMD05) values based on the default benchmark response for continuous data (EFSA, 2009). The BMD05 values were estimated by fitting to the Hill model, using Benchmark Dose Software version 2.6.0.1 (The Environmental Protection Agency's, USA). The BMD05 values obtained for oestrogenic responses of genistein were evaluated against reported active (Petrakis et al., 1996; Niculescu et al., 2007; Khan et al., 2012; van der Velpen et al., 2014) and inactive (Hargreaves et al., 1999; Sartippour et al., 2004; van der Velpen et al., 2013; Wu et al., 2015) dose levels of genistein on oestrogenicity in humans as taken from the literature and summarized in Table 2.
Table 2.
Human studies on oestrogen‐responsive effects of genistein used to evaluate the in vivo BMD05 values predicted based on in vitro oestrogenic concentration response data for genistein
| Study | Volunteers | Oral form | Genistein dose (mg kg−1 day−1)a | Experimental period | Oestrogenic responsive endpoint | Reference |
|---|---|---|---|---|---|---|
| Active in vivo dose levels | ||||||
| Van der Velpen et al. | Healthy postmenopausal women | Isoflavone supplement | 0.23 | 2 months | Significant change in the expression of 4.4–7.0% of the oestrogen responsive genes in adipose tissue | (van der Velpen et al., 2014) |
| Isoflavone supplement | 0.61 | |||||
| Khan et al. | Healthy postmenopausal women | Soy supplement | 2.14 | 6 months | Significant increase in the expression of oestrogen responsive genes in breast tissue | (Khan et al., 2012) |
| Niculescu et al. | Healthy postmenopausal women | Soy supplement | 8 | 3 months | Significant change in the expression of 27 oestrogen responsive genes in peripheral lymphocytes | (Niculescu et al., 2007) |
| Petrakis et al. | Healthy premenopausal women | Soy protein | 0.54 | – | Weak oestrogenic stimulating effects (an increase in secretion of breast fluid and an appearance of hyperplasic epithelial cells) | (Petrakis et al., 1996) |
| Inactive in vivo dose levels | ||||||
| Van der Velpen et al. | Healthy postmenopausal women | Isoflavone supplement | 0.17 | 2 months | No significant change in the expression of ER target genes and a gene set related to ER signalling in peripheral blood mononuclear cells | (van der Velpen et al., 2013) |
| Wu et al. | Breast cancer patients | Isoflavone supplement | 0.08 | 12 months | No significant changes in breast tissue density based on FGV%b and MD%b | (Wu et al., 2015) |
| Hargreaves et al. | Benign or malignant breast disease patients | Soy supplement | 0.32c | 14 days | No changes in normal breast epithelial cell proliferation | (Hargreaves et al., 1999) |
| Sartippour et al. | Breast cancer patients | Isoflavone supplement | 1.43d | 23 days | No significant change in breast cancer cell proliferation and endothelial cells | (Sartippour et al., 2004) |
For a 70 kg person.
FGV, fibroglandular tissue volume; MD, mammographic density.
60 mg soy contained 45 mg isoflavones was assumed to contain 50% genistein (22.5 mg genistein).
200 mg isoflavone was assumed to contain 50% genistein (100 mg genistein).
Materials
Pooled mixed‐gender human small intestine and liver S9 fractions were purchased from Xenotech (Lenexa, USA). UDPGA (purity 98%), PAPS (purity 65%), Tris, alamethicin (from Trichoderma viride), D‐saccharic acid 1,4‐lactone monohydrate and β‐glucuronidase/sulfatase (from Helix pomatia) were purchased from Sigma‐Aldrich (Steinheim, Germany). Hydrochloric acid (fuming 37%), magnesium chloride, trifluoroacetic acid (for spectroscopy) and DMSO (99.9%) were purchased from VWR International (Darmstadt, Germany). Acetonitrile (chromatography grade) was purchased from Biosolve (Valkenswaard, The Netherlands). Genistein (>99%) was purchased from LC Laboratories (Woburn, MA, USA). G‐7G was purchased from Extrasynthese (Geny, France). G‐7S, G‐4′G, genistein‐4′,7‐O‐diglucuronide (G‐4′7diG) and genistein‐7‐O‐glucuronide‐4′‐O‐sulfate (G‐7G‐4′S) were purchased from Toronto Research Chemicals (Toronto, Canada).
Nomenclature of targets and ligands
Key protein targets and ligands in this article are hyperlinked to corresponding entries in http://www.guidetopharmacology.org, the common portal for data from the IUPHAR/BPS Guide to PHARMACOLOGY (Southan et al., 2016), and are permanently archived in the Concise Guide to PHARMACOLOGY 2015/16 (Alexander et al., 2015).
Results
Enzymatic conjugation of genistein and genistein mono‐conjugates in incubations with pooled human tissue fractions
Analysis of the glucuronidation of G‐7G, G‐4′G and G‐7S in incubations with pooled human tissue fractions revealed that all three substrates were metabolized by pooled human small intestine S9, while pooled human liver S9 only metabolized G‐4′G. The metabolite formed in incubations with G‐7G and G‐4′G coeluted with and showed similar spectral characteristics as commercially available G‐4′7diG and was thus identified as G‐4′7diG. The metabolite formed in glucuronidation incubations with G‐7S with a retention time of 2 min was identified by treating the unterminated samples with β‐glucuronidase/sulfatase resulting in a complete disappearance of the respective peak and a concomitant equivalent increase in the peak area of genistein aglycone (data not shown), confirming it to be a glucuronidated conjugate of G‐7S. This metabolite was most likely G‐7S‐4′G because conjugation of flavonoids is most likely to occur at free OH positions (Argikar, 2012).
Analysis of the sulfation incubations revealed that human small intestine and liver S9 could metabolize genistein and G‐7G, whereas sulfation of G‐4′G was only observed in incubations with human liver S9. At the specified conditions in the present study, only one sulfated metabolite was formed in the incubations with genistein. The formed metabolite coeluted with and showed similar spectral characteristics as commercially available G‐7S and was thus identified as G‐7S. One metabolite was formed in the sulfation incubations with G‐7G. The formed metabolite coeluted with and showed similar spectral characteristics as commercially available G‐7G‐4′S and was thus identified as G‐7G‐4′S. The metabolite formed in sulfation incubations with G‐4′G with a retention time of 2 min was identified by treating the unterminated samples with β‐glucuronidase/sulfatase resulting in a complete disappearance of the respective peak and a concomitant equivalent increase in the peak area of genistein aglycone (data not shown), confirming it to be a sulfated conjugate of G‐4′G. This metabolite was most likely G‐4′G‐7S because conjugation of flavonoid is most likely at free OH positions (Argikar, 2012).
Kinetic constants for formation of genistein mono‐ and di‐conjugates
The concentration‐dependent rates of glucuronidation and sulfation of genistein, G‐7G, G‐4′G and G‐7S by human small intestine and liver S9 fractions are shown in the Supporting Information Figure S1. The kinetic constants for formation of all metabolites derived from these results are summarized in Table 3. The results showed that the total catalytic efficiency for metabolic conversion of genistein amounted to 2.34 L [h (g tissue)]−1 in liver, which was 7.5‐fold higher than the total catalytic efficiency of 0.31 L [h (g tissue)]−1 for small intestine. Genistein mono‐conjugates especially G‐7G and G‐7S were the major metabolites formed in incubations with both small intestine and liver S9. Formation of G‐7S by human liver S9 showed a strong substrate inhibition at concentration above 1 μM with a K i value of 25 μM. Formation of genistein di‐conjugates was more than 10‐fold less efficient than formation of its respective mono‐conjugates due to a decrease in the V max and an increase in K m values.
PBK model development and evaluation
To define the PBK model for genistein and its glycoside genistin, kinetic parameters for metabolic conversion of genistein to mono‐ and di‐conjugates were obtained from in vitro incubations. Kinetic parameters for excretion via bile, urine and intestinal efflux back to intestinal lumen were obtained by fitting the predicted total genistein in plasma with reported data in humans (Setchell et al., 2001; Hosoda et al., 2008; Hosoda et al., 2010; Hosoda et al., 2011; Yuan et al., 2012b), resulting in an average value of 4, 2 h−1 and 0.1 L·h−1 respectively. Subsequently, the model thus defined was used to predict the plasma kinetics of genistein aglycone and its metabolites. The results showed that 4 out of 10 predictions on plasma Cmax and AUC of genistein aglycone were within twofold deviation from the reported human plasma data, whereas the rest of the predictions were within three to eightfold deviations (Figure 3A, B). Furthermore, the model also adequately predicted metabolic plasma profiles of genistein metabolites within one to twofold deviation from the reported metabolic plasma profiles in humans in 9 out of 12 predictions, and the rest of the predictions were within threefold (Figure 3C).
Figure 3.
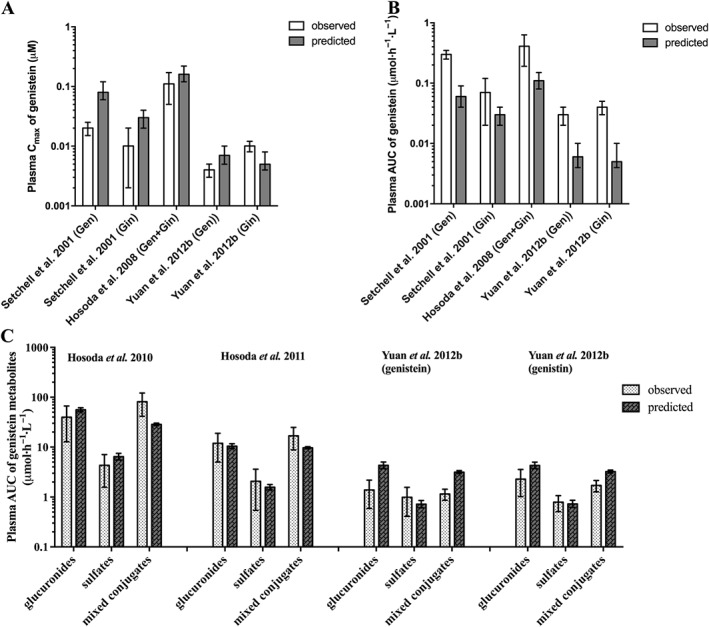
Comparison of the PBK model‐based predicted and experimentally reported data on (A) plasma Cmax and (B) plasma AUC of genistein aglycone and of (C) the metabolic plasma profile of genistein in humans. The in vivo data come from Setchell et al. (2001) at a dose of 0.71 mg kg−1 genistein or 0.71 mg kg−1 genistin, Hosoda et al. (2008) at a dose of 0.92 mg kg−1 genistein and 0.86 mg kg−1 genistin, Hosoda et al. (2010) at a dose of 0.92 mg kg−1 genistein and 0.76 mg kg−1 genistin, Hosoda et al. (2011) at a dose of 0.18 mg kg−1 genistein and 0.15 mg kg−1 genistin and Yuan et al. (2012b) at a dose of 0.13 mg kg−1 genistein or 0.21 mg kg−1 genistin: Gen = genistein, Gin = genistin, glucuronides = sum of genistein mono‐ and diglucuronides, sulfates = sum of genistein monosulfates and mixed conjugates = sum of genistein metabolites containing glucuronide and sulfate moieties. Data reflect the observed and predicted population mean and standard deviation (the latter representing interindividual human variation obtained from 10 000 simulations).
The performance of the newly defined PBK model was evaluated by comparing the predicted amounts of genistein metabolites excreted in urine against reported data in humans for excretion of genistein metabolites in urine (Hosoda et al., 2011; Yuan et al., 2012b). The results revealed that the model adequately predicted six out of nine predictions on the amount of genistein metabolites excreted in urine within twofold deviation from the reported urinary profiles of genistein metabolites in humans (Hosoda et al., 2011; Yuan et al., 2012b); the rest of the predictions were within three to ninefold (Figure 4). These results also indicate that the model adequately predicted the kinetics of genistein in humans.
Figure 4.
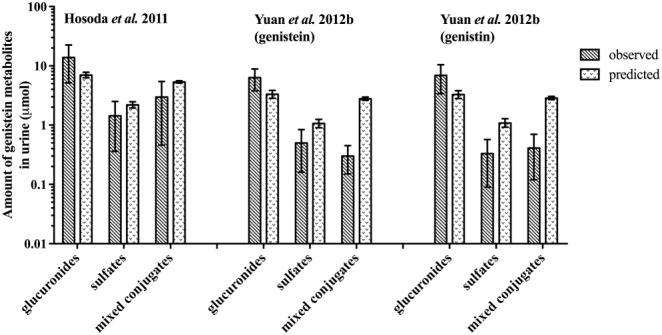
Model evaluation by comparison of the predicted urinary profiles of genistein metabolites against urinary profiles of genistein metabolites in humans as reported by Hosoda et al. (2011) at a dose of 0.18 mg kg−1 genistein and 0.15 mg kg−1 genistin and by Yuan et al. (2012b) at a dose of 0.13 mg kg−1 genistein or 0.21 mg kg−1 genistin: Gen = genistein, Gin = genistin, glucuronides = sum of genistein mono‐ and diglucuronides, sulfates = sum of genistein monosulfates and mixed conjugates = sum of genistein metabolites containing glucuronide and sulfate moieties. Data reflect the observed and predicted population mean and standard deviation (the latter representing interindividual human variation obtained from 10 000 simulations).
To further evaluate the performance of the newly defined model, a sensitivity analysis was performed to assess key parameters that influence the predicted plasma Cmax of genistein aglycone at oral doses of 0.5 and 7 mg kg−1 genistein/genistin (expressed in genistein equivalents), representing an average Asian dietary (Rietjens et al., 2013) and a supplementary intake of genistein/genistin (EFSA, 2015). Only parameters that had a normalized SC higher than 0.1 (in absolute value) as cut‐off value are displayed in Supporting Information Figure S2. When consumed as aglycone, the most influential physiological and physico‐chemical parameters for the predicted plasma Cmax of genistein aglycone are the body weight, the volumes of the small intestine and liver, the cardiac output, the regional blood flow through the small intestine and rapidly perfused tissues, the small intestine tissue : blood partition coefficient of genistein, the uptake rate constant and the blood/plasma ratio (expressing normalized SCs between 0.3 and 1.0 in absolute value). The predicted plasma Cmax of genistein aglycone is also markedly affected by the parameters that influence the formation of G‐7G and G‐7S including the S9 protein yield in the small intestine and liver and the kinetic constants for formation of G‐7G and G‐7S in the small intestine and liver (expressing normalized SCs between 0.2 and 1.20 in absolute value). As the dose increases, the kinetic parameters for formation of G‐7G and G‐7S in the small intestine become less influential and the kinetics for formation of G‐7G in the liver become the most influential kinetic parameters at high dose. These results point at saturation of metabolism at high oral doses in the intestine. When consumed as its glycoside genistin, the predicted plasma Cmax of genistein aglycone are influenced by similar parameters and in a similar manner with additional influential parameters including the volume of the intestinal lumen and the hydrolytic clearance of genistin (expressing normalized SCs of approximately 0.4 in absolute value). Overall, the result of the sensitivity analysis suggests that the accuracy model predictions will largely depend on the uncertainties in the estimates of the different conjugation reactions, which were estimated in the current study based on in vitro metabolic data. In addition, the results also indicate that genetic and lifestyle factors that influence the expression and/or activity of conjugating enzymes can significantly influence the plasma concentration of genistein aglycone in individual human subjects.
PBK model predictions of metabolic plasma profiles of genistein
The PBK model was used to simulate the dose‐dependent plasma concentration of genistein and its metabolites at different oral dose levels. The results obtained revealed that G‐7G was predicted to be the major circulating metabolite of genistein with a plasma Cmax of 0.03–343 μM at oral doses ranging from 0.01 to 50 mg kg−1 genistein, contributing to 40–82% of the total plasma genistein concentrations (genistein plus metabolites) (Figure 5A). G‐7S and G‐4′G‐7S were predicted to be the second and the third most prevalent circulating metabolites of genistein with a plasma Cmax of 3.2–0.03 and 8.9–0.01 μM accounting for 35–0.7 and 18–1.8% of the total plasma genistein concentrations at an oral dose up to 8 mg kg−1genistein, respectively. At the higher doses, the relative contribution of these metabolites decreases, accompanied by a relative increase in the concentration of genistein aglycone, due to the saturation of sulfation reactions at high doses, resulting in relative higher genistein aglycone concentrations in the systemic circulation. The plasma concentrations of genistein aglycone were predicted to be 0.0003–77 μM amounting to 0.5–17% of total plasma genistein concentrations at oral doses ranging from 0.01 to 50 mg kg−1 genistein. When consumed as the glycoside genistin, similar metabolic profiles of genistein in plasma were predicted, requiring approximately 1.3‐fold higher oral dose levels (expressed in genistein equipvalents) to achieve similar plasma concentrations. This is due to the slow release of genistein aglycone from its glycoside genistin that limits the amount of genistein being taken up resulting in lower genistein concentrations in plasma and tissues at equimolar dose levels.
Figure 5.
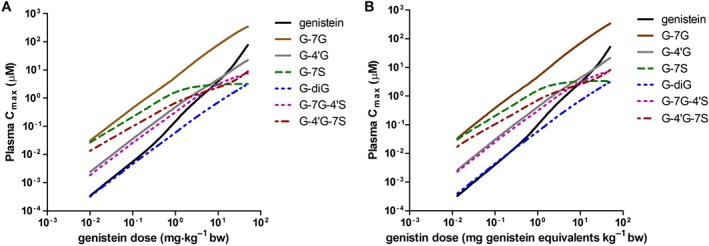
PBK model‐based prediction of dose‐dependent plasma Cmax of genistein and its circulating metabolites at oral doses ranging from 0.01 to 50 mg kg−1 (A) genistein and (B) genistin (expressed in genistein equivalents).
Translation of in vitro concentration–response data for genistein oestrogenicity to in vivo dose–response curves
Using PBK model‐based reverse dosimetry, the in vitro concentration–response curves for oestrogenic responses of genistein were translated to in vivo dose–response curves for the binding of genistein to human ERα and ERβ, genistein‐induced ERα and ERβ‐mediated gene expression and genistein‐stimulated cell proliferation in ERα‐positive breast cancer cells. Figure 6 depicts the translation of the in vitro concentration–response curves to in vivo dose–response curves upon oral intake of genistein (for the curves obtained from these in vitro data for in vivo dose–response curves for oral intake of genistin, see Supporting Information Figure S3). The steps to be taken in this in vitro to in vivo translation can be described as follows, using the binding activity of genistein to ERα as an example. In the first step, all available in vitro data for the binding activity of genistein to human ERα were collected from literature (Kuiper et al., 1998; Maggiolini et al., 2001; Kinjo et al., 2004; Matsumura et al., 2005). This provides the curves presented in the left half of Figure 6, so Figure 6A for in vitro ERα binding of genistein. Secondly, each ECin vitro was extrapolated to an ECin vivo in plasma taking into account the differences in protein and lipid concentration between the in vitro bioassays and the in vivo situations (see Methods). The in vivo plasma concentrations thus obtained were then used as input in the PBK model that was used to predict the corresponding in vivo dose level. These predicted dose levels could then be used to define the in vivo dose–response curve plotting the respective dose levels against the responses detected in the in vitro bioassay. This provides the curves presented in the right half of Figure 6. This was followed by fitting the obtained in vivo dose–response curves to derive the central and the 95% lower and upper confidence limits of the in vivo dose–response curves using GraphPad Prism version 5.04 (GraphPad Software, San Diego, CA, USA). The obtained in vivo dose–response curves were subsequently used to estimate the BMD05 values for oestrogenicity of genistein in humans. In a similar way, the BMD05 values for in vivo oestrogenicity were predicted using PBK model‐based reverse dosimetry to translate in vitro oestrogenic response for ERβ binding (Figure 6B), induction of ERα and ERβ‐mediated gene expression (Figure 6C, D), and ERa‐mediated cell proliferation (Figure 6E).
Figure 6.
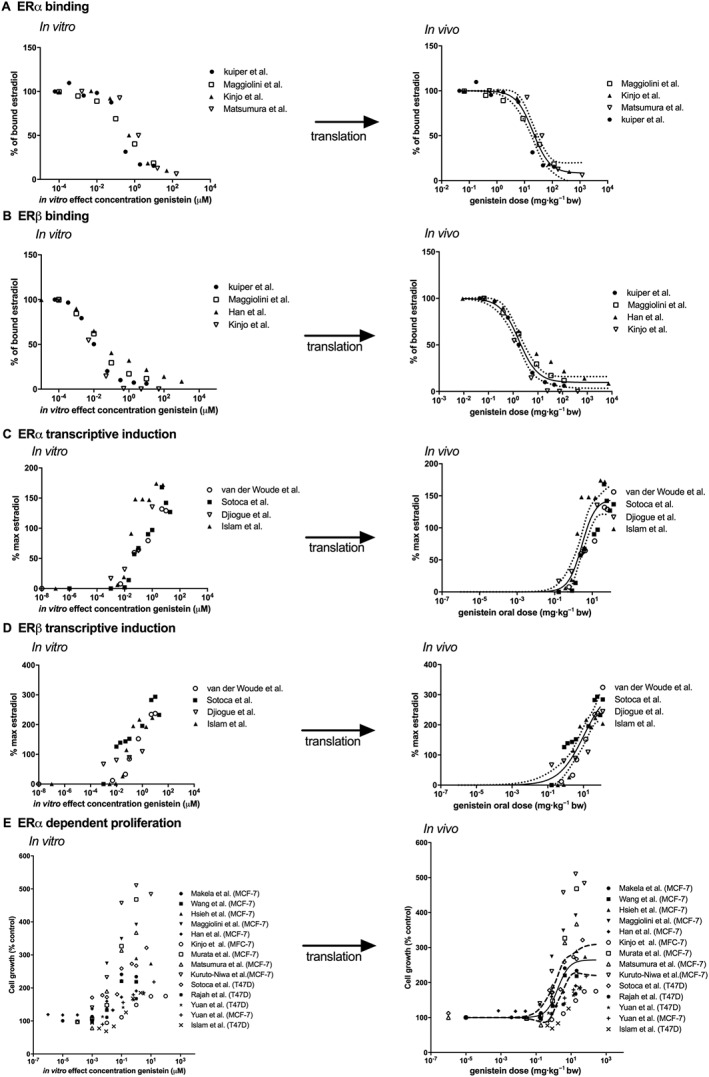
Translation of in vitro oestrogenic concentration–response curves for genistein‐dependent (A) binding to ERα (Kuiper et al., 1998; Maggiolini et al., 2001; Kinjo et al., 2004; Matsumura et al., 2005), (B) binding to ERβ (Kuiper et al., 1998; Maggiolini et al., 2001; Han et al., 2002; Kinjo et al., 2004), (C) ERα‐mediated gene expression in U2OS reporter gene assays (van der Woude et al., 2005; Sotoca et al., 2008; Djiogue et al., 2010; Islam et al., 2015), (D) ERβ‐mediated gene expression in U2OS reporter gene assays (van der Woude et al., 2005; Sotoca et al., 2008; Djiogue et al., 2010; Islam et al., 2015) and (E) ERα‐dependent proliferation of MCF‐7 and T47D breast cancer cells (Makela et al., 1994; Wang et al., 1996; Hsieh et al., 1998; Maggiolini et al., 2001; Han et al., 2002; Kinjo et al., 2004; Murata et al., 2004; Matsumura et al., 2005; Kuruto‐Niwa et al., 2007; Sotoca et al., 2008; Rajah et al., 2009; Yuan et al., 2012a; Islam et al., 2015), to in vivo human genistein dose–response curves using PBK model‐based reverse dosimetry based on plasma Cmax values of genistein aglycone. The solid lines represent the central in vivo dose–response curve, whereas the dashed lines represent the 95% lower and upper confidence limits.
From the results thus obtained, it could be concluded that when consumed as genistein aglycone, the in vivo BMD05 values for ERα binding and induction of ERα‐mediated gene expression based on in vitro data were predicted to occur at an oral dose ranging from 0.12 to 4.39 mg kg−1 genistein with the central oral dose of 2.95 and 0.28 mg kg−1 genistein, respectively. The in vivo BMD05 values for ERβ binding and induction of ERβ‐mediated gene expression based on in vitro data were predicted to occur at an oral dose ranging from 0.09 to 0.32 mg kg−1 genistein with the central oral dose of 0.15 and 0.27 mg kg−1 genistein respectively. The in vivo BMD05 values for oestrogenic response of genistein on ERα‐dependent cell proliferation based on in vitro data were predicted to occur at an oral dose ranging from 0.06 to 0.53 mg kg−1 genistein with the central oral dose of 0.3 mg kg−1 genistein. When consumed as the glycoside genistin, the predicted in vivo BMD05 values for oestrogenicity based on in vitro data are approximately 1.3‐fold higher for all in vitro oestrogenic endpoints as compared with the predicted in vivo BMD05 values for consumption as genistein aglycone. This is due to the slow release of genistein aglycone from its glycoside genistin that limits the amount of genistein being taken up and overall lower genistein concentrations in the plasma.
The predicted in vivo BMD05 values for oestrogenic responses based on the in vitro PBK approach were evaluated by comparing the predicted in vivo BMD05 values with the reported active (Petrakis et al., 1996; Niculescu et al., 2007; Khan et al., 2012; van der Velpen et al., 2014) and inactive (Hargreaves et al., 1999; Sartippour et al., 2004; van der Velpen et al., 2013; Wu et al., 2015) dose levels of genistein in studies on oestrogenic responses in humans (Figure 7). The results indicate that the predicted BMD05 values for genistein‐induced ER‐mediated gene expression are in line with reported active dose levels of genistein [0.23–8 mg kg−1] in in vivo studies reporting induction of ER‐mediated gene expression in humans in different tissues (Niculescu et al., 2007; Khan et al., 2012; van der Velpen et al., 2014). Furthermore, an oral dose level of 0.54 mg kg−1 genistein reported to induce a weak oestrogenic response of genistein in humans (Petrakis et al., 1996) also falls in the range of the predicted dose levels for oestrogenicity of genistein. The overview presented in Figure 7 also reflects that studies reporting the absence of effects of genistein in human in vivo studies fall in the same range as the dose levels predicted and observed to have oestrogenic responses. For example, van der Velpen et al. (2013) reported no significant change in the expression ER target genes and gene sets related to ER signalling in peripheral blood mononuclear cells in human at an oral dose of 0.17 mg kg−1 genistein, which is not in line with the predicted dose levels for this oestrogenic response in the present study. This result was also opposite to the result reported by the same authors at a comparable dose regimen in a similar study population of healthy postmenopausal women when analysing expression of oestrogen responsive genes in adipose tissue representing a more likely target tissue than peripheral blood mononuclear cells (van der Velpen et al., 2014). Genistein at dose levels between 0.08 and 1.43 mg kg−1 appeared also to not affect breast tissue density, normal breast epithelial cell proliferation and breast cancer or epithelial cell proliferation in breast cancer patients (Hargreaves et al., 1999; Sartippour et al., 2004; Wu et al., 2015), although these values all fall within the range of in vivo BMD05 values predicted to be active based on ERα‐mediated in vitro cell proliferation [0.03–0.72 mg kg−1 genistein]. The reasons underlying these discrepancies remain to be elucidated but may be related to the endpoint or target tissue studied or the study population (i.e. healthy women versus breast cancer patients) or a possible relatively short duration of the peak in plasma genistein concentration following ingestion of a high genistein oral dose in vivo.
Figure 7.
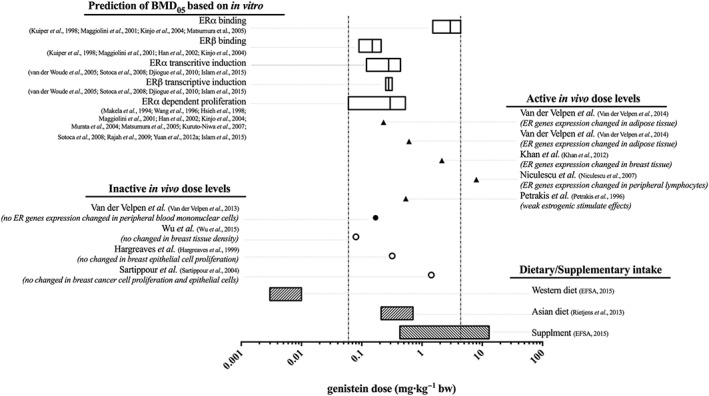
Comparison of the predicted in vivo BMD05 dose levels of genistein based on in vitro oestrogenic data for (i) binding to ERα (Kuiper et al., 1998; Maggiolini et al., 2001; Kinjo et al., 2004; Matsumura et al., 2005), (ii) binding to ERβ (Kuiper et al., 1998; Maggiolini et al., 2001; Han et al., 2002; Kinjo et al., 2004), (iii) ERα‐mediated gene expression in U2OS reporter gene assays (van der Woude et al., 2005; Sotoca et al., 2008; Djiogue et al., 2010; Islam et al., 2015), (iv) ERβ‐mediated gene expression in U2OS reporter gene assays (van der Woude et al., 2005; Sotoca et al., 2008; Djiogue et al., 2010; Islam et al., 2015) and (v) ERα‐dependent proliferation of MCF‐7 and T47D breast cancer cells (Makela et al., 1994; Wang et al., 1996; Hsieh et al., 1998; Maggiolini et al., 2001; Han et al., 2002; Kinjo et al., 2004; Murata et al., 2004; Matsumura et al., 2005; Kuruto‐Niwa et al., 2007; Sotoca et al., 2008; Rajah et al., 2009; Yuan et al., 2012a; Islam et al., 2015) with the reported active (Petrakis et al., 1996; Niculescu et al., 2007; Khan et al., 2012; van der Velpen et al., 2014) and inactive (Hargreaves et al., 1999; Sartippour et al., 2004; van der Velpen et al., 2013; Wu et al., 2015) dose levels of genistein on oestrogenic activity in humans (Table 2) and with a Western (EFSA, 2015) and an Asian (Rietjens et al., 2013) dietary and a supplementary (EFSA, 2015) intake of genistein. The filled symbols present the reported data in healthy women, while the empty symbols present the reported data in breast cancer patients.
The PBK model‐based predicted dose–response curves and in vivo BMD05 values derived from them also revealed that at a Western dietary intake of genistein amounting to 0.003–0.01 mg kg−1 (EFSA, 2015), the plasma Cmax of genistein aglycone would generally not be high enough to induce ER‐mediated gene expression or activities (Figure 7). At an Asian dietary and a supplementary intake of genistein amounting to 0.21–0.71 (Rietjens et al., 2013) and 0.43–13 (EFSA, 2015) mg kg−1, the plasma Cmax of genistein aglycone would be high enough to exert oestrogenic responses induced by both ERα and ERβ‐mediated pathways (Figure 7).
Discussion
The aim of the present study was to develop a PBK model that provides insight in the dose‐dependent plasma concentration of genistein aglycone and its metabolites and enables prediction of the in vivo dose–response curves for oestrogenicity of genistein and genistin in humans based on in vitro concentration–response curves. Evaluation of the PBK model obtained against reported data on plasma and urinary metabolic profiles of genistein revealed that the model could make adequate predictions with deviations that were limited from one to sevenfold. The model predicted that G‐7G was the major plasma metabolite of genistein and that plasma concentrations of free genistein were predicted to be 0.0003–77 μM at oral doses ranging from 0.01 to 50 mg kg−1 genistein, amounting to 0.5–17% of total plasma genistein. PBK model‐based predictions for genistin were overall quite similar with a major difference being 1.3‐fold lower plasma concentration of free genistein at similar dose levels expressed in genistein equivalents. This difference was mainly due to the slow release of genistein aglycone from its glycoside genistin that limits the amount of genistein being taken up resulting in lower genistein concentrations in the plasma.
Upon evaluation, the PBK model was used to convert available in vitro concentration–response curves in bioassays detecting oestrogenicity of genistein to in vivo dose–response curves by reverse dosimetry, in order to better understand in vivo oestrogenic responses upon intake of genistein and genistin. The in vivo dose–response curves obtained were subsequently used to derive in vivo BMD05 dose levels of genistein and genistin, at which the plasma concentration of the genistein aglycone would be high enough to induce 5% oestrogenic response. When consumed as genistein, the in vivo BMD05 values for binding and induction of ERα‐mediated gene expression based on in vitro data were predicted to be at oral doses ranging from 0.12 to 4.39 mg kg−1 genistein. For oestrogen responses on ERβ, the predicted in vivo BMD05 values based on in vitro data were at oral dose ranging from 0.09 to 0.32 mg kg−1 genistein. The in vivo BMD05 values for ERα‐mediated cell proliferation were predicted to be at oral doses ranging from 0.06 to 0.53 mg kg−1 genistein. When consumed as genistin, the predicted in vivo BMD05 values were approximately 1.3‐fold higher as compared with the predicted in vivo BMD05 values when consumed as genistein. This is due to the slow release of genistein aglycone from its glycoside genistin that limits the amount of genistein being taken up resulting in lower genistein concentrations in the plasma. The available in vitro data for ERα‐mediated cell proliferation show large variation (Figure 6E), which might be due to differences between the laboratories where the cells were cultivated as highlighted by Osborne et al. (1987) who reported that even though MFC‐7 cell lines obtained from different laboratories have similar karyotype, they may have unique biological properties.
The predicted in vivo BMD05 values obtained from the PBK model‐based reverse dosimetry were evaluated against the reported oestrogenic responses of genistein in humans available in literature (Figure 7). The results indicated that the prediction of in vivo BMD05 values based on in vitro genistein‐induced ER‐mediated oestrogenicity is in line with the reported active dose levels for these oestrogenic responses in humans in different tissues (Niculescu et al., 2007; Khan et al., 2012; van der Velpen et al., 2014). Furthermore, a dose level of 0.54 mg kg−1 genistein reported to induce weak oestrogenic activity in humans also falls in the range of the predicted dose levels that exert oestrogenic responses. Contradictory, some human intervention studies reported the absence of genistein‐induced ER‐mediated gene expression in peripheral blood mononuclear cells in healthy women (van der Velpen et al., 2013) and no effect on breast tissue density, normal breast epithelial cell proliferation and breast cancer or epithelial cell proliferation in breast cancer patients (Hargreaves et al., 1999; Sartippour et al., 2004; Wu et al., 2015) at the predicted oral dose levels for oestrogenic responses of genistein. The reasons underlying these discrepancies remain to be elucidated but may be related to the endpoint or target tissue studied (adipose tissue or peripheral blood mononuclear cells) or the study population (healthy woman versus breast cancer patients). The difference in the expression of ERα and ERβ between in vitro bioassays and the target tissues studied in the breast cancer patients might result in a difference in the cellular response toward different xenoestrogens as the absolute concentration and ratio of ERα to ERβ within a tissue influence the cellular response toward different xenoestrogens (Sotoca et al., 2008). Breast cancer cell lines like MCF‐7 and T47D present high expression of ERα and very low expression of ERβ (Sotoca et al., 2008; Evers et al., 2013), reflecting what is likely for the tumours but not for healthy breast tissue (Bardin et al., 2004). Given these considerations, it would be of use that human intervention studies on the oestrogenic activity of xenoestrogens should analyse and report the concentration and ratio of ERα and ERβ in the target tissue studied and select a relevant surrogate tissue for the endpoint of interest in order to obtain a better accuracy of the interpretation of the oestrogenic activity of the xenoestrogens in in vivo. Another point to take into consideration is a possible relatively short duration of the peak in plasma genistein concentration following ingestion of a high genistein oral dose in vivo. This brief peak would be likely limited to appear one or two times following the intake. In case the brief peak appeared more than one time, it would affect the prediction made in Figure 7. The predicted oral dose would shift to the right but not to an extent that it would modify the range where the oestrogenic effects would be expected: intake from a regular Western diet would still be below the range where effects are expected while intake from food supplements and an Asian diet would still be within that range.
Based on the predicted in vivo BMD05 values for oestrogenic responses of genistein derived from in vitro data, the plasma Cmax of genistein aglycone at an Asian dietary and a supplementary intake of genistein amounting to 0.21–0.71 (Rietjens et al., 2013) and 0.43–13 (EFSA, 2015) mg kg−1 genistein would be high enough to induce oestrogenic responses in vivo. A Western dietary intake of genistein amounting to 0.003–0.01 mg kg−1 genistein (EFSA, 2015) would generally not be high enough to induce an oestrogenic response.
Considering that the plasma concentration of genistein aglycone is a key parameter determining oestrogenic responses in vivo, any factors that influence this parameter may influence sensitivity to oestrogenic responses in individual human subjects. Based on the sensitivity analysis, the plasma concentration of genistein aglycone is highly influenced by the kinetic constants for formation of G‐7G in the small intestine and liver and the kinetic constants for formation of G‐7S in the liver at low oral dose (at dietary intake levels). Genetic and lifestyle factors influencing the expression and/or activity of conjugating enzymes can therefore be expected to significantly influence the plasma concentration of genistein aglycone in individual human subjects (Boersma et al., 2002). In the present study, this human variation could be captured to some extent by performing Monte Carlo simulations assuming a moderate level of variation in the expression of conjugating enzymes. Aside from the interindividual human variation in conjugation reactions in the small intestine and liver, metabolism of genistein at the site of action may also play a crucial role in the bioavailability of the free aglycone at the target tissues. In the case of breast tissue, expression of β‐glucuronidases (enzymes that deconjugate glucuronidated metabolites to aglycone) (Islam et al., 2015) as well as of UDP‐glucuronosyl transferases (Haakensen et al., 2010) may influence the local concentrations of the free aglycone. The relative conjugation and deconjugation activity in breast tissue is not well studied. At the present state‐of‐the‐art, the current defined PBK model does not yet include such tissue‐specific metabolism of genistein and its metabolites in possible target tissues such as breast tissue, because there is a lack of human data to perform and evaluate this simulation. For further refinement of the predictions by the PBK model‐based reverse dosimetry approach for oestrogenic activity of genistein, the actual interindividual human variation in expression of conjugating enzymes and the possible role of intracellular metabolism at the site of action could be studied to a further extent.
Overall, the present study shows that it is possible to predict dose‐dependent plasma concentrations of genistein and its metabolites and also at what dose levels oestrogenic responses of genistein in humans can be expected, the latter by combining in vitro concentration–response curves with PBK model‐based reverse dosimetry, providing an in vitro‐in silico approach to obtain insights in human dose–response curves without the need for human intervention studies.
Author contributions
R.B. and A.S. performed the research. A.P. and I.R. designed the research study. R.B. analysed the data. R.B., A.P. and I.R. wrote and edited the manuscript.
Conflict of interest
The authors declare no conflicts of interest.
Declaration of transparency and scientific rigour
This Declaration acknowledges that this paper adheres to the principles for transparent reporting and scientific rigour of preclinical research recommended by funding agencies, publishers and other organisations engaged with supporting research.
Supporting information
Table S1 Physiological parameters in human.
Figure S1 Concentration‐dependent formation of genistein mono‐conjugates and genistein diconjugates with pooled mixed‐gender human small intestine S9 (A – E) or liver S9 (F – I): genistein‐7‐O‐glucuronide (G‐7G), genistein‐4′‐O‐glucuronide (G‐4´G), genistein‐7‐O‐sulfate (G‐7S), genistein‐4′,7‐O‐diglucuronide (G‐4′7diG), genistein‐7‐O‐glucuronide‐4′‐O‐sulfate (G‐7G‐4′S), and genistein‐4′‐O‐glucuronide‐7‐O‐sulfate (G‐4´G‐7S).
Figure S2 Sensitivity analysis of the predicted plasma C max of genistein aglycone at an oral dose of 0.5 and 7 mg kg−1 (A) genistein and (B) genistin. The parameters stand for: BW = body weight, VTi = tissue volumn (Ti = I (small intestine), L (liver), BR (breast), R (rapidly perfused tissues), and S (slowly perfused tissues), QC = cardiac output, QTi = reginal blood flow through tissue, PTiG = partition coefficient of genistein in tissue, K a = uptake rate constant of genistein, R = blood to plasma ratio, S9PI = small intestinal S9 protein content, S9PL = liver S9 protein content, V max and K m = the maximum rate of formation and the Michaelis–Menten constant for formation of genistein‐7‐O‐glucuronide (G7G) and genistein‐7‐O‐sulfate (G7S).
Figure S3 Translation of in vitro oestrogenic concentration–response curves for genistein dependent (A) binding to ERα (Kuiper et al., 1998; Maggiolini et al., 2001; Kinjo et al., 2004; Matsumura et al., 2005), (B) binding to ERβ (Kuiper et al., 199; Maggiolini et al., 2001; Han et al., 2002; Kinjo et al., 2004), (C) ERα mediated gene expression in U2OS reporter gene assays (van der Woude et al., 2005; Sotoca et al., 2008; Djiogue et al., 2010; Islam et al., 2015), (D) ERβ mediated gene expression in U2OS reporter gene assays (van der Woude et al., 2005; Sotoca et al., 2008; Djiogue et al., 2010; Islam et al., 2015), and (E) ERα dependent proliferation of MCF‐7 and T47D breast cancer cells (Makela et al., 1994; Wang et al., 1996; Hsieh et al., 1998; Maggiolini et al., 2001; Han et al., 2002; Kinjo et al., 2004; Murata et al., 2004; Matsumura et al., 2005; Kuruto‐Niwa et al., 2007; Sotoca et al., 2008; Rajah et al., 2009; Yuan et al., 2012a,b; Islam et al., 2015), to in vivo human genistin dose–response curves using PBK model based reverse dosimetry based on plasma Cmax values of genistein aglycone. The solid lines represent the central in vivo dose–response curve, whereas the dashed lines represent the 95% lower and upper confidence limits.
Acknowledgements
This research was financially supported by the Ministry of Science and Technology of Thailand through a Royal Thai Government Scholarship awarded to Rungnapa Boonpawa for conducting her PhD in The Netherlands.
Boonpawa, R. , Spenkelink, A. , Punt, A. , and Rietjens, I. M. C. M. (2017) In vitro‐in silico‐based analysis of the dose‐dependent in vivo oestrogenicity of the soy phytoestrogen genistein in humans. British Journal of Pharmacology, 174: 2739–2757. doi: 10.1111/bph.13900.
References
- Alexander SPH, Cidlowski JA, Kelly E, Marrion N, Peters JA, Benson HE et al. (2015). The Concise Guide to PHARMACOLOGY 2015/16: Nuclear hormone receptors. Br J Pharmacol 172: 5956–5978. [DOI] [PMC free article] [PubMed] [Google Scholar]
- Argikar UA (2012). Unusual Glucuronides. Drug Metab Dispos 40: 1239–1251. [DOI] [PubMed] [Google Scholar]
- Bardin A, Boulle N, Lazennec G, Vignon F, Pujol P (2004). Loss of ERβ expression as a common step in estrogen‐dependent tumor progression. Endocr Relat Cancer 11: 537–551. [DOI] [PMC free article] [PubMed] [Google Scholar]
- Boersma MG, van der Woude H, Bogaards J, Boeren S, Vervoort J et al. (2002). Regioselectivity of phase II metabolism of luteolin and quercetin by UDP‐glucuronosyl transferases. Chem Res Toxicol 15: 662–670. [DOI] [PubMed] [Google Scholar]
- Bokkenheuser VD, Shackleton CH, Winter J (1987). Hydrolysis of dietary flavonoid glycosides by strains of intestinal Bacteroides from humans. Biochem J 248: 953–956. [DOI] [PMC free article] [PubMed] [Google Scholar]
- Boonpawa R, Spenkelink A, Rietjens IMCM, Punt A (2014). A physiologically based kinetic (PBK) model describing plasma concentrations of quercetin and its metabolites in rats. Biochem Pharmacol 89: 287–299. [DOI] [PubMed] [Google Scholar]
- Boonpawa R, Moradi N, Spenkelink A, Rietjens IMCM, Punt A (2015). Use of physiologically based kinetic (PBK) modeling to study interindividual human variation and species differences in plasma concentrations of quercetin and its metabolites. Biochem Pharmacol 98: 690–702. [DOI] [PubMed] [Google Scholar]
- Brown RP, Delp MD, Lindstedt SL, Rhomberg LR, Beliles RP (1997). Physiological parameter values for physiologically based pharmacokinetic models. Toxicol Ind Health 13: 407–484. [DOI] [PubMed] [Google Scholar]
- Cassidy A, Brown JE, Hawdon A, Faughnan MS, King LJ et al. (2006). Factors affecting the bioavailability of soy isoflavones in humans after ingestion of physiologically relevant levels from different soy foods. J Nutr 136: 45–51. [DOI] [PubMed] [Google Scholar]
- Covington TR, Robinan Gentry P, Van Landingham CB, Andersen ME, Kester JE et al. (2007). The use of Markov chain Monte Carlo uncertainty analysis to support a Public Health Goal for perchloroethylene. Regul Toxicol Pharmacol 47: 1–18. [DOI] [PubMed] [Google Scholar]
- DeJongh J, Verhaar HJM, Hermens JLM (1997). A quantitative property‐property relationship (QPPR) approach to estimate in vitro tissue‐blood partition coefficients of organic chemicals in rats and humans. Arch Toxicol 72: 17–25. [DOI] [PubMed] [Google Scholar]
- Djiogue S, Njamen D, Halabalaki M, Kretzschmar G, Beyer A et al. (2010). Estrogenic properties of naturally occurring prenylated isoflavones in U2OS human osteosarcoma cells: Structure–activity relationships. J Steroid Biochem Mol Biol 120: 184–191. [DOI] [PubMed] [Google Scholar]
- EFSA (2009). Guidance of the Scientific Committee on a request from EFSA on the use of the benchmark dose approach in risk assessment. EFSA J 1150: 1–72. [Google Scholar]
- EFSA (2015). Risk assessment for peri‐ and post‐menopausal women taking food supplements containing isolated isoflavones. EFSA J 13 4246 [page 4342]. [Google Scholar]
- Evans MV, Andersen ME (2000). Sensitivity analysis of a physiological model for 2,3,7,8‐tetrachlorodibenzo‐p‐dioxin (TCDD): assessing the impact of specific model parameters on sequestration in liver and fat in the rat. Toxicol Sci 54: 71–80. [DOI] [PubMed] [Google Scholar]
- Evers NM, van de Klundert TMC, van Aesch YM, Wang S, de Roos WK et al. (2013). Human T47D‐ERβ breast cancer cells with tetracycline‐dependent ERβ expression reflect ERα/ERβ ratios in rat and human breast tissue. Toxicol In Vitro 27: 1753–1761. [DOI] [PubMed] [Google Scholar]
- Gülden M, Seibert H (2003). In vitro–in vivo extrapolation: estimation of human serum concentrations of chemicals equivalent to cytotoxic concentrations in vitro . Toxicology 189: 211–222. [DOI] [PubMed] [Google Scholar]
- Gülden M, Mörchel S, Tahan S, Seibert H (2002). Impact of protein binding on the availability and cytotoxic potency of organochlorine pesticides and chlorophenols in vitro. Toxicology 175: 201–213. [DOI] [PubMed] [Google Scholar]
- Haakensen VD, Biong M, Lingjærde OC, Holmen MM, Frantzen JO et al. (2010). Expression levels of uridine 5′‐diphospho‐glucuronosyltransferase genes in breast tissue from healthy women are associated with mammographic density. Breast Cancer Res 12: 1–11. [DOI] [PMC free article] [PubMed] [Google Scholar]
- Han D‐H, Denison MS, Tachibana H, Yamada K (2002). Relationship between estrogen receptor‐binding and estrogenic activities of environmental estrogens and suppression by flavonoids. Biosci Biotechnol Biochem 66: 1479–1487. [DOI] [PubMed] [Google Scholar]
- Hargreaves DF, Potten CS, Harding C, Shaw LE, Morton MS et al. (1999). Two‐week dietary soy supplementation has an estrogenic effect on normal premenopausal breast. J Clin Endocrinol Metabol 84: 4017–4024. [DOI] [PubMed] [Google Scholar]
- Hosoda K, Furuta T, Ishii K (2011). Metabolism and disposition of isoflavone conjugated metabolites in humans after ingestion of kinako. Drug Metab Dispos 39: 1762–1767. [DOI] [PubMed] [Google Scholar]
- Hosoda K, Furuta T, Yokokawa A, Ishii K (2010). Identification and quantification of daidzein‐7‐glucuronide‐4′‐sulfate, genistein‐7‐glucuronide‐4′‐sulfate and genistein‐4′,7‐diglucuronide as major metabolites in human plasma after administration of kinako. Anal Bioanal Chem 397: 1563–1572. [DOI] [PubMed] [Google Scholar]
- Hosoda K, Furuta T, Yokokawa A, Ogura K, Hiratsuka A et al. (2008). Plasma profiling of intact isoflavone metabolites by high‐performance liquid chromatography and mass spectrometric identification of flavone glycosides daidzin and genistin in human plasma after administration of kinako. Drug Metab Dispos 36: 1485–1495. [DOI] [PubMed] [Google Scholar]
- Hsieh C‐Y, Santell RC, Haslam SZ, Helferich WG (1998). Estrogenic effects of genistein on the growth of estrogen receptor‐positive human breast cancer (MCF‐7) cells in vitro and in vivo . Cancer Res 58: 3833–3838. [PubMed] [Google Scholar]
- Hwang CS, Kwak HS, Lim HJ, Lee SH, Kang YS et al. (2006). Isoflavone metabolites and their in vitro dual functions: they can act as an estrogenic agonist or antagonist depending on the estrogen concentration. J Steroid Biochem Mol Biol 101: 246–253. [DOI] [PubMed] [Google Scholar]
- Islam MA, Punt A, Spenkelink B, Murk AJ, Rolaf van Leeuwen FX et al. (2014). Conversion of major soy isoflavone glucosides and aglycones in in vitro intestinal models. Mol Nutr Food Res 58: 503–515. [DOI] [PubMed] [Google Scholar]
- Islam MA, Bekele R, Vanden Berg JHJ, Kuswanti Y, Thapa O et al. (2015). Deconjugation of soy isoflavone glucuronides needed for estrogenic activity. Toxicol In Vitro 29: 706–715. [DOI] [PubMed] [Google Scholar]
- Khan SA, Chatterton RT, Michel N, Bryk M, Lee O et al. (2012). Soy isoflavone supplementation for breast cancer risk reduction: a randomized phase II trial. Cancer Prev Res 5: 309–319. [DOI] [PMC free article] [PubMed] [Google Scholar]
- Kinjo J, Tsuchihashi R, Morito K, Hirose T, Aomori T et al. (2004). Interactions of phytoestrogens with estrogen receptors α and β (III). Estrogenic activities of soy isoflavone aglycones and their metabolites isolated from human urine. Biol Pharm Bull 27: 185–188. [DOI] [PubMed] [Google Scholar]
- Kuiper GG, Lemmen JG, Carlsson B, Corton JC, Safe SH et al. (1998). Interaction of estrogenic chemicals and phytoestrogens with estrogen receptor beta. Endocrinology 139: 4252–4263. [DOI] [PubMed] [Google Scholar]
- Kuruto‐Niwa R, Ito T, Goto H, Nakamura H, Nozawa R et al. (2007). Estrogenic activity of the chlorinated derivatives of estrogens and flavonoids using a GFP expression system. Environ Toxicol Pharmacol 23: 121–128. [DOI] [PubMed] [Google Scholar]
- Lee H‐R, Kim T‐H, Choi K‐C (2012). Functions and physiological roles of two types of estrogen receptors, ERα and ERβ, identified by estrogen receptor knockout mouse. Lab Anim Res 28: 71–76. [DOI] [PMC free article] [PubMed] [Google Scholar]
- Louisse J, Bosgra S, Blaauboer B, Rietjens IMCM, Verwei M (2015). Prediction of in vivo developmental toxicity of all‐trans‐retinoic acid based on in vitro toxicity data and in silico physiologically based kinetic modeling. Arch Toxicol 89: 1135–1148. [DOI] [PubMed] [Google Scholar]
- Maggiolini M, Bonofiglio D, Marsico S, Panno ML, Cenni B et al. (2001). Estrogen receptor α mediates the proliferative but not the cytotoxic dose‐dependent effects of two major phytoestrogens on human breast cancer cells. Mol Pharmacol 60: 595–602. [PubMed] [Google Scholar]
- Makela S, Davis VL, Tally WC, Korkman J, Salo L et al. (1994). Dietary estrogens act through estrogen receptor‐mediated processes and show no antiestrogenicity in cultured breast cancer cells. Environ Health Perspect 102: 572–578. [DOI] [PMC free article] [PubMed] [Google Scholar]
- Matsumura A, Ghosh A, Pope GS, Darbre PD (2005). Comparative study of oestrogenic properties of eight phytoestrogens in MCF7 human breast cancer cells. J Steroid Biochem Mol Biol 94: 431–443. [DOI] [PubMed] [Google Scholar]
- Morito K, Hirose T, Kinjo J, Hirakawa T, Okawa M et al. (2001). Interaction of phytoestrogens with estrogen receptors alpha and beta. Biol Pharm Bull 24: 351–356. [DOI] [PubMed] [Google Scholar]
- Murata M, Midorikawa K, Koh M, Umezawa K, Kawanishi S (2004). Genistein and daidzein induce cell proliferation and their metabolites cause oxidative DNA damage in relation to isoflavone‐induced cancer of estrogen‐sensitive organs. Biochemistry 43: 2569–2577. [DOI] [PubMed] [Google Scholar]
- Niculescu MD, Pop EA, Fischer LM, Zeisel SH (2007). Dietary isoflavones differentially induce gene expression changes in lymphocytes from postmenopausal women who form equol as compared with those who do not. J Nutr Biochem 18: 380–390. [DOI] [PMC free article] [PubMed] [Google Scholar]
- Oleson L, Court MH (2008). Effect of the β‐glucuronidase inhibitor saccharolactone on glucuronidation by human tissue microsomes and recombinant UDP‐glucuronosyltransferases (UGTs). J Pharm Pharmacol 60: 1175–1182. [DOI] [PMC free article] [PubMed] [Google Scholar]
- Osborne CK, Hobbs K, Trent JM (1987). Biological differences among MCF‐7 human breast cancer cell lines from different laboratories. Breast Cancer Res Treat 9: 111–121. [DOI] [PubMed] [Google Scholar]
- Paterni I, Granchi C, Katzenellenbogen JA, Minutolo F (2014). Estrogen receptors alpha (ERα) and beta (ERβ): subtype‐selective ligands and clinical potential. Steroids 0: 13–29. [DOI] [PMC free article] [PubMed] [Google Scholar]
- Petrakis NL, Barnes S, King EB, Lowenstein J, Wiencke J et al. (1996). Stimulatory influence of soy protein isolate on breast secretion in pre‐ and postmenopausal women. Cancer Epidemiol Biomarkers Prev 5: 785–794. [PubMed] [Google Scholar]
- Rajah TT, Du N, Drews N, Cohn R (2009). Genistein in the presence of 17β‐estradiol inhibits proliferation of ERβ breast cancer cells. Pharmacology 84: 68–73. [DOI] [PubMed] [Google Scholar]
- Rietjens IMCM, Sotoca AM, Vervoort J, Louisse J (2013). Mechanisms underlying the dualistic mode of action of major soy isoflavones in relation to cell proliferation and cancer risks. Mol Nutr Food Res 57: 100–113. [DOI] [PubMed] [Google Scholar]
- Sartippour MR, Rao JY, Apple S, Wu D, Henning S et al. (2004). A pilot clinical study of short‐term isoflavone supplements in breast cancer patients. Nutr Cancer 49: 59–65. [DOI] [PubMed] [Google Scholar]
- Setchell KDR, Brown NM, Desai P, Zimmer‐Nechemias L, Wolfe BE et al. (2001). Bioavailability of pure isoflavones in healthy humans and analysis of commercial soy isoflavone supplements. J Nutr 131: 1362S–1375S. [DOI] [PubMed] [Google Scholar]
- Shi J, Cao H (2011). Molecular structure‐affinity relationship of dietary flavonoids for bovine serum albumin. Rev Bras Farmacogn 21: 594–600. [Google Scholar]
- Simcyp (2014a). Simcyp prediction tools ‐fu. [Online]. Available at: https://members.simcyp.com/account/tools/fu/) (Accessed: 15th July 2015]. Vol 2014.
- Simcyp (2014b). Simcyp prediction tools‐ blood to plasma partition ratio (B/P). [Online]. Available at: https://members.simcyp.com/account/tools/BP/) (Accessed: 15th July 2015).
- Sotoca AM, Ratman D, van der Saag P, Ström A, Gustafsson JA et al. (2008). Phytoestrogen‐mediated inhibition of proliferation of the human T47D breast cancer cells depends on the ERα/ERβ ratio. J Steroid Biochem Mol Biol 112: 171–178. [DOI] [PubMed] [Google Scholar]
- Soukup ST, Helppi J, Müller DR, Zierau O, Watzl B et al. (2016). Phase II metabolism of the soy isoflavones genistein and daidzein in humans, rats and mice: a cross‐species and sex comparison. Arch Toxicol 90: 1335–1347. [DOI] [PubMed] [Google Scholar]
- Southan C, Sharman JL, Benson HE, Faccenda E, Pawson AJ, Alexander SP et al. (2016). The IUPHAR/BPS guide to PHARMACOLOGY in 2016: towards curated quantitative interactions between 1300 protein targets and 6000 ligands. Nucleic Acids Res 44: D1054–D1068. [DOI] [PMC free article] [PubMed] [Google Scholar]
- Steensma A, Noteborn HPJM, Kuiper HA (2004). Comparison of Caco‐2, IEC‐18 and HCEC cell lines as a model for intestinal absorption of genistein, daidzein and their glycosides. Environ Toxicol Pharmacol 16: 131–139. [DOI] [PubMed] [Google Scholar]
- Strikwold M, Spenkelink B, Woutersen R, Rietjens IMCM, Punt A (2013). Combining in vitro embryotoxicity data with physiologically based kinetic (PBK) modelling to define in vivo dose–response curves for developmental toxicity of phenol in rat and human. Arch Toxicol 87: 1709–1723. [DOI] [PubMed] [Google Scholar]
- van der Velpen V, Geelen A, Schouten EG, Hollman PC, Afman LA et al. (2013). Estrogen receptor‐mediated effects of isoflavone supplementation were not observed in whole‐genome gene expression profiles of peripheral blood mononuclear cells in postmenopausal, equol‐producing women. J Nutr 143: 774–780. [DOI] [PubMed] [Google Scholar]
- van der Velpen V, Geelen A, Hollman PC, Schouten EG, van 't Veer P et al. (2014). Isoflavone supplement composition and equol producer status affect gene expression in adipose tissue: a double‐blind, randomized, placebo‐controlled crossover trial in postmenopausal women. Am J Clin Nutr 100: 1269–1277. [DOI] [PubMed] [Google Scholar]
- van der Woude H, ter Veld MGR, Jacobs N, van der Saag PT, Murk AJ et al. (2005). The stimulation of cell proliferation by quercetin is mediated by the estrogen receptor. Mol Nutr Food Res 49: 763–771. [DOI] [PubMed] [Google Scholar]
- Walsh KR, Haak SJ, Bohn T, Tian Q, Schwartz SJ et al. (2007). Isoflavonoid glucosides are deconjugated and absorbed in the small intestine of human subjects with ileostomies. Am J Clin Nutr 85: 1050–1056. [DOI] [PubMed] [Google Scholar]
- Wang TTY, Sathyamoorthy N, Phang JM (1996). Molecular effects of genistein on estrogen receptor mediated pathways. Carcinogenesis 17: 271–275. [DOI] [PubMed] [Google Scholar]
- Wu AH, Spicer D, Garcia A, Tseng C‐C, Hovanessian‐Larsen L et al. (2015). Double‐blind randomized 12‐month soy intervention had no effects on breast MRI fibroglandular tissue density or mammographic density. Cancer Prev Res 8: 942–951. [DOI] [PMC free article] [PubMed] [Google Scholar]
- Wu B (2011). Substrate inhibition kinetics in drug metabolism reactions. Drug Metab Rev 43: 440–456. [DOI] [PubMed] [Google Scholar]
- Yamamoto S, Sobue T, Kobayashi M, Sasaki S, Tsugane S et al. (2003). Soy, isoflavones, and breast cancer risk in Japan. J Natl Cancer Inst 95: 906–913. [DOI] [PubMed] [Google Scholar]
- Yuan B, Wang L, Jin Y, Zhen H, Xu P et al. (2012a). Role of metabolism in the effects of genistein and its phase II conjugates on the growth of human breast cell lines. AAPS J 14: 329–344. [DOI] [PMC free article] [PubMed] [Google Scholar]
- Yuan B, Zhen H, Jin Y, Xu L, Jiang X et al. (2012b). Absorption and plasma disposition of genistin differ from those of genistein in healthy women. J Agric Food Chem 60: 1428–1436. [DOI] [PubMed] [Google Scholar]
- Yuan J‐P, Wang J‐H, Liu X (2007). Metabolism of dietary soy isoflavones to equol by human intestinal microflora – implications for health. Mol Nutr Food Res 51: 765–781. [DOI] [PubMed] [Google Scholar]
Associated Data
This section collects any data citations, data availability statements, or supplementary materials included in this article.
Supplementary Materials
Table S1 Physiological parameters in human.
Figure S1 Concentration‐dependent formation of genistein mono‐conjugates and genistein diconjugates with pooled mixed‐gender human small intestine S9 (A – E) or liver S9 (F – I): genistein‐7‐O‐glucuronide (G‐7G), genistein‐4′‐O‐glucuronide (G‐4´G), genistein‐7‐O‐sulfate (G‐7S), genistein‐4′,7‐O‐diglucuronide (G‐4′7diG), genistein‐7‐O‐glucuronide‐4′‐O‐sulfate (G‐7G‐4′S), and genistein‐4′‐O‐glucuronide‐7‐O‐sulfate (G‐4´G‐7S).
Figure S2 Sensitivity analysis of the predicted plasma C max of genistein aglycone at an oral dose of 0.5 and 7 mg kg−1 (A) genistein and (B) genistin. The parameters stand for: BW = body weight, VTi = tissue volumn (Ti = I (small intestine), L (liver), BR (breast), R (rapidly perfused tissues), and S (slowly perfused tissues), QC = cardiac output, QTi = reginal blood flow through tissue, PTiG = partition coefficient of genistein in tissue, K a = uptake rate constant of genistein, R = blood to plasma ratio, S9PI = small intestinal S9 protein content, S9PL = liver S9 protein content, V max and K m = the maximum rate of formation and the Michaelis–Menten constant for formation of genistein‐7‐O‐glucuronide (G7G) and genistein‐7‐O‐sulfate (G7S).
Figure S3 Translation of in vitro oestrogenic concentration–response curves for genistein dependent (A) binding to ERα (Kuiper et al., 1998; Maggiolini et al., 2001; Kinjo et al., 2004; Matsumura et al., 2005), (B) binding to ERβ (Kuiper et al., 199; Maggiolini et al., 2001; Han et al., 2002; Kinjo et al., 2004), (C) ERα mediated gene expression in U2OS reporter gene assays (van der Woude et al., 2005; Sotoca et al., 2008; Djiogue et al., 2010; Islam et al., 2015), (D) ERβ mediated gene expression in U2OS reporter gene assays (van der Woude et al., 2005; Sotoca et al., 2008; Djiogue et al., 2010; Islam et al., 2015), and (E) ERα dependent proliferation of MCF‐7 and T47D breast cancer cells (Makela et al., 1994; Wang et al., 1996; Hsieh et al., 1998; Maggiolini et al., 2001; Han et al., 2002; Kinjo et al., 2004; Murata et al., 2004; Matsumura et al., 2005; Kuruto‐Niwa et al., 2007; Sotoca et al., 2008; Rajah et al., 2009; Yuan et al., 2012a,b; Islam et al., 2015), to in vivo human genistin dose–response curves using PBK model based reverse dosimetry based on plasma Cmax values of genistein aglycone. The solid lines represent the central in vivo dose–response curve, whereas the dashed lines represent the 95% lower and upper confidence limits.