Figure 1.
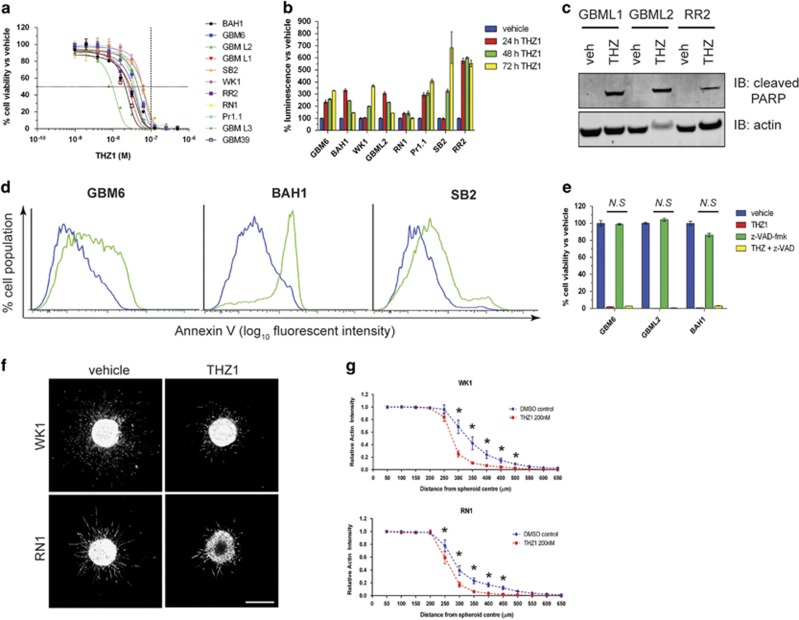
THZ1 potently inhibits gliomagenesis and prevents HGG invasion. (a) Eleven HGG primary cell lines, isolated from patient tissue, were treated with increasing doses of THZ1. After 7 days, cells were subjected to cell viability luminescence assays. Graph represents sigmoidal dose-response curves for all cell lines tested and their response to each THZ1 dose. Data are presented as the percentage of viable cells vs vehicle control at each dose±s.e.m. Horizontal dashed line=50% inhibition of cell viability. Vertical dashed line=100 nM THZ1 concentration. (b) Cleaved caspase 3/7 detection in primary cells treated with 200 nM THZ1 for 24, 48 and 72 h. Data represent the percentage luminescence signal obtained for each time point vs vehicle controls±s.e.m. (c) Lysates from primary cells treated for 72 h with 200 nM THZ1 analyzed for the presence of cleaved PARP (top panel) by western blotting. Actin (bottom panel) was used as a loading control. (d) Flow cytometry histograms for Annexin V cell-surface detection on multiple primary cell lines treated with vehicle (blue) or 200 nM THZ1 (green) for 72 h. (e) Cell viability assay plots for primary cell lines treated with vehicle, 200 nM THZ1, 25 μM of the pan-caspase inhibitor z-VAD-fmk or a combination of both for 7 days. Data are presented as the percentage of viable cells vs vehicle control±s.e.m. THZ1 alone vs THZ1+z-VAD-fmk, not significant (N.S) by two-way analysis of variance (ANOVA), d.f.=34. (f) Representative maximum projection confocal images of WK1 spheroids (top panels) and RN1 spheroids (bottom panels) embedded in collagen and stained for actin, after 48 h. Treatments with vehicle (left panels) or 200 nM THZ1 (right panels) are indicated. Scale bar: 500 μm (g) Quantification of spheroid invasion, measured by relative actin intensity over the distance from the spheroid center±s.e.m. Vehicle (dimethyl sulfoxide, DMSO) vs THZ1 for both WK1 and RN1: *P<0.0001 by two-way ANOVA. Data are the average from three independent experiments, with 8–14 individual spheroids analyzed per treatment. All experiments were repeated a minimum of two times over multiple primary cell lines.

