Abstract
Lipids are a major component of heart tissue and perform several important functions such as energy storage, signaling, and as building blocks of biological membranes. The heart lipidome is quite diverse consisting of glycerophospholipids such as phosphatidylcholines (PCs), phosphatidylethanolamines (PEs), phosphatidylinositols (PIs), phosphatidylglycerols (PGs), cardiolipins (CLs), and glycerolipids, mainly triacylglycerols (TAGs). In this study, mass spectrometry imaging (MSI) enabled by matrix implantation of ionized silver nanoparticles (AgNP) was used to map several classes of lipids in heart tissue. The use of AgNP matrix implantation was motivated by our previous work showing that implantation doses of only 1014/cm2 of 2 nm gold nanoparticulates into the first 10 nm of the near surface of the tissue enabled detection of most brain lipids (including neutral lipid species such as cerebrosides) more efficiently than traditional organic MALDI matrices. Herein, a similar implantation of 500 eV AgNP− across the entire heart tissue section results in a quick, reproducible, solvent-free, uniform matrix concentration of 6 nm AgNP residing near the tissue surface. MALDI-MSI analysis of either positive or negative ions produce high-quality images of several heart lipid species. In negative ion mode, 24 lipid species [16 PEs, 4 PIs, 1 PG, 1 CL, 2 sphingomyelins (SMs)] were imaged. Positive ion images were also obtained from 29 lipid species (10 PCs, 5 PEs, 5 SMs, 9 TAGs) with the TAG species being heavily concentrated in vascular regions of the heart.
Keywords: MALDI, Mass spectrometry imaging, Lipids, Silver nanoparticles
Introduction
Matrix-assisted laser desorption/ionization mass spectrometry (MALDI-MS) is used for mass spectrometry imaging (MSI); it is a valuable technique that allows direct tracking and mapping of biomolecules in tissue sections [1–3]. Although initially MALDI-MSI focused primarily on proteins and peptides, in the mid-2000s the Woods’ group started mapping and imaging lipids directly from tissue [4–6], and their work was followed by many excellent publications on lipids from several other labs [7–9]. In imaging, matrix is coated onto tissue sections, and by rastering, mass spectra are acquired across the whole section. The data are then used to generate 2-D ion intensity maps (images) for a specific m/z range (mass peak), in which pixel intensity is a function of ion signal strength in the specified m/z range. The addition of matrix is the key step in MALDI imaging experiments. Deposition of a homogenous layer of matrix across the whole tissue section is required in order to ensure that the generated images reflect the actual distribution of the biomolecules in situ. The most common methods for coating tissue sections are “wet” techniques in which the matrix is sprayed onto the sections (capillary electrospray emitters [10], TLC sprayer [11], airbrush sprayer [12], oscillating capillary nebulizer [13]) or spotted automatically [14–16] onto the sections. Depending on the solvents used in the matrix solution, great care has to be taken not to wet the tissue section too much which can lead to analyte extraction and migration across the section, thus invalidating the images acquired. In order to minimize this problem, several “dry” techniques for matrix coating have been developed. These include sublimation of the matrix [17], deposition of dry matrix particles [11], and the impaction of metal clusters [18, 19]. All have been used successfully for direct lipid analysis from tissue.
The vast majority of MALDI imaging studies use traditional solid (crystalline) matrices. For lipid imaging studies, 2,5-dihydroxybenzoic acid (DHB) [11, 12, 16], 2,6-dihydroxyacetophenone (DHA) [20], α-cyano-4-hydroxycinnamic acid [21], 9-aminoacridine [22], and 2-mercaptobenzothiazole [23] have all been used successfully to track lipid species in tissue. Although not as widely used as solid matrices, particle (metal) matrices, in particular nanoparticles (NPs), have also been used to image lipids in tissue. Gold nanoparticles (AuNPs) [24], colloidal graphite [25], and iron nanoparticles (FeNPs) [26] were used to image cerebrosides in brain tissue in positive ion mode, a class of neutral sphingolipids that are not usually observed in imaging studies of brain tissue using solid matrices due to ion suppression from phosphatidylcholine (PC) and sphingomyelin (SM) species which are preferentially ionized in positive ion mode. In negative ion mode, silver nanoparticles (AgNPs) [27] have been employed to map the distribution of fatty acids in mouse retinal sections, while AuNPs [28] have been used to image sulfatide and ganglioside species in mouse brain sections. In the particle matrix imaging studies referenced above, the matrix was applied by spraying techniques. Previously, gold clusters have been demonstrated as a successful matrix for lipid analysis in tissue, in which the gold clusters were impacted using a massive cluster ion source [18, 19]. The major drawback to this method is the area that can be coated is not feasible for coating whole tissue sections. Recently, a nanoimplanter has been developed, in which AuNPs and AgNPs are generated from a metal disk by magnetron sputtering that allows the coating of a whole coronal rat brain section. Analysis of these implanted sections produced images for cerebrosides, sulfatides, and phosphatidylethanol-amines (PEs) [29].
Although not as widely studied by MSI as brain lipids, work has been conducted on heart lipids. In earlier studies, direct tissue profiling of rat heart tissue sections by MALDI with a DHA matrix detected several phospholipid classes in positive ion mode (PCs, PEs, and SMs), while in negative ion mode PEs, phosphatidylglycerols (PGs), phosphatidylinositols (PIs), and cardiolipins (CLs) species were detected [5, 30]. Recently, MSI of heart tissue has been conducted using DHB that was sublimated [31] or spray coated [32]. In one of the studies, lipid biomarkers (PC, LPC, LPE) were identified for myocardial infarction [32]. In the current study, AgNPs were implanted into rat heart tissue sections. Analysis was conducted in both positive and negative ion mode. Several major lipid classes were imaged including PEs, PCs, SMs, CLs, PGs, triglycerides (TAGs), and PIs. The results of these experiments are presented below.
Material and methods
Materials
Acetone (HPLC grade), chloroform (HPLC, ≥99.9 %), diethyl ether (≥99.9 %), 2,5 dihydroxybenzoic acid (DHB, ≥98 %), diisopropylether (ACS reagent, ≥99 %), hexane (HPLC grade), and methanol (Optima LC/MS) were purchased from Sigma-Aldrich (St. Louis, MO). Isopentane (2-methylbutane) and acetic acid (Glacial, ACS reagent) were acquired from J.T. Baker (Phillipsburg, NJ).
Tissue preparation
All the animal work in this study abides by the Guide for the Care and Use of Laboratory Animals (NIH). Adult male Sprague–Dawley rat hearts were perfused with physiological water, removed, and frozen in dry ice chilled isopentane. The heart was attached to the cryostat specimen disk using ice slush made from distilled water as has been previously reported [33]. Frozen heart tissue was cut into thin sections (18 μm in thickness) using a cryostat (Leica Microsystems CM3050S, Bannockburn, IL) at −18 °C (cryochamber temperature) and −16 °C (specimen cooling temperature). Heart tissue sections were directly deposited on glass microscope slides (Fisher Scientific, SuperFrost Plus #12-550-15, Pittsburgh, PA) for MALDI imaging or were collected in a glass vial for lipid extraction. Heart sections were brought to room temperature, and a digital light microscope picture was taken before AgNP implantation.
Lipid extraction
Total lipids were extracted from heart tissue sections (~12 mg) using a modified Folch extraction method [34]. Twenty microliters of a chloroform (CHL)/methanol (MeOH) (2:1 v/v) mixture was added for each 1 mg tissue. For samples that were to undergo further separation using SPE columns, the internal standard PC 14:0/14:0 (Avanti Polar Lipids, Alabaster, AL) was added at 5 μg per 1 mg of tissue. The tissue was homogenized, sonicated for 10 min, and vortexed for 30 min. Next, distilled water was added at 4 μL for each 1 mg tissue. Then, the mixture was vortexed for 1 min and centrifuged 10 min at 3,000 rpm. The lower phase (organic), containing the total lipids except for gangliosides, was dried under nitrogen and resuspended in either 195 μL MeOH+5 μL CHL (if MS analysis is to be conducted on total lipid extract) or a CHL volume equal to the amount of CHL/MeOH used for extraction (if additional separation by SPE columns is desired).
Lipids species in the lower phase were fractionated using LC-NH2 SPE tubes in a method similar to Bodennec et al. [35]. In this procedure, 1 mL LC-NH2 SPE tubes (SuperClean, Sigma, St. Louis, MO) were conditioned with 2 mL of hexane. Next, 200 μL of the lower phase in chloroform was loaded on the SPE column, followed by 2 mL of diethyl ether to collect diglycerides, TAGs, and cholesterol. Next, 1.6 mL of CHL/MeOH (23:1 v/v) was added to the SPE tubes to remove the ceramides, followed by 1.8 mL of diisopropyl/acetic acid (98:4 v/v) to remove free fatty acids, and 2 mL of acetone/MeOH (9/1.2 v/v) to remove neutral glycolipids. Finally, 2 mL of CHL/MeOH (2:1 v/v) was added to collect PC, PE, and SM species. The collected fractions containing TAGs and PCs, PEs, and SMs were dried under nitrogen and resuspended in 5 μL chloroform and 200 μL methanol. The fractions were stored at −80 °C until mass analysis.
MALDI sample preparation for tissue extractions and lipid standards
DHB matrix was prepared at a concentration of 30 mg/mL in 50 % MeOH. The total lipid extract, TAG fraction, and PC+ PE+SM fraction from heart were diluted 1:4 (v/v) in 50 % MeOH. For DHB matrix, 0.5 μL of the extracts were spotted on the sample target followed by 0.5 μL of matrix. For AgNps, 0.5 μL of the extracts was spotted on a glass microscope slide and then AgNPs were implanted onto the glass slide as described below for tissue. PC 16:0a/18:1 and PE 16:0a/18:1 (Avanti Polar Lipids) were prepared as stock solutions at 10 nmol/μL in CHL/MeOH (2:1 v/v); 0.5 μL of each PC and PE species was spotted directly onto heart tissue sections as individual spots and as a mixed spots.
NP formation and implantation
Heart tissue was implanted with an NPlanter (Ionwerks, Houston, TX). Silver targets were 2 in. diameter × 0.125 in. thick disk of 99.99 % pure silver and were purchased from Kurt J. Lesker Company (Clairton, PA).
The AgNPs− are formed by magnetron sputtering and growth within a refinement zone (particles are 0.5–15 nm in diameter). The AgNPs− emerging from the magnetron are size selected with a quadrupole mass filter yielding an approximately Gaussian diameter distribution centered at 6 nm (2.5 nm FWHM). The size selected particle beam was then accelerated to 500 eV and electronically rastered to ensure uniform deposition across and within the tissue. An equivalent of two to four monolayers was implanted. The deposition took 18 min for each tissue section.
Mass spectrometer
A MALDI LTQ-XL-Orbitrap (Thermo Fisher, San Jose, CA) was used for mass analysis. Thermo’s Imagequest and Xcaliber softwares were used for MALDI-MSI data acquisition. The images were acquired in both negative and positive ion mode. The positive ion range was 600–1,100 Da, with three laser shots per pixel at a laser fluence of 14 μJ. The negative ion mode was range was 600–1,700 Da, with three laser shots per pixel at laser fluence of 16 μJ for silver. The target plate stepping distance was set to 50 μm for both the x-and y-axes by the MSI image acquisition software. The mass resolution was set to 30,000 for negative ion mode and at 60,000 for positive mode. Mass error was under 3 ppm in positive ion mode and under 5 ppm in negative ion mode. A custom-built IDL-based software developed by Ionwerks, Inc. was employed to extract peaks list from regions of interest in tissue. MSn analysis was conducted in both positive and negative ion mode with CID collision energies between 25 and 40 V in the ion trap.
Lipid assignment
Assignment of lipid species in heart tissue was based upon monoisotopic molecular masses with mass errors less than 3 ppm in positive ion mode and less than 5 ppm in negative ion mode. Mass peak were labeled as follows: PI, PG, CL, and TAG species number equal the total length and number of double bonds of fatty acid chains, while SM species number corresponds to the length and number of double bonds of the acyl chain attached to the sphingosine base. PC and PE species equal the total length and number of both radyl chains with a representing diacyl species and p representing plasmalogen species. Additionally, MSn analysis was conducted to further confirm lipid assignments and is included in the supplemental data for this paper.
Results and discussion
Comparison of AgNPs and DHB matrix for heart lipid extracts
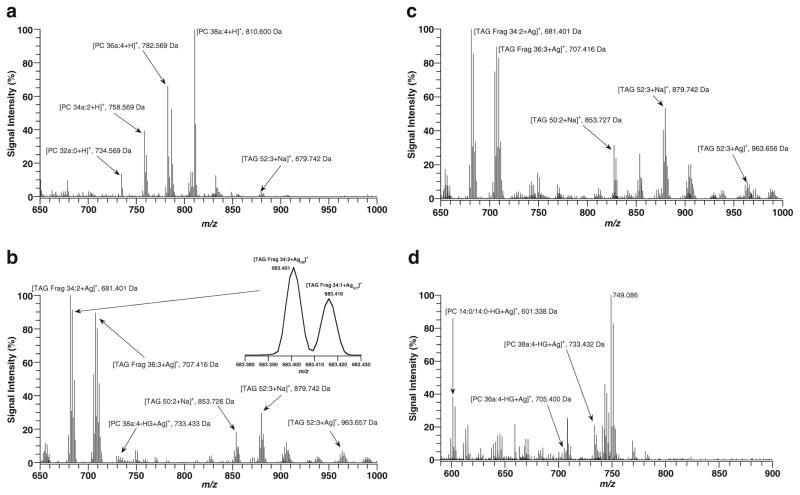
Initial studies were conducted using lipid extracts from rat heart tissue sections. Figure 1 illustrates mass spectra acquired in positive ion mode for total lipid extracts from rat heart with (a) DHB and (b) AgNPs matrices. As is observed in the figure, the two matrices produced widely different lipid profiles. In Fig. 1a, the mass spectrum is dominated by protonated PC species, PC 38a:4 (810.600 Da), PC 36a:4 (782.569 Da), PC 34a:2 (758.569 Da), and PC 32a:0 (734.569 Da), while only minor peaks are associated with TAG species (TAG 52:3+Na, 879.742 Da), even though TAGs are a major class of heart lipids. These PC species have been observed directly from heart tissue using MALDI-MS with a DHA matrix in a previous study [5]. Furthermore, the suppression of TAGs in the presence of abundant PCs has been observed in previous MALDI studies with solid matrices [36, 37]. In these studies, TAGs were successfully detected either by separating them from PCs or by altering the matrix protocol. In contrast, when AgNPs (Fig. 1b) are used as a matrix, the mass spectrum of total heart lipid extract is dominated by TAG species’ mass peaks. Three major series of peaks were observed for TAG species. Intact TAG species were observed as sodium adducts (TAG 52:3+Na, 879.742 Da; TAG 50:2+Na, 853.726 Da) and silver adducts (TAG 52:3+Ag, 963.657 Da). The major peaks associated with TAGs in Fig. 1b were fragment peaks produced by the loss of one of the three fatty acids in a TAG specie (TAG Frag 34:2+Ag, 681.401 Da; TAG Frag 36:3+ Ag, 707.416 Da). These fragment peaks from TAGs in MALDI analysis have been widely observed in past studies [38, 39]. Silver adducts produce a unique isotope pattern that aid in their assignment. Silver have two natural isotopes: 106.90454 Da (51.839 %) and 108.90421 Da (48.161 %). The difference between a double bond (+2.01565 Da) and two isotopes of silver (+1.99966 Da) is only 0.01599 Da. The resolution necessary to separate these two ions is approximately 50,000 for an m/z of 800, thus requiring an instrument with sufficient resolving power. Due to this, all spectra in positive ion mode were acquired with a mass resolution of 60,000. The inset in Fig. 1b shows the m/z region around 683.400 Da. In this region, there are two distinct TAG species detected [TAG Frag 34:2+Ag109]+ at m/z 683.401 and [TAG Frag 34:1+Ag107]+ at m/z 683.416. Similar distribution was observed for all Ag adducts in this work.
Fig. 1.
MALDI mass spectra of total lipid heart extract with (a) DHB and (b) AgNPs matrix in positive ion mode and (c) TAG fraction and (d) PC+ PE+SM fraction with AgNPs in positive ion mode. Mass spectra are the average of 10 mass scans
PC species were also detected as minor fragment peaks (PC 38a:4-phosphocholine head group(HG)+Ag, 733.433 Da). These PC fragment peaks were observed in greater abundance from tissue with AgNps (as will be shown below) than from tissue extracts spotted on glass microscope slides. This result could be due to more intense fragmentation (resulting into the total fragmentation of the PC specie into phosphocholine and its two fatty acid chains) of PC species on glass slides versus the softer surface of the tissue or it could be that the tissue acts as a “heat sink” for the laser energy. Additionally, the mass peaks assigned as PC fragments could also be produced by TAG species that fragment. In order to confirm our assignments for PC species, further analysis of lipid fractions was conducted in which different classes of lipids were separated. Figure 1c shows a mass spectrum of the fraction containing mainly TAGs and is in complete agreement with the assigned TAG species labeled in Fig 1b. Figure 1d illustrates a mass spectrum of the fraction containing only PCs, SMs, and PEs, and it agrees with our assignment for PCs species losing their phosphocholine head group and forming a silver adduct. To further confirm our assignment, this fraction included an internal standard (PC 14:0/14:0) detected by the mass peak [M-HG+Ag]+ at 601.338 Da. The base peak in Fig. 1d at m/z 749.086 is an AgNPs matrix ion. Based upon the results in Fig. 1, it is clear that the use of AgNPs offer advantages for the analysis of TAGs compared to the typical MALDI organic matrix. Previous studies of heart tissue by direct tissue profiling [5, 30] and MSI [31, 32] using organic matrices did not track the TAG species in heart. Due to this, AgNPs were chosen as the matrix for MSI studies for heart tissue in both positive and negative ion mode in the sections below.
MALDI-MSI of heart tissue with AgNPs in positive ion mode
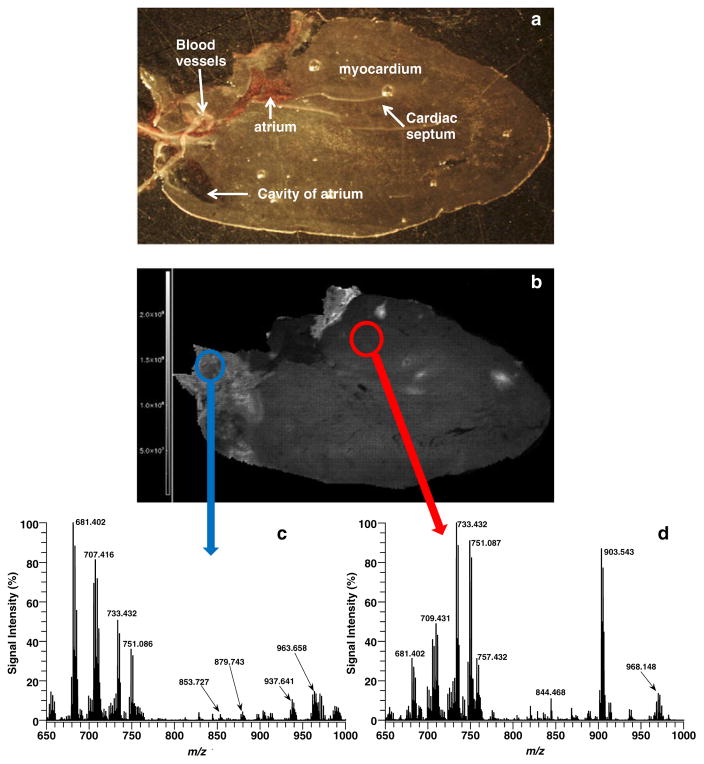
Next, experiments were conducted, in which AgNPs were implanted directly onto tissue and analyzed in positive ion mode. Figure 2a shows a light microscope picture of the heart tissue section before AgNPs were implanted, and Fig. 2b illustrates the image for the total ion count recorded in this sample run. Mass spectra from two distinct regions of interests are shown in Fig. 2c (blue circle), an area in the major blood vessels regions of the heart, and Fig. 2d (red circle), an area representing the myocardium. The mass spectrum in the vessels region of the heart is dominated by TAG mass peaks, such as 681.402 Da (TAG Frag 34:2+Ag), 707.416 Da (TAG Frag 36:3+Ag), 853.727 Da (TAG 50:2+Na), 879.743 Da (TAG 52:3 + Na), 937.641 Da (TAG 50:2 + Ag), and 963.658 Da (TAG 52:3+Ag). The only difference observed for direct tissue analysis versus the total lipid extract for TAG species is the Ag adducts were more abundant than Na adducts, while the reverse was observed for analysis of the extracts on glass microscope slides. The mass spectrum in myocardium region of the heart contained higher abundance of PC and PE species such as 733.432 Da (PC 38a:4-HG+Ag) and 844.468 (PE 38a4-H+2 K). Interestingly, PE species formed mostly doubly potassiated adducts with only very minor mass peaks assigned as [PE-H+K+Ag]+. We did not detect any doubly sodiated adducts of PEs. A complete list (Table S1, Electronic supplementary material) of all 29 lipid species (10 PCs (8 diacyl and 2 plasmalogen species), 5 PEs, 5 SMs, 9 TAGs) imaged in positive ion mode and the abundance of each lipid specie for both regions in Fig. 2b is supplied in the supplemental data for this paper. Additionally, MSn structural data for several lipid species in Table S1 are illustrated in supplemental Figs. S1–S13.
Fig. 2.
(a) Light microscope picture of heart section prior to AgNP implantation. (b) MALDI image of the TIC for heart section in (a) with AgNPs in positive ion mode. Average mass spectra of (c) vessels region and (d) myocardium area
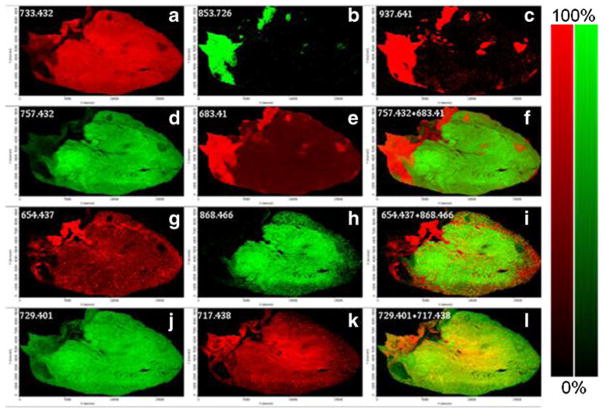
Figure 3 contains several MALDI images generated from the MSI run for the heart section in Fig. 2 in positive ion mode with AgNPs. The most abundant PC detected in the heart, PC 38a:4-HG+Ag (733.432 Da), was widely distributed throughout the myocardium (Fig. 3a), while TAG 50:2 is highly localized in the vessel region of the heart tissue section as seen for both the Na adduct (Fig. 3b) and the Ag adduct (Fig. 3c) .Additionally, the same localized distribution is observed for the TAG fragment peak at 683.41 Da (Fig 3e), and when it is overlaid on the ion image for (PC 40a:6-HG+Ag, 757.432 Da, Fig. 3d) two clear distinct regions (PC-rich area and TAG-rich area) are observed in the heart tissue section (Fig. 3f). Although not as abundant as the mass peaks for PCs and TAGs, SM d18:1/18:0-HG+Ag (654.437 Da, Fig. 3g) and PE 40a:6-H+2 K (868.466 Da, Fig. 3h) were also imaged and when combined as a combo image (Fig. 3i) show the SM species concentration in the outer edges of the heart section while the PE species is more abundant in the center. Two minor PC species at 729.401 Da (Fig. 3j) and 717.438 Da (Fig. 3k) showed very similar distribution as the more abundant PC 38a:4 specie.
Fig. 3.
MALDI images of (a) PC 38a:4-HG+Ag, 733.432 Da, (b) TAG 50:2+Na, 853.726 Da, (c) TAG 50:2+Ag, 937.641 Da, (d) PC 40a:6-HG+Ag, 757.432, (e) TAG Frag 34:1+Ag, 683.410, (f) combo of 757.432 (green) and 683.410 (red), (g) SM d18:1/ 18:0-HG+Ag, 654.437 Da, (h) PE 40a:6-H+2 K, 868.466 Da, (i) combo of 654.437 (red) and 868.466 (green), (j) PC 38a:6-HG+Ag, 729.401, (k) PC 38p:4-HG+Ag, 717.438, and (l) combo of 729.401 (green) and 717.438 (red) in heart tissue section with AgNPs in positive ion mode
MALDI-MSI of heart tissue with AgNPs in negative ion mode
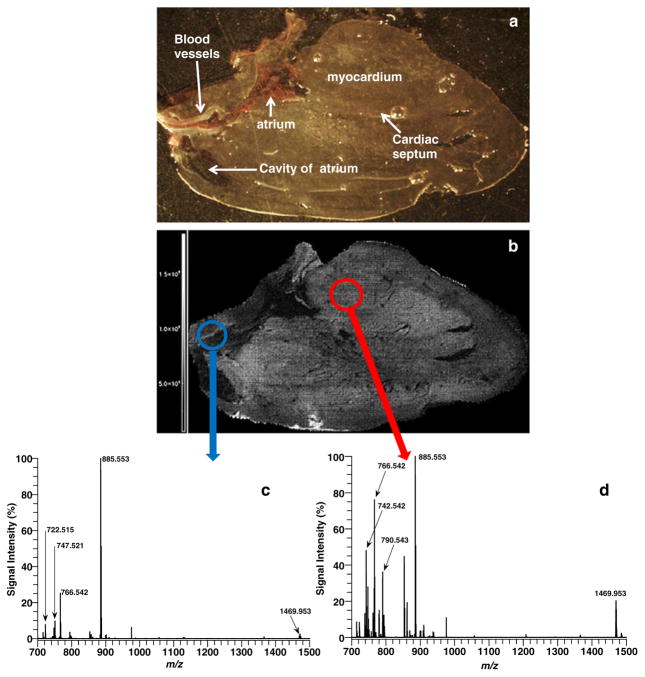
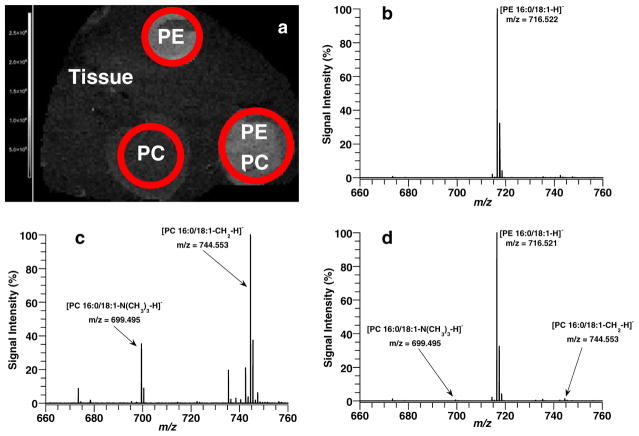
In order to detect more heart lipid classes, MSI experiments were conducted in negative ion mode. Figure 4 shows a picture of the heart tissue section (Fig. 4a) before AgNPs were implanted and the image of the total ion count recorded in negative ion mode. Mass spectra from two distinct regions of interests are shown in Fig. 4c (blue circle), the major blood vessels region, and Fig. 4d (red circle), the myocardium. The spectrum in the vessels’ region is dominated by the peak at 885.553 (PI38a:4-H), while the spectrum of the myocardium area has several additional major lipid peaks at 742.542 Da (PE 36a:2-H), 766.542 Da (PE 38a:4-H), and 1469.953 Da (CL 72:8+Na-2H). A previous study of heart tissue by direct tissue analysis with MALDI also identified CL 72:8 or (18:2)4 as the dominant CL specie in heart [30]. One note of caution for some PE assignments is that a corresponding PC fragment yields the same theoretical mass and chemical formula. For example, the mass peak assigned as PE 38a:4-H at 766.542 Da could also be assigned as PC 34a:2-CH2-H. In order to investigate the ionization efficiency of PE and PC species in negative ion mode with AgNPs, additional experiments were conducted. Five nanomoles of PE 16:0a/18:1 and PC 16:0a/18:1 standards was deposited onto a heart tissue section in individual spots and as a mixed spot. AgNPs were then implanted on the tissue section, and an MSI run was conducted in negative ion mode. Figure 5a shows the TIC image for the sample run, and three spots are clearly visible from this image. The spots are labeled PE, PC, and PEPC according to which lipid standards were spotted and mass spectra generated for each spot. Figure 5b shows the mass spectrum for PE 16:0a/18:1 spot, and only one major mass peak is observed at 716.522 Da (PE16:0a/18:1-H). In Fig. 5c, the mass spectrum of PC 16:0a/18:1 is displayed and two main mass peaks are observed at 744.553 Da (PC 16:0a/18:1-CH2-H) and at 699.495 Da (PC 16:0a/18:1-N(CH3)3-H). Figure 5d shows the mass spectrum for the spot with both PC and PE. The mass spectrum is dominated by the [PE 16:0a/18:1-H]− mass peak, while the mass peaks for the PC specie ([PC 16:0a/18:1-CH2-H]− and [PC 16:0a/18:1-N(CH3)3-H]−) are very minor peaks and represent less than 2 % of the PE base peak despite being equimolar. These results show that PE species are easier to ionize with AgNPs in negative ion mode when compared to PC species. For this reason, even in cases of isobaric overlap between PC and PE species, the majority of the signal in the peak most likely comes from the PE specie. A complete list (Table S2, Electronic supplementary material) of all 24 lipid species (16 PEs (12 diacyl and 4 plasmalogen species), 4 PIs, 1 PG, 1 CL, 2 SMs) imaged in negative ion mode and the abundance of each lipid specie for both regions in Fig. 4b is supplied in the supplemental information for this paper. Furthermore, MSn structural data for several lipid species in Table S2 are illustrated in supplemental Figs. S14–S22.
Fig. 4.
(a) Light microscope picture of heart section prior to AgNP implantation. (b) MALDI image of the TIC for heart section in (a) with AgNPs in negative ion mode. Average mass spectra of (c) vessels region and (d) myocardium area
Fig. 5.
(a) MALDI image of TIC of heart tissue section spotted with 5 nmol of PE 16:0/18:1 (PE spot), 5 nmol of PC 16:0/18:1 (PC spot), and 5 nmol each of PE 16:0/18:1and PC 16:01/18:1 (PE+PC spot) in negative ion mode with AgNPs. Average mass spectra of (b) PE spot, (c) PC spot, and (d) PE+PC spot
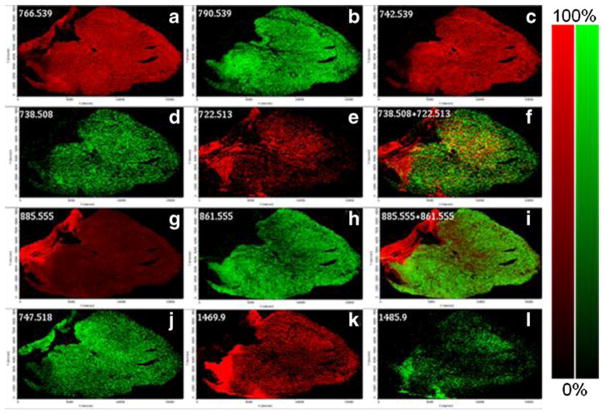
Figure 6 illustrates several MALDI images for the MSI run of the heart section in Fig. 4 in negative ion mode with AgNPs. Figure 6a–c shows the distribution of three major PE species (PE 38a:4, PE 40a:6, PE 36a:2) in the heart. PE 38a:4 is widely distributed throughout the heart tissue section while PE 40a:6 and PE 36a:2 are more localized. Both the diacyl and plasmalogen of PE 36a:4 were mapped and show distinct distribution in heart tissue (Fig. 6d–f). MALDI images of PI species (PI 38a:4, PI 36a:2), PG 34a:1, and both the Na and K adducts of CL 72:8 are also displayed in Fig. 6g–l.
Fig. 6.
MALDI images of (a) PE 38a:4-H, 766.539 Da, (b) PE 40a:6-H, 790.539 Da, (c) PE 36a:2-H, 742.539 Da, (d) PE 36a:4-H, 738.508 Da, (e) PE 36p:4-H, 722.513, (f) combo of 738.508 (green) and 722.513 (red), (g) PI 38a:4-H, 885.555 Da, (h) PI 36a:2-H, 861.555 Da, (i) combo of 885.555 (red) and 861.555 (green), (j) PG 34a:1-H, 747.518 Da, (k) CL 72:8+Na-2H, 1469.9, and (l) CL 72:8+K-2H, 1485.9 in heart tissue section with AgNPs in negative mode
Conclusion
In this study, AgNPs matrix was used to locate and analyze a wide variety of heart lipids. The method of matrix deposition by implantation produced high spatial resolution MALDI images in both positive and negative ion modes. In positive ion mode, AgNPs show high selectivity in the ionization of TAG species, a class of neutral glycerolipids that are not easily detected in the presence of more positively charged PC species when using organic matrices. In addition, images of PEs (PE-H+2 K) and of fragment peaks of PCs, in which the phosphocholine head group was cleaved, were obtained. In negative ion mode, PE, PI, PG, and CL species were detected and imaged as deprotonated mass peaks. Future studies will be conducted using different types of metal disks to probe the effect of the metal used upon the ionization of different classes of lipids.
Supplementary Material
Acknowledgments
This research was supported by the Intramural Research Program of the National Institute on Drug Abuse, NIH. The authors acknowledge Dr. Mari Prieto and Thermo Fisher Corporation for technical and instrumentation advices. Ionwerks and the University of Pittsburgh gratefully acknowledge ARRA support through NIDA phase II SBIR grant 1RC3DA031431-01.
Footnotes
Electronic supplementary material The online version of this article (doi:10.1007/s00216-013-7525-6) contains supplementary material, which is available to authorized users.
Contributor Information
Shelley N. Jackson, Structural Biology Unit, NIDA IRP, NIH, 333 Cassell Drive, Room 1120, Baltimore, MD 21224, USA
Kathrine Baldwin, Structural Biology Unit, NIDA IRP, NIH, 333 Cassell Drive, Room 1120, Baltimore, MD 21224, USA.
Ludovic Muller, Structural Biology Unit, NIDA IRP, NIH, 333 Cassell Drive, Room 1120, Baltimore, MD 21224, USA. University of Pittsburgh, 4200 Fifth Ave, Pittsburgh, PA 15213, USA.
Virginia M. Womack, Structural Biology Unit, NIDA IRP, NIH, 333 Cassell Drive, Room 1120, Baltimore, MD 21224, USA. University of Pittsburgh, 4200 Fifth Ave, Pittsburgh, PA 15213, USA
J. Albert Schultz, Ionwerks, Inc., 3401 Louisiana, Suite 355, Houston, TX 77002, USA.
Carey Balaban, University of Pittsburgh, 4200 Fifth Ave, Pittsburgh, PA 15213, USA.
Amina S. Woods, Structural Biology Unit, NIDA IRP, NIH, 333 Cassell Drive, Room 1120, Baltimore, MD 21224, USA
References
- 1.Cornett DS, Reyzer ML, Chaurand P, Caprioli RM. MALDI imaging mass spectrometry: molecular snapshots of biochemical systems. Nat Methods. 2007;4:828–833. doi: 10.1038/nmeth1094. [DOI] [PubMed] [Google Scholar]
- 2.Amstalden van Hove ER, Smith DF, Heeren RM. A concise review of mass spectrometry imaging. J Chromatogr A. 2010;1217:3946–3954. doi: 10.1016/j.chroma.2010.01.033. [DOI] [PubMed] [Google Scholar]
- 3.Seeley EH, Schwamborn K, Caprioli RM. Imaging of intact tissue sections: moving beyond the microscope. J Biol Chem. 2013;286:25459–25466. doi: 10.1074/jbc.R111.225854. [DOI] [PMC free article] [PubMed] [Google Scholar]
- 4.Jackson SN, Wang H-YJ, Woods AS. Direct profiling of lipid distribution in brain tissue using MALDI-TOFMS. Anal Chem. 2005;77:4523–4527. doi: 10.1021/ac050276v. [DOI] [PubMed] [Google Scholar]
- 5.Woods AS, Wang HY, Jackson SN. A snapshot of tissue glycerolipids. Curr Pharm Des. 2007;13:3344–3356. doi: 10.2174/138161207782360636. [DOI] [PMC free article] [PubMed] [Google Scholar]
- 6.Jackson SN, Woods AS. Direct profiling of tissue lipids by MALDI-TOFMS. J Chromatogr B Anal Technol Biomed Life Sci. 2009;877:2822–2829. doi: 10.1016/j.jchromb.2008.11.033. [DOI] [PMC free article] [PubMed] [Google Scholar]
- 7.Goto-Inoue N, Hayasaka T, Zaima N, Setou M. Imaging mass spectrometry for lipidomics. Biochim Biophys Acta. 2011;1811:961–969. doi: 10.1016/j.bbalip.2011.03.004. [DOI] [PubMed] [Google Scholar]
- 8.Fernández JA, Ochoa B, Fresnedo O, Giralt MT, Rodríguez-Puertas R. Matrix-assisted laser desorption ionization imaging mass spectrometry in lipidomics. Anal Bioanal Chem. 2011;401:29–51. doi: 10.1007/s00216-011-4696-x. [DOI] [PubMed] [Google Scholar]
- 9.Gode D, Volmer DA. Lipid imaging by mass spectrometry—a review. Analyst. 2013;138:1289–1315. doi: 10.1039/c2an36337b. [DOI] [PubMed] [Google Scholar]
- 10.Jurchen JC, Rubakhin SS, Sweedler JV. MALDI-MS imaging of features smaller than the size of the laser beam. J Am Soc Mass Spectrom. 2005;16:1654–1659. doi: 10.1016/j.jasms.2005.06.006. [DOI] [PubMed] [Google Scholar]
- 11.Puolitaival SM, Burnum KE, Cornett DS, Caprioli RM. Solvent-free matrix dry-coating for MALDI imaging of phospholipids. J Am Soc Mass Spectrom. 2008;19:882–886. doi: 10.1016/j.jasms.2008.02.013. [DOI] [PMC free article] [PubMed] [Google Scholar]
- 12.Garrett TJ, Prieto-Conway MC, Kovtoun V, Bui H, Izgarian N, Stafford G, Yost RA. Imaging of small molecules in tissue sections with a new intermediate-pressure MALDI linear ion trap mass spectrometer. Int J Mass Spectrom. 2007;260:166–176. [Google Scholar]
- 13.Chen Y, Allegood J, Liu Y, Wang E, Cachon-Gonzalez B, Cox TM, Merrill AH, Jr, Sullards MC. Imaging MALDI Mass spectrometry using an oscillating capillary nebulizer matrix coating system and its application to analysis of lipids in brain from a mouse model of Tay-Sachs/Sandhoff disease. Anal Chem. 2008;80:2780–2788. doi: 10.1021/ac702350g. [DOI] [PubMed] [Google Scholar]
- 14.Aerni H-R, Cornett DS, Caprioli RM. Automated acoustic matrix deposition for MALDI sample preparation. Anal Chem. 2006;78:827–834. doi: 10.1021/ac051534r. [DOI] [PubMed] [Google Scholar]
- 15.Baluya DL, Garrett TJ, Yost RA. Automated MALDI matrix deposition method with inkjet printing for imaging mass spectrometry. Anal Chem. 2007;79:6862–6867. doi: 10.1021/ac070958d. [DOI] [PubMed] [Google Scholar]
- 16.Delvolve AM, Woods AS. Optimization of automated matrix deposition for biomolecular mapping using a spotter. J Mass Spectrom. 2011;46:1046–1050. doi: 10.1002/jms.1986. [DOI] [PMC free article] [PubMed] [Google Scholar]
- 17.Murphy RC, Hankin JA, Barkley RM, Zemski Berry KA. MALDI imaging of lipids after matrix sublimation/deposition. Biochim Biophys Acta. 2011;1811:970–975. doi: 10.1016/j.bbalip.2011.04.012. [DOI] [PMC free article] [PubMed] [Google Scholar]
- 18.Novikov A, Caroff M, Della-Negra S, Lebeyec Y, Pautrat M, Schultz JA, Tempez A, Wang HY, Jackson SN, Woods AS. Matrix-implanted laser desorption/ionization mass spectrometry. Anal Chem. 2004;76:7288–7293. doi: 10.1021/ac049123i. [DOI] [PubMed] [Google Scholar]
- 19.Tempez A, Ugarov M, Egan T, Schultz JA, Novikov A, Della-Negra S, Lebeyec Y, Pautrat M, Caroff M, Smentkowski VS, Wang HY, Jackson SN, Woods AS. Matrix implanted laser desorption ionization (MILDI) combined with ion mobility-mass spectrometry for bio-surface analysis. J Proteome Res. 2004;4:540–545. doi: 10.1021/pr0497879. [DOI] [PubMed] [Google Scholar]
- 20.Colsch B, Jackson SN, Dutta S, Woods AS. Molecular microscopy of brain gangliosides: illustrating their distribution in hippocampal cell layers. ACS Chem Neurosci. 2011;2:213–222. doi: 10.1021/cn100096h. [DOI] [PMC free article] [PubMed] [Google Scholar]
- 21.Carter CL, McLeod CW, Bunch J. Imaging of phospholipids in formalin fixed rat brain sections by matrix assisted laser desorption/ionization mass spectrometry. J Am Soc Mass Spectrom. 2011;22:1991–1998. doi: 10.1007/s13361-011-0227-4. [DOI] [PubMed] [Google Scholar]
- 22.Cerruti CD, Benabdellah F, Laprevote O, Touboul D, Brunelle A. MALDI imaging and structural analysis of rat brain lipid negative ions with 9-aminoacridine matrix. Anal Chem. 2012;84:2164–2171. doi: 10.1021/ac2025317. [DOI] [PubMed] [Google Scholar]
- 23.Astigarraga E, Barreda-Gomez G, Lombardero L, Fresnedo O, Castano F, Giralt MT, Ochoa B, Rodriguez-Puertas R, Fernandez JA. Profiling and imaging of lipids on brain and liver tissue by matrix-assisted laser desorption/ionization mass spectrometry using 2-mercaptobenzothiazole as a matrix. Anal Chem. 2008;80:9105–9114. doi: 10.1021/ac801662n. [DOI] [PubMed] [Google Scholar]
- 24.Jackson SN, Ugarov M, Egan T, Post JD, Langlais D, Schultz JA, Woods AS. MALDI-ion mobility-TOFMS imaging of lipids in rat brain tissue. J Mass Spectrom. 2007;42:1093–1098. doi: 10.1002/jms.1245. [DOI] [PMC free article] [PubMed] [Google Scholar]
- 25.Cha S, Yeung ES. Colloidal graphite-assisted laser desorption/ionization mass spectrometry and MSn of small molecules. 1. Imaging of cerebrosides directly from rat brain tissue. Anal Chem. 2007;79:2373–2385. doi: 10.1021/ac062251h. [DOI] [PubMed] [Google Scholar]
- 26.Taira S, Sugiura Y, Moritake S, Shimma S, Ichiyanagi Y, Setou M. Nanoparticle-assisted laser desorption/ionization based mass imaging with cellular resolution. Anal Chem. 2008;80:4761–4766. doi: 10.1021/ac800081z. [DOI] [PubMed] [Google Scholar]
- 27.Hayasaka T, Goto-Inoue N, Zaima N, Shrivas K, Kashiwagi Y, Yamamoto M, Nakamoto M, Setou M. Imaging mass spectrometry with silver nanoparticles reveals the distribution of fatty acids in mouse retinal sections. J Am Soc Mass Spectrom. 2010;21:1446–1454. doi: 10.1016/j.jasms.2010.04.005. [DOI] [PubMed] [Google Scholar]
- 28.Goto-Inoue N, Hayasaka T, Zaima N, Kashiwagi Y, Yamamoto M, Nakamoto M, Setou M. The detection of glycosphingolipids in brain tissue sections by imaging mass spectrometry using gold nanoparticles. J Am Soc Mass Spectrom. 2010;21:1940–1943. doi: 10.1016/j.jasms.2010.08.002. [DOI] [PubMed] [Google Scholar]
- 29.Muller L, Barbacci D, Post J, Baldwin K, Lewis EK, McCully MI, Schultz JA, Woods AS. Identification of lipids using silver nanoparticles (AgNP) as a matrix for laser desorption/ionization imaging. Proceedings of the 60th ASMS Conference on Mass Spectrometry and Allied Topics; Vancouver, Canada. 2012. [Google Scholar]
- 30.Wang H-YJ, Jackson SN, Woods AS. Direct MALDI-MS analysis of cardiolipin from rat organs sections. J Am Soc Mass Spectrom. 2007;18:567–577. doi: 10.1016/j.jasms.2006.10.023. [DOI] [PMC free article] [PubMed] [Google Scholar]
- 31.Chaurand P, Cornett DS, Angel PM, Caprioli RM. From whole-body sections down to cellular level, multiscale imaging of phospholipids by MALDI mass spectrometry. Mol Cell Proteomics. 2011;10:1–11. doi: 10.1074/mcp.O110.004259. [DOI] [PMC free article] [PubMed] [Google Scholar]
- 32.Menger RF, Stutts WL, Anbukumar DS, Bowden JA, Ford DA, Yost RA. MALDI mass spectrometric imaging of cardiac tissue following myocardial infarction in a rat coronary artery ligation model. Anal Chem. 2012;84:1117–1125. doi: 10.1021/ac202779h. [DOI] [PMC free article] [PubMed] [Google Scholar]
- 33.Jackson SN, Wang H-YJ, Woods AS, Ugarov M, Egan T, Schultz JA. Direct tissue analysis of phospholipids in rat brain using MALDI-TOFMS and MALDI-ion mobility-TOFMS. J Am Soc Mass Spectrom. 2005;16:133–138. doi: 10.1016/j.jasms.2004.10.002. [DOI] [PubMed] [Google Scholar]
- 34.Folch J, Lees M, Sloane Stanley GH. A simple method for the isolation and purification of total lipids from animal tissues. J Biol Chem. 1957;226:497–509. [PubMed] [Google Scholar]
- 35.Bodennec J, Koul O, Aguado I, Brichon G, Zwingelstein G, Portoukalian J. A procedure for fractionation of sphingolipid classes by solid-phase extraction on aminopropyl cartridges. J Lipid Res. 2000;41:1524–1531. [PubMed] [Google Scholar]
- 36.Sun G, Yang K, Zhao Z, Guan S, Han X, Gross RW. Matrix-assisted laser desorption/ionization time-of-flight mass spectrometric analysis of cellular glycerophospholipids enabled by multiplexed solvent dependent analyte-matrix interactions. Anal Chem. 2008;80:7576–7585. doi: 10.1021/ac801200w. [DOI] [PMC free article] [PubMed] [Google Scholar]
- 37.Sugiura Y, Setou M. Selective imaging of positively charged polar and nonpolar lipids by optimizing matrix solution composition. Rapid Commun Mass Spectrom. 2009;23:3269–3278. doi: 10.1002/rcm.4242. [DOI] [PubMed] [Google Scholar]
- 38.Al-Saad KA, Zabrouskov V, Siems WF, Knowles NR, Hannan RM, Hill HH., Jr Matrix-assisted laser desorption/ionization time-of-flight mass spectrometry of lipids: ionization and prompt fragmentation patterns. Rapid Commun Mass Spectrom. 2003;17:87–96. doi: 10.1002/rcm.858. [DOI] [PubMed] [Google Scholar]
- 39.Gidden J, Liyanage R, Durham B, Lay JO., Jr Reducing fragmentation observed in the matrix-assisted laser desorption/ionization time-of-flight mass spectrometric analysis of triacylglycerols in vegetable oils. Rapid Commun Mass Spectrom. 2007;21:1951–1957. doi: 10.1002/rcm.3041. [DOI] [PubMed] [Google Scholar]
Associated Data
This section collects any data citations, data availability statements, or supplementary materials included in this article.


