Abstract
Obesity constitutes a major public health concern, being frequently associated with type 2 diabetes (T2D). Evidence from studies in humans and experimental animals suggest that consumption of the flavan-3-ol (−)-epicatechin (EC) and of EC-rich foods may improve insulin sensitivity. To further understand the potential benefits of dietary EC consumption on insulin resistance, this study investigated the capacity of EC supplementation to prevent high fat diet (HFD)-induced insulin resistance in mice. To assess the underlying mechanisms, the effects of HFD and EC consumption on the activation of the insulin cascade and of its negative modulators were evaluated. HFD consumption for 15 w caused obesity and insulin resistance in C57BL/6J mice as evidenced by high fasted and fed plasma glucose and insulin levels, and impaired ITT and GTT tests. This was associated with alterations in the activation of components of the insulin-triggered signaling cascade (insulin receptor, IRS1, ERK1/2, Akt) in adipose and liver tissues. EC supplementation prevented/ameliorated all these parameters. EC acted improving insulin sensitivity in the HFD-fed mice in part through a downregulation of the inhibitory molecules JNK, IKK, PKC and protein tyrosine phosphatase 1B (PTP1B). Thus, the above results suggest that consumption of EC-rich foods could constitute a dietary strategy to mitigate obesity-associated insulin resistance.
Keywords: Epicatechin, Insulin resistance, Obesity, High fat diet, Diabetes, Flavonoids, Flavanol
1. Introduction
Overweight and obesity constitute a major public health concern worldwide [1,2]. Characterized by an imbalance between energy intake and expenditure, obesity involves the accumulation of excessive body fat. Obesity is closely linked to the development of metabolic syndrome (MetS), that increases the risk for type 2 diabetes (T2D), cardiovascular, liver, kidney diseases, and cancer [3–6].
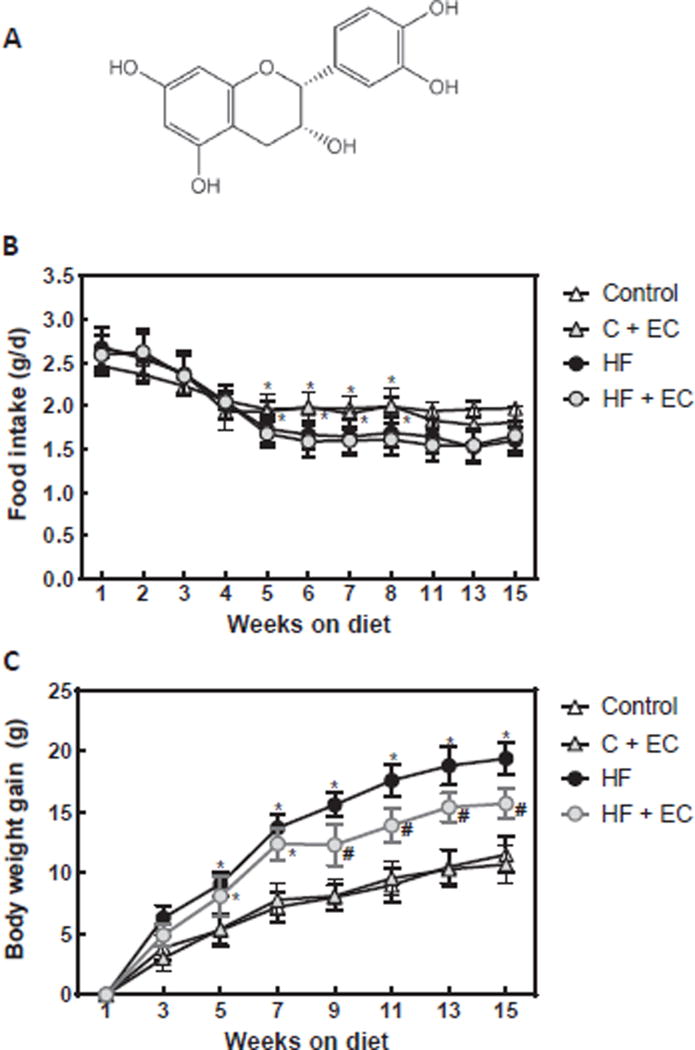
Consumption of diets with a high content of fat not only imply the risk of excessive energy consumption, but also have low capacity to promote satiety and limited capacity to promote fat oxidation. Indeed, inhibition of fat absorption favors weight loss strategies and improves glycemic control in obese individuals with T2D [7]. On the other hand, consumption of flavonoid-rich fruit and vegetables in humans is associated with the control of risk factors defining MetS [8–11]. The latter has been proposed based on studies in humans and in animals models (reviewed in Ref. [12]). Among these flavonoids is the flavan-3-ol (−)-epicatechin (EC) (Fig. 1A), which is present in many fruits and vegetables that are part of human diets, e.g. cocoa, tea, grapes and berries [13]. A growing body of evidence has shown that the consumption of ECrich foods and food extracts mitigates MetS risk factors [14–19]. The proposed beneficial health effects of EC can be due, among others, to its capacity to exert anti-inflammatory actions [20,21], modulate the production of nitric oxide and active oxygen species [22,23], and inhibit endoplasmic reticulum stress [14].
Fig. 1. Effects of EC supplementation on metabolic parameters in HFD-fed mice.
A- (−)-Epicatechin chemical structure. B- food intake and C- body weight gain along the 15 w dietary treatments were measured weekly or biweekly. Results are shown as means ± SE and are the average of 9–10 animals/group. Values having different symbols (*,#) are significantly different between them and from values without symbols. (p < 0.05, repeated measurement ANOVA).
Current evidence points to the capacity of EC to improve insulin sensitivity. In this regard, a systematic review and meta-analysis of randomized, controlled trials showed an improvement of insulin sensitivity (HOMA-IR) in humans upon short-term consumption of flavanol-rich cocoa (cocoa flavonoids only include the flavan-3-ols (−)-epicatechin (EC) and (+)-catechin) [16]. Improvements in insulin sensitivity were also observed in association with cocoa consumption in healthy adults glucose-intolerant hypertensive subjects [15], and overweight/obese individuals [24]. Animal models of diet-induced obesity and T2D are being extensively used to understand the potential benefits of flavonoids. We previously observed that supplementation with EC improved parameters of insulin resistance and of the underlying events (inflammation, oxidative, and endoplasmic reticulum stress) in a rat model of fructose-induced MetS [14]. In addition, EC inhibited tumor necrosis alpha-induced activation of pro-inflammatory cascades in 3T3-L1adipocytes [20]. The mechanisms of fructose-induced MetS and T2D may be different from those underlying T2D triggered by consumption of high fat diets.
To further understand the potential benefits of dietary EC consumption on T2D, this study investigated the effects of EC supplementation on high fat diet-induced body weight gain and insulin resistance in mice. To assess the underlying mechanisms, the effects of high fat and EC consumption on the activation of insulin signaling and modulation of its regulators were evaluated. EC supplementation improved insulin sensitivity in high fat-fed mice, at least in part, through downregulation c-Jun N-terminal kinase (JNK), IκB kinase (IKK), protein kinase δ (PKCδ) and protein tyrosine phosphatase 1B (PTP1B). Thus, consumption of EC-rich foods can constitute a dietary strategy to mitigate obesity-associated insulin resistance.
2. Materials and methods
2.1. Materials
Cholesterol and triglyceride (TG) concentrations were determined using kits purchased from Wiener Lab Group (Rosario, Argentina). Free fatty acids (FFA) and insulin levels were determined using kits from Coat-A-Count (Siemens, CA). Antibodies for α-tubulin (sc-23948), and the insulin receptor (IR)β (sc-711) were from Santa Cruz Biotechnology (Santa Cruz, CA). Primary antibodies for extracellular signal-regulated kinases 1/2 (ERK1/2) (#4695), p-ERK (Thr202/Tyr204) (#4370), JNK (#9252), p-JNK (Thr183/Tyr185) (#9251), p-PKCδ (Thr505) (#9374), IKKα (#2682), p-IKKα/β (#2697) (Ser176/180), protein kinase B (AKT) (#4691), p-AKT (Ser473) (#4060), were obtained from Cell Signaling Technology (Danvers, MA). Antibody for p-IR (Tyr1162/Tyr1163) (448046G) was obtained from Invitrogen (Waltham, MA). Antibodies for insulin receptor substrate 1 (IRS1) (06–248), p-IRS1 (Tyr612) (09–432) and PTP1B (ABS40), and Luminata™ HRP chemiluminescence detection reagent were from Millipore Corp. (Billerica, MA). PVDF membranes and protein standards were obtained from BIO-RAD (Hercules, CA). The ECL Western blotting system was from Thermo Fisher Scientific Inc. (Piscataway, NJ). EC and all other reagents were purchased from Sigma (St. Louis, MO).
2.2. Animals and animal care
All procedures were in agreement with standards for care of laboratory animals as outlined in the NIH Guide for the Care and Use of Laboratory Animals. All procedures were administered under the auspices of the Animal Resource Services of the University of California, Davis. Experimental protocols were approved before implementation by the University of California, Davis Animal Use and Care Administrative Advisory Committee.
Healthy male C57BL/6J mice (20–25 g) (10 mice/group) were fed for 15weither: A-a diet containing approximately 10% total calories from fat (Control), B- a diet containing approximately 60% total calories from fat (lard) (HFD), or the control (C + E) and high fat diet (HFD + E) supplemented in the diet with 20 mg EC/kg body weight. EC-containing diets were prepared fresh every two weeks to account for changes in body weight and food intake, and to prevent EC degradation. All diets were stored at −20 °C until use. The amount of EC supplemented in the diet is based on our previous studies [14,25]. Although high considering current normal human EC consumption [26], this dietary amount could be achieved through supplementation or changes in dietary habits.
Body and food intake was measured weekly throughout the study. After 15 won the dietary treatments, and after overnight fast mice were weighed, 5 animals per group were intraperitoneally injected with either saline or insulin (10 U/Kg body weight human insulin (HumulinR; Eli Lilly)), and euthanized after 10 min. Blood was collected from the abdominal aorta into heparinized tubes, and plasma obtained after centrifugation at 1000g for 15 min at 4 °C. Epididymal adipose tissue, and liver were collected and weighed. Tissues were flash frozen in liquid nitrogen and then stored at −80 °C for further analysis.
2.3. Metabolic measurements
For insulin tolerance tests (ITT), mice were fasted for 4 h and injected intraperitoneally with 1 U/Kg body weight human insulin. Blood glucose values were measured before and at 15, 30, 45, 60, 90 and 120 min post-injection. For glucose tolerance tests (GTT), overnight fasted mice were injected with D-glucose (2 g/kg body weight), and blood glucose was measured before and at 15, 30, 60, and 120 min post-injection. For both tests glucose levels were measured using a glucometer (Easy Plus II, Home Aid Diagnostics Inc, Deerfield Beach, FL). Total and HDL cholesterol, TG, FFA, and insulin concentrations were determined following manufacturer's guidelines.
2.4. Western blot analysis
Tissues were homogenized as previously described [14]. Aliquots of total homogenates containing 25–40 µg protein were denatured with Laemmli buffer, separated by reducing 7.5–12.5% polyacrylamide gel electrophoresis, and electroblotted to PVDF membranes. Membranes were blocked for 2 h in 5% (w/v) bovine serum albumin and subsequently incubated in the presence of the corresponding primary antibodies (1:1000 dilution) overnight at 4 °C. After incubation for 90 min at room temperature in the presence of secondary antibodies (HRP conjugated) (1:10,000 dilution) the conjugates were visualized using enhanced chemiluminescence.
2.5. Statistical analysis
Data were analyzed by one-way analysis of variance (ANOVA) using Statview 5.0 (SAS Institute Inc., Cary, NC). Fisher least significance difference test was used to examine differences between group means. A repeated measure ANOVA with Tukey-Kramer multiple comparison test was used to analyze changes in body weight and food intake. A P value < 0.05 was considered statistically significant. Data are shown as mean ± SEM.
3. Results
3.1. Animal outcome
Daily food intake (Fig. 1B) between w 5 and 8 was significantly lower in mice fed high fat diets without (HFD) or with (HFD + EC) EC supplementation compared to those fed control diets without (C) or with (C + E) EC. All animals gained weight throughout the studied period (Fig. 1C). EC supplementation did not modify body weight gain in mice fed the C diet, but significantly reduced body weight gain in HFD-fed mice between w 9 and 15. After 15 won the HFD, mice showed a 30% increase in body weight compared to controls (Fig. 1A, Table 1). However, the body weight of mice fed HFD + EC was only 15% higher than that of controls. No effect of EC supplementation on body weight was observed in mice fed the control (Table 1).
Table 1.
Metabolic parameters.
| Parameter | Control | C + EC | HFD | HFD + EC |
|---|---|---|---|---|
| Body Weight (g) | 35.0 ± 0.6a | 32.6 ± 1.1a | 45.4 ± 1.3b | 40.1 ± 1.7c |
| TG (mg/dl) | 80.6 ± 0.6a | 61.2 ± 0.8a | 110.3 ± 1.1b | 70.1 ± 0.9c |
| FFA (mEq/l) | 0.39 ± 0.01a | 0.35 ± 0.01b | 0.54 ± 0.01c | 0.35 ± 0.01b |
| Total Cholesterol (mg/dl) | 163 ± 21a | 192 ± 11a | 232 ± 14b | 235 ± 22b |
| Fasted glucose (mg/dl) | 91 ± 6a | 69 ± 3b | 166 ± 8c | 131 ± 3d |
| Fed glucose (mg/dl) | 151 ± 7a | 157 ± 6a | 200 ± 12b | 171 ± 8a |
| Fasted Insulin (ng/ml) | 0.19 ± 0.10a | 0.15 ± 0.11a | 1.24 ± 0.27b | 0.42 ± 0.10a |
| Fed Insulin (ng/ml) | 0.96 ± 0.20a | 0.65 ± 0.11b | 2.04 ± 0.16c | 1.12 ± 0.11d |
Metabolic parameters from mice fed for 15 w the corresponding diets. Values are shown as means ± SE (n = 10). Values having different superscripts are significantly different (P < 0.05, one way ANOVA).
Consumption of HFD also caused dyslipidemia, i.e. plasma TG and FFA concentration were 36% and 38% higher in HFD-fed mice compared to controls (Table 1). In addition, EC supplementation prevented HFD-induced increase in both plasma TG and FFA. On the other hand, EC supplementation did not prevent the elevation (42%) in cholesterol concentration associated with HFD consumption. In C + E-fed mice those parameters were similar to controls, except for a significantly lower plasma FFA concentration.
3.2. EC improves glucose metabolism in mice fed a high fat diet
After 15 w on the respective diets both fasted and fed plasma glucose concentrations were higher (32 and 82%, respectively) in the HFD group compared to controls (Table 1). EC supplementation improved both parameters. In this regard, fed plasma glucose in the HFD + EC mice was similar to control values, and fasted plasma glucose was 44% lower than in HFD mice. In HFD-fed mice, plasma insulin concentrations were 6.5- and 2.1-fold higher in the fasted and fed states, respectively compared to controls. EC supplementation either prevented (fasted) or mitigated (fed) the increase in plasma insulin caused by HFD consumption. In mice fed EC-supplemented control diets, fasted plasma TG, FFA, and glucose where lower than in controls.
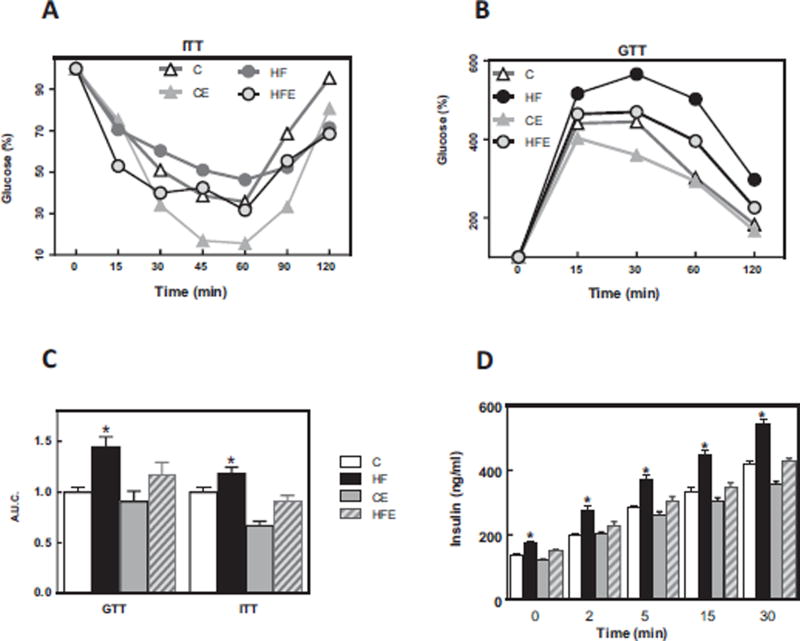
Consumption of the HFD mice caused impaired insulin (ITT) and glucose (GTT) tolerance tests (Fig. 2A, B). The area under the curve for the GTT and ITT in HFD-fed mice was 32 and 18% higher, respectively, than in controls (Fig. 2C). The levels of plasma insulin throughout the GTT were significantly higher in the HFD-fed group, and EC supplementation prevented this increase (Fig. 2D). Overall the above results showed that consumption of a HFD diet by C57BL/6J mice for 15 w caused insulin resistance, which was mitigated/prevented by EC supplementation.
Fig. 2. Effects of EC supplementation on metabolic parameters in HFD-fed mice.
A- ITT, B- GTT, C- Area under the curve for GTT and ITT tests, and D-plasma insulin concentration during GTT. ITT and GTT were performed on weeks 9 and 11 on the diets, respectively. Mice were fed a control diet (empty triangles and empty bars), the control diet supplemented with 20 mg EC/kg body weight (grey triangles and bars), a HFD (black circles and bars), or the HFD supplemented with 20 mg EC/kg body weight (grey circles and dashed bars). Results are shown as means ± SE and are the average of 9–10 animals/group. C,D- * significantly different from the other groups at the corresponding time points; (p < 0.05, one way ANOVA).
3.3. EC improves insulin signaling in liver and adipose tissue of mice fed a high fat diet
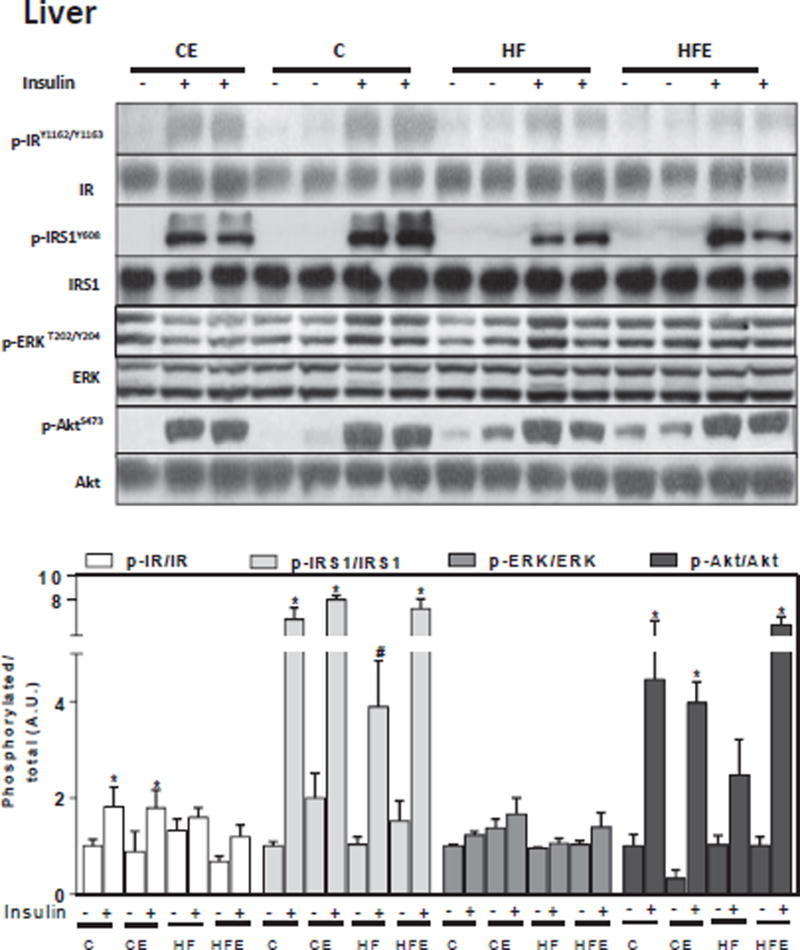
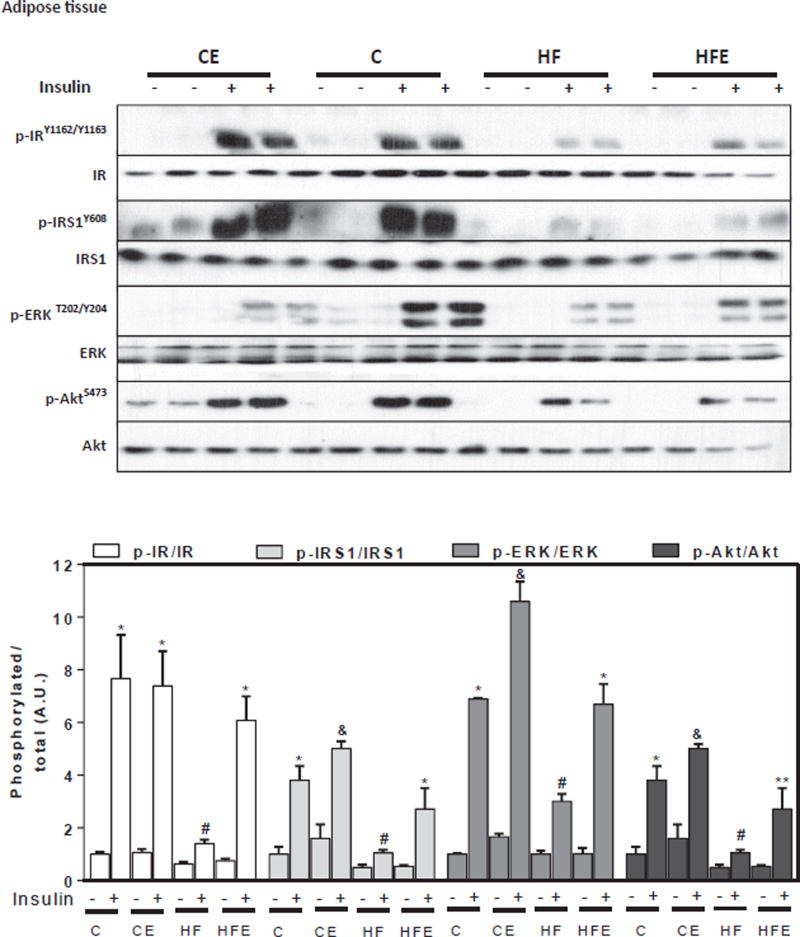
To understand the molecular events contributing to insulin resistance, we investigated the effects of HFD and of EC supplementation on insulin signaling in liver and adipose tissue. For this purpose, mice were i.p. injected with either saline or insulin 10 min before euthanasia. Basal and insulin-stimulated phosphorylation of major components of the insulin signaling cascade were assessed by Western blot. Phosphorylation of the IR at Tyr1162/Tyr1163, IRS1 at Tyr608, ERK1/2 at Thr202/Tyr204, and Akt at Ser473 were measured. In liver, and compared to controls, HFD feeding for 15 w decreased insulin-stimulated phosphorylation of the IR and IRS1, 27 and 39% respectively, and of downstream molecules such as Akt (45%), showing a trend (p = 0.1) for ERK1/2 (14%) (Fig. 3). Except for IR phosphorylation, EC dietary supplementation mitigated or prevented the downregulation of all these alterations associated with HFD consumption. In adipose tissue, mice fed HFD showed lower insulin-stimulated phosphorylation of the IR, IRS1, Akt and ERK1/2 (82, 71, 56 and 72%, respectively) compared to controls (Fig. 4). These changes were partially or completely prevented by EC supplementation (Fig. 3). The above results show that the observed alterations in glucose homeostasis caused by chronic consumption of HFD in mice are associated with impaired insulin signaling in the liver and adipose tissue, effects that are mitigated by EC supplementation.
Fig. 3. EC supplementation enhances liver insulin signaling in HFD-fed mice.
After 15 w on the corresponding diets, mice were fasted overnight then injected with saline or insulin (10 mU/g body weight) and then sacrificed after 10 min. Phosphorylation of IR, IRS1, ERK1/2, and Akt were measured in liver by Western blot. Bands were quantified and results for mice fed the control diet supplemented with EC (CE), the HFD (HF), and the HFD supplemented with EC (HFE) were referred to control group values (C). Representative immunoblots are shown. Bar charts represent p-IR/IR, p-IRS1/IRS1, p-ERK/ERK, and p-Akt/Akt as means ± SEM from 4 to 5 animals/treatment. *, # significantly different between them and from the insulin untreated groups (p < 0.05, one way ANOVA test).
Fig. 4. EC supplementation enhances adipose tissue insulin signaling in HFD-fed mice.
After 15 w on the corresponding diets, mice were fasted overnight then injected with saline or insulin (10 U/Kg body weight) and then sacrificed after 10 min. Phosphorylation of IR, IRS1, ERK1/2, and Akt were measured in adipose tissue homogenates by Western blot. Bands were quantified and results for mice fed the control diet supplemented with EC (CE), the HFD (HF), and the HFD supplemented with EC (HFE) were referred to control group values (C). Representative immunoblots are shown. Bar charts represent p-IR/IR, p-IRS1/IRS1, p-ERK/ERK, and p-Akt/Akt as means ± SEM from 4 to 5 animals/treatment. *,# significantly different between them, * significantly different from the insulin untreated groups, # not different from the untreated HF group, &,** significantly different from all other groups (p < 0.05, one way ANOVA test).
3.4. High fat diet consumption is associated with upregulation of events that inhibit insulin pathway
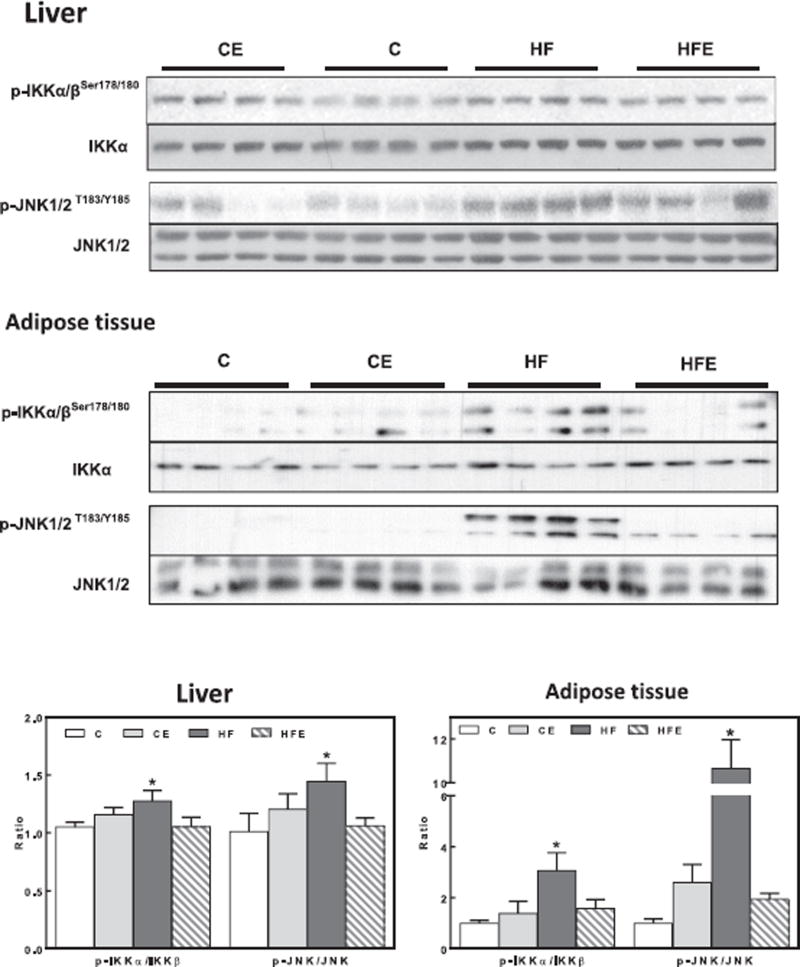
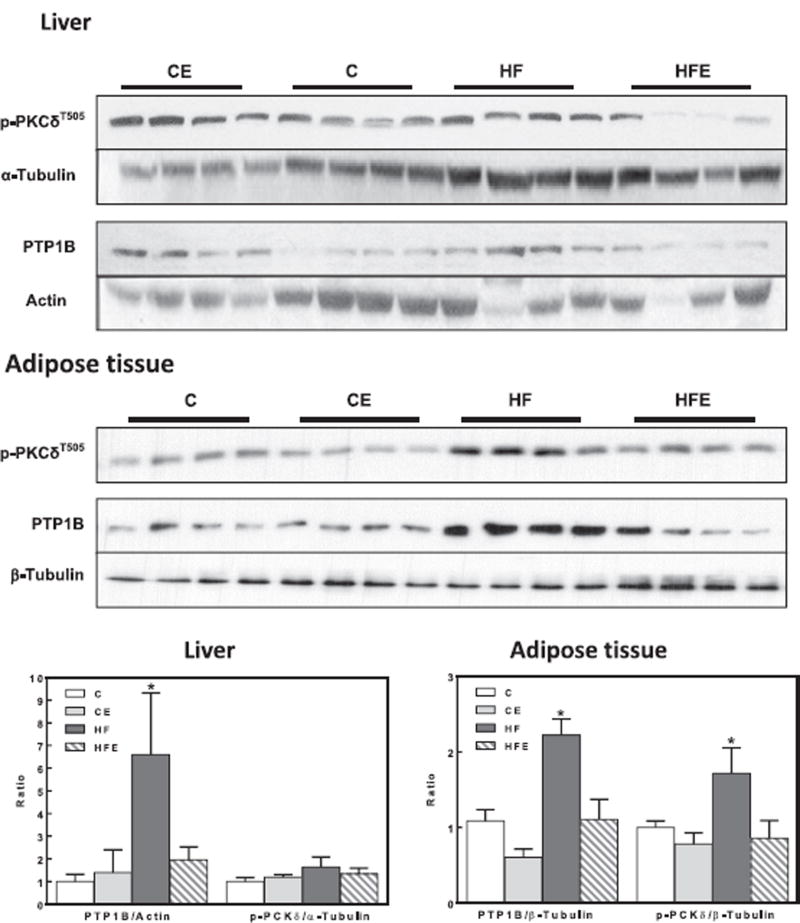
We next investigated if signals/proteins known to inhibit insulin signaling pathway could be affected by HFD consumption, and the potential benefits of EC supplementation. For this purpose, we measured the phosphorylation of JNK, IKK, and PKCδ, and expression of protein tyrosine phosphatase 1B (PTP1B) [27]. IKK phosphorylation at Ser176/180 and JNK phosphorylation at Thr183/Tyr185 were 27 and 44% higher in liver from HFD-fed mice compared to controls (Fig. 5). In adipose tissue, HFD feeding caused a 3- and 11-fold increase in IKK and JNK phosphorylation, respectively (Fig. 5). EC supplementation prevented HFD-induced activation of IKK and JNK both in liver and in adipose tissue. PKCδ phosphorylation (Thr505) was higher (72%) in adipose tissue but not in the liver from HFD mice compared to controls, while EC supplementation prevented this increase (Fig. 6).
Fig. 5. Effects of EC supplementation on liver and epididymal adipose tissue inhibitory insulin signaling in HFD-fed mice: IKK and JNK.
Phosphorylation of IKKα/β (Ser178/180), JNK (Thr183, Tyr185) in liver and epididymal adipose tissue after 15 w on the corresponding diets. Bands were quantified and results for mice fed the control diet supplemented with EC (CE), the HFD (HF), and the HFD supplemented with EC (HFE) were referred to control group values (C). Representative immunoblots are shown. Bar charts represent pIKKαβ/IKKαβ and pJNK/JNK as means ± SEM from 9 to 10 animals/treatment. * significantly different from all other groups (p < 0.05, one way ANOVA test).
Fig. 6. Effects of EC supplementation on liver and epididymal adipose tissue inhibitory insulin signaling in HFD-fed mice: PKCd and PTP1B.
Phosphorylation of PKCδ (Thr505) and PTP1B protein levels in liver and epididymal adipose tissue after 15 w on the corresponding diets. Bands were quantified and results for mice fed the control diet supplemented with EC (CE), the HFD (HF), and the HFD supplemented with EC (HFE) were referred to control group values (C). Representative immunoblots are shown. Bar charts represent p-PKCδ/tubulin and PTP1B/actin or tubulin as means ± SEM from 9 to 10 animals/treatment. *are significantly different from all other groups (p < 0.05, one way ANOVA test).
IKK is a kinase involved in the NF-κB activation pathway. NF-κB is a transcription factor that regulates the expression of multiple genes, including PTP1B a negative regulator of the insulin cascade [28]. The expression of PTP1B in rats fed the HFD-fed groups was 6.6- and 2.2-fold higher than in controls in liver and adipose tissue, respectively. This was not observed in the HFD-fed group supplemented with EC (Fig. 6).
4. Discussion
Long-term feeding of a high fat diet (60% calories from fat) triggered obesity and overt insulin resistance in C57BL/6J mice. This was associated with a downregulation of the insulin pathway. Dietary EC supplementation significantly improved insulin sensitivity and glucose homeostasis, improving HFD-induced impairment of the insulin signaling cascade in liver and adipose tissue. The capacity of EC to improve tissue insulin sensitivity can be in part due to its capacity to prevent the upregulation/activation of proteins that inhibit the insulin pathway, i.e. JNK, IKK, PKC, and PTP1B.
Obesity and overweight are a major public health concern worldwide. They constitute a risk for the development of several pathologies including insulin resistance and T2D [6]. In the current study, consumption of a high fat diet for 15 w led to obesity (73% higher body weight than controls) and insulin resistance in mice. Although the body weight gain was lower in the EC supplemented HFD mice, this reduction per se seems improbable to account for the observed major improvement of systemic insulin sensitivity. In mice fed a HFD similar to that the used in our current study, but receiving 16 times higher EC, the decrease in body weight gain was partial and of similar magnitude [29]. This suggests that at 20 mg/kg body weight/d, dietary EC may have already reached the maximum potential benefit on HFD-induced mouse body weight gain, and that higher EC consumption may have limited benefits. Independently on its limited effects on body weight gain, EC consumption could have a significant impact on insulin resistance prevention and/or management.
The development of obesity was associated with dyslipidemia as judged by the increase in plasma TG, FFA, and total cholesterol. Except for the hypercholesterolemia, EC supplementation prevented TG and FFA increases. Similar protective effects (prevention of TG but not of cholesterol increase) were observed in mice supplemented for 4 w with EC-3-O-β-d-allopyranoside after initial 8 w in a high fat diet [30]. We previously observed in high fructose-fed rats, that EC partially or completely prevented the elevation of plasma TG and cholesterol, respectively [14]. The above evidence indicates that the hypolipidemic actions of EC are not independent of the source of energy (high fat or high fructose). In addition, EC effects on body weight, dyslipidemia and insulin resistance could be in part explained by a direct effect of EC on energy expenditure. However, a recent study, using a similar model of HFD-induced obesity, showed that EC supplementation does not affect the intake, demand, and loss of energy, neither lipid oxidation rates [29].
Cumulative evidence is supporting a beneficial effect of EC on glucose homeostasis as we observed in this model of HFD-induced insulin resistance. We previously observed that in high fructose-fed rats [14], EC also prevented the development of impaired glucose tolerance and decreased insulin sensitivity. Accordingly, consumption of pure EC (100 mg/d) for 4 w caused a significant decrease in plasma insulin and in the HOMA-IR in healthy adults [31]. In addition, The improvement of insulin sensitivity by cocoa flavanols has been observed not only in healthy adults [32], but in glucose-intolerant hypertensive subjects [15], and in overweight/obese individuals [24]. A systematic review and meta-analysis of randomized, controlled trials presented evidence that consumption of flavonoid rich cocoa was associated with improvements in parameters of insulin sensitivity (HOMA-IR and insulin sensitivity index (ISI)) [16]. Thus, we can conclude/speculate that independently of the source and level of energy consumption, and the overall individual's health condition, EC targets specific mechanism/ s involved in the modulation of glucose homeostasis.
The assessment of the regulation by EC of the insulin signaling cascade in tissues that are central to glucose homeostasis, i.e. liver and adipose tissue, can provide insight into the anti- T2D actions of EC. High fat consumption impaired insulin-induced phosphorylation of IR, IRS1, Akt and ERK1/2 in adipose tissue and of IR, IRS1, and Akt in the liver. EC supplementation mitigated or prevented these alterations, implying a regulation by EC of the insulin signaling pathway.
In terms of the signaling pathways involved in the effects of EC, we observed EC's capacity to regulate several participants in the modulation of the insulin pathway in the two tissues studied. The insulin pathway can be downregulated by: i) PTP1B-mediated tyrosine de-phosphorylation of the IR and IRS1 [28]; ii) IRS-1 phosphorylation by IKK and JNK at serine/threonine residues [33,34], and iii) PKCδ via IKK and JNK activation [35]. In terms of obesity and high fat exposure, it has been observed that: i) IKK promotes insulin resistance, while inactivation or downregulation improves insulin sensitivity in cells and obese rodents [36,37]; ii) JNK1 activity is high in high fat-induced and genetic obese mice, and genetic deficits of JNK1 improve insulin sensitivity [38], and iii) PKCδ upregulation by FFA precedes hepatic IKK and JNK activation [35]. We observed that consumption of the HFD led to an increase in PTP1B expression, and to the activation (phosphorylation) of PKCδ, IKK and JNK. EC prevented all these changes, indicating that either EC is acting on an upstream event that is triggering the full cascade of effects or it may have multiple targets of action. One potential explanation for the beneficial effects of EC on insulin sensitivity is based on its anti-inflammatory and antioxidant actions.
Obesity and dyslipidemias are characterized by a condition of chronic inflammation affecting metabolic tissues [39]. Both, redox-sensitive NF-κB and JNK pathways play a central role in the self-feeding cycle of obesity-inflammation-oxidative stress [40]. EC has been previously described to mitigate oxidative stress, inflammation, and inhibit NF-κB and JNK both in vitro and in vivo [14,20,21,41]. In our HFD model, the ability of EC to inhibit the activation of the redox sensitive IKK/NF-κB and JNK, and as a consequence to downregulate PTP-1B can be due to: i) an indirect effect, through EC capacity to inhibit NADPH oxidase activity [23] and expression [14], and consequently reduce the formation of superoxide anion and derived oxidant species, and ii) a direct interaction with NF-κB, inhibiting its binding to DNA [41].
In summary, our findings showed that EC restores insulin sensitivity in a mouse model of obesity and T2D triggered by high fat consumption in mice. Further studies are required to identify EC target/s involved in its capacity to improve insulin sensitivity. This, and the identification of potential EC metabolites that are responsible for the effects on insulin signaling, will help define rational and effective dietary recommendations to help prevent/ mitigate insulin resistance.
Abbreviations
- EC
(−)-epicatechin
- ERK1/2
extracellular signal-regulated kinases 1/2
- FFA
free fatty acids
- GTT
glucose tolerance test
- HFD
high fat diet
- IκB
inhibitor of nuclear factor κB
- IKK
IκB kinase
- IR
insulin receptor
- IRS1
insulin receptor substrate 1
- ITT
insulin tolerance test
- JNK
c-Jun N-terminal kinase
- MAPKs
mitogen activated protein kinases
- MetS
metabolic syndrome
- PKCδ
protein kinase C delta
- PTP1B
protein tyrosine phosphatase 1B
- TG
triglycerides
- T2D
type 2 diabetes
- TNFα
tumor necrosis factor alpha.
Footnotes
This article is part of a Special Issue entitled Polyphenols and Health, edited by Helmut Sies and Christine Morand.
References
- 1.Friedman JM. Nature. 2009;459:340–342. doi: 10.1038/459340a. [DOI] [PubMed] [Google Scholar]
- 2.Spiegelman BM, Flier JS. Cell. 2001;104:531–543. doi: 10.1016/s0092-8674(01)00240-9. [DOI] [PubMed] [Google Scholar]
- 3.Khandekar MJ, Cohen P, Spiegelman BM. Nat. Rev. Cancer. 2011;11:886–895. doi: 10.1038/nrc3174. [DOI] [PubMed] [Google Scholar]
- 4.Mann JI. Nutr. Rev. 2006;64:422–427. doi: 10.1111/j.1753-4887.2006.tb00227.x. [DOI] [PubMed] [Google Scholar]
- 5.Yki-Jarvinen H. The Lancet Diabetes Endocrinol. 2014;2:901–910. doi: 10.1016/S2213-8587(14)70032-4. [DOI] [PubMed] [Google Scholar]
- 6.Guh DP, Zhang W, Bansback N, Amarsi Z, Birmingham CL, Anis AH. BMC Public Health. 2009;9:88. doi: 10.1186/1471-2458-9-88. [DOI] [PMC free article] [PubMed] [Google Scholar]
- 7.Aldekhail NM, Logue J, McLoone P, Morrison DS. Obes. Rev. Off. J. Int. Assoc. Study Obes. 2015:1071–1080. doi: 10.1111/obr.12318. [DOI] [PubMed] [Google Scholar]
- 8.Hostmark AT. Appl. Physiol. Nutr. Metab. 2010;35:816–825. doi: 10.1139/H10-080. [DOI] [PubMed] [Google Scholar]
- 9.Esmaillzadeh A, Kimiagar M, Mehrabi Y, Azadbakht L, Hu FB, Willett WC. Am. J. Clin. Nutr. 2006;84:1489–1497. doi: 10.1093/ajcn/84.6.1489. [DOI] [PubMed] [Google Scholar]
- 10.Kouki R, Schwab U, Hassinen M, Komulainen P, Heikkila H, Lakka TA, Rauramaa R. Eur. J. Clin. Nutr. 2011;65:368–377. doi: 10.1038/ejcn.2010.262. [DOI] [PubMed] [Google Scholar]
- 11.Panagiotakos DB, Pitsavos C, Skoumas Y, Stefanadis C. J. Am. Diet. Assoc. 2007;107:979–987. doi: 10.1016/j.jada.2007.03.006. [DOI] [PubMed] [Google Scholar]
- 12.Galleano M, Calabro V, Prince PD, Litterio MC, Piotrkowski B, Vazquez-Prieto MA, Miatello RM, Oteiza PI, Fraga CG. Ann. N. Y. Acad. Sci. 2012;1259:87–94. doi: 10.1111/j.1749-6632.2012.06511.x. [DOI] [PubMed] [Google Scholar]
- 13.Harnly JM, Doherty RF, Beecher GR, Holden JM, Haytowitz DB, Bhagwat S, Gebhardt S. J. Agric. Food Chem. 2006;54:9966–9977. doi: 10.1021/jf061478a. [DOI] [PubMed] [Google Scholar]
- 14.Bettaieb A, Vazquez-Prieto MA, Lanzi CR, Miatello RM, Haj FG, Fraga CG, Oteiza PI. Free Radic. Biol. Med. 2014:247–256. doi: 10.1016/j.freeradbiomed.2014.04.011. [DOI] [PMC free article] [PubMed] [Google Scholar]
- 15.Grassi D, Desideri G, Necozione S, Lippi C, Casale R, Properzi G, Blumberg JB, Ferri C. J. Nutr. 2008;138:1671–1676. doi: 10.1093/jn/138.9.1671. [DOI] [PubMed] [Google Scholar]
- 16.Shrime MG, Bauer SR, McDonald AC, Chowdhury NH, Coltart CE, Ding EL. J. Nutr. 2011;141:1982–1988. doi: 10.3945/jn.111.145482. [DOI] [PubMed] [Google Scholar]
- 17.Gutierrez-Salmean G, Ortiz-Vilchis P, Vacaseydel CM, Garduno-Siciliano L, Chamorro-Cevallos G, Meaney E, Villafana S, Villarreal F, Ceballos G, Ramirez-Sanchez I. Eur. J. Pharmacol. 2014;728:24–30. doi: 10.1016/j.ejphar.2014.01.053. [DOI] [PubMed] [Google Scholar]
- 18.Curtis PJ, Sampson M, Potter J, Dhatariya K, Kroon PA, Cassidy A. Diabetes Care. 2012;35:226–232. doi: 10.2337/dc11-1443. [DOI] [PMC free article] [PubMed] [Google Scholar]
- 19.Galleano M, Oteiza PI, Fraga CG. J. Cardiovasc Pharmacol. 2009;54:483–490. doi: 10.1097/FJC.0b013e3181b76787. [DOI] [PMC free article] [PubMed] [Google Scholar]
- 20.Vazquez-Prieto MA, Bettaieb A, Haj FG, Fraga CG, Oteiza PI. Archives Biochem. Biophys. 2012:113–118. doi: 10.1016/j.abb.2012.02.019. [DOI] [PMC free article] [PubMed] [Google Scholar]
- 21.Contreras TC, Ricciardi E, Cremonini E, Oteiza PI. Archives Biochem. Biophys. 2015;573:84–91. doi: 10.1016/j.abb.2015.01.024. [DOI] [PubMed] [Google Scholar]
- 22.Schroeter H, Heiss C, Balzer J, Kleinbongard P, Keen CL, Hollenberg NK, Sies H, Kwik-Uribe C, Schmitz HH, Kelm M. Proc. Natl. Acad. Sci. U. S. A. 2006;103:1024–1029. doi: 10.1073/pnas.0510168103. [DOI] [PMC free article] [PubMed] [Google Scholar]
- 23.Steffen Y, Gruber C, Schewe T, Sies H. Archives Biochem. Biophys. 2008;469:209–219. doi: 10.1016/j.abb.2007.10.012. [DOI] [PubMed] [Google Scholar]
- 24.Davison K, Coates AM, Buckley JD, Howe PR. Int. J. Obes. Lond. 2008;32:1289–1296. doi: 10.1038/ijo.2008.66. [DOI] [PubMed] [Google Scholar]
- 25.Vazquez Prieto MA, Bettaieb A, Rodriguez Lanzi C, Soto VC, Perdicaro DJ, Galmarini CR, Haj FG, Miatello RM, Oteiza PI. Mol. Nutr. Food Res. 2015;59:622–633. doi: 10.1002/mnfr.201400631. [DOI] [PMC free article] [PubMed] [Google Scholar]
- 26.Vogiatzoglou A, Mulligan AA, Lentjes MA, Luben RN, Spencer JP, Schroeter H, Khaw KT, Kuhnle GG. PLoS One. 2015;10:e0128132. doi: 10.1371/journal.pone.0128132. [DOI] [PMC free article] [PubMed] [Google Scholar]
- 27.Elchebly M, Cheng A, Tremblay ML. J. Mol. Med. 2000;78:473–482. doi: 10.1007/s001090000141. [DOI] [PubMed] [Google Scholar]
- 28.Haj FG, Zabolotny JM, Kim YB, Kahn BB, Neel BG. J. Biol. Chem. 2005;280:15038–15046. doi: 10.1074/jbc.M413240200. [DOI] [PubMed] [Google Scholar]
- 29.Hoek-van den Hil EF, van Schothorst EM, van der Stelt I, Swarts HJ, van Vliet M, Amolo T, Vervoort JJ, Venema D, Hollman PC, Rietjens IM, Keijer J. Genes Nutr. 2015;10:469. doi: 10.1007/s12263-015-0469-z. [DOI] [PMC free article] [PubMed] [Google Scholar]
- 30.Shih CC, Wu JB, Jian JY, Lin CH, Ho HY. Int. J. Mol. Sci. 2015;16:24983–25001. doi: 10.3390/ijms161024983. [DOI] [PMC free article] [PubMed] [Google Scholar]
- 31.Dower JI, Geleijnse JM, Gijsbers L, Zock PL, Kromhout D, Hollman PC. Am. J. Clin. Nutr. 2015;101:914–921. doi: 10.3945/ajcn.114.098590. [DOI] [PubMed] [Google Scholar]
- 32.Grassi D, Lippi C, Necozione S, Desideri G, Ferri C. Am. J. Clin. Nutr. 2005;81:611–614. doi: 10.1093/ajcn/81.3.611. [DOI] [PubMed] [Google Scholar]
- 33.Samuel VT, Liu ZX, Wang A, Beddow SA, Geisler JG, Kahn M, Zhang XM, Monia BP, Bhanot S, Shulman GI. J. Clin. Invest. 2007;117:739–745. doi: 10.1172/JCI30400. [DOI] [PMC free article] [PubMed] [Google Scholar]
- 34.Wei Y, Pagliassotti MJ. Am. J. Physiol. Endocrinol. Metab. 2004;287:E926–E933. doi: 10.1152/ajpendo.00185.2004. [DOI] [PubMed] [Google Scholar]
- 35.Pereira S, Park E, Mori Y, Haber CA, Han P, Uchida T, Stavar L, Oprescu AI, Koulajian K, Ivovic A, Yu Z, Li D, Bowman TA, Dewald J, El-Benna J, Brindley DN, Gutierrez-Juarez R, Lam TK, Najjar SM, McKay RA, Bhanot S, Fantus IG, Giacca A. Am. J. Physiol. Endocrinol. Metab. 2014;307:E34–E46. doi: 10.1152/ajpendo.00436.2013. [DOI] [PMC free article] [PubMed] [Google Scholar]
- 36.Yuan M, Konstantopoulos N, Lee J, Hansen L, Li ZW, Karin M, Shoelson SE. Science. 2001;293:1673–1677. doi: 10.1126/science.1061620. [DOI] [PubMed] [Google Scholar]
- 37.Cai D, Yuan M, Frantz DF, Melendez PA, Hansen L, Lee J, Shoelson SE. Nat. Med. 2005;11:183–190. doi: 10.1038/nm1166. [DOI] [PMC free article] [PubMed] [Google Scholar]
- 38.Hirosumi J, Tuncman G, Chang L, Gorgun CZ, Uysal KT, Maeda K, Karin M, Hotamisligil GS. Nature. 2002;420:333–336. doi: 10.1038/nature01137. [DOI] [PubMed] [Google Scholar]
- 39.Gregor MF, Hotamisligil GS. Annu. Rev. Immunol. 2011;29:415–445. doi: 10.1146/annurev-immunol-031210-101322. [DOI] [PubMed] [Google Scholar]
- 40.Blaser H, Dostert C, Mak TW, Brenner D. Trends Cell Biol. 2016 doi: 10.1016/j.tcb.2015.12.002. S0962-8924(15)00249-4. [DOI] [PubMed] [Google Scholar]
- 41.Mackenzie GG, Carrasquedo F, Delfino JM, Keen CL, Fraga CG, Oteiza PI. FASEB J. 2004;18:167–169. doi: 10.1096/fj.03-0402fje. [DOI] [PubMed] [Google Scholar]


