

Abstract
Aim:
Since a few studies exist on the association of neck circumference (NC) and obesity with blood pressure (BP) among adolescents in India, we found it highly relevant to measure the NC and body mass index (BMI) using them as indicators of upper body subcutaneous fat and obesity and relate them to BP in a rural and urban adolescent population in North Tamil Nadu.
Materials and Methods:
This is a community-based cross-sectional study of descriptive design where 500 students from urban and rural areas were selected, and their BMI, NC, and BP were measured using standardized instruments.
Results:
Among urban and rural population high and normal NC positively correlated with BMI, systolic BP (SBP) and diastolic BP (DBP), indicating that the data clearly reflects increase in BMI, SBP, and DBP values with increase in NC or vice versa. The correlation was statistically significant (P < 0.001) significantly higher BMI (P < 0.01), SBP (P < 0.05), and NC (P < 0.001) was observed in urban population than rural. DBP was not significantly different in rural and urban population. 95th percentile values are significantly higher than rest in both urban and rural population. Only the 95th percentile values correlate and reflect similar changes in BMI, SBP, and DBP.
Conclusion:
Our studies indicate a strong association of elevation in BP with high NC and increase in BMI. Overweight and obesity were positively correlated with increase in SBP and DBP.
Keywords: Blood pressure, hypertension, neck circumference, obesity, rural population, urban population
INTRODUCTION
The unabated increase in the prevalence of overweight and obesity in children and adolescents is one of the most alarming public health issues facing the world today.[1] A high prevalence of overweight and obesity has been observed in adolescent students which are rapidly becoming one of the most prominent conditions affecting them.[2] Overweight and obesity are known risk factors for noncommunicable diseases such as cardiovascular diseases, hypertension, diabetes, cancer (breast, colon, and endometrial), osteoarthritis, and fractures.[3] A high prevalence of obesity, especially the presence of upper body subcutaneous fat is a significant risk factor for hypertension and cardiovascular diseases. Deposition of both subcutaneous as well as visceral fat in obese individuals makes them more prone to cardiovascular diseases.[4] It was reported that upper body fat deposition was more harmful than visceral fat deposition.[5] High levels of this fat deposit are associated with increased levels of free fatty acids which is the one of the causes for the metabolic abnormalities observed in obesity.[6] Adipokines which are secreted by the adipose tissue are involved in regulating the pro-inflammatory state related to metabolic syndrome, which is a condition increasing cardiovascular morbidity, mortality, and risk for type 2 diabetes mellitus.[7]
Measurement of neck circumference (NC) is a simple, noninvasive procedure to detect pre-hypertension and hypertension which can easily be done in children and adolescents. Early identification of pre-hypertension and hypertension among adolescents both in rural and urban areas will help in reducing the incidence of hypertension in the adult population in the near future, thereby significantly reducing the hypertension-related health-related burden in our country. Since a few studies exist on the association of NC and obesity[8] with blood pressure (BP) among adolescents in India, we found it highly relevant to measure the NC and body mass index (BMI) using them as indicators of upper body subcutaneous fat and obesity and relate them to BP in a rural and urban adolescent population in North Tamil Nadu.
MATERIALS AND METHODS
The present community-based cross-sectional observational study was conducted in the rural area of Kuthambakkam, Thiruvallur district and in the urban area of Chennai, Tamil Nadu. A total of 514 boys and girls from the rural and urban schools, of Kuthambakkam, Thiruvallur district and Chennai city respectively from 8th, 9th, 10th, 11th, and 12th standards, of which 258 were from rural area and 256 from urban area were included in the study. The study protocol was approved by the Institutional Ethical Committee (007/07/2016/IEC/SU). The following criteria were used in selecting the participants.
Inclusion criteria
Adolescent children in the age group of 13–17 years
Willing participants
Not attending any weight loss program, nor taking medications that could affect BP
Those who were not physically disabled and nonpregnant girls were included in the study
Not suffering from any major diseases.
After taking permission from the school authorities, the class teachers of the 8th, 9th, 10th, 11th, and 12th standards were explained the purpose of the study, a rapport was built up with the children and their consents were obtained. The purpose of the study and the nature of the information which had to be furnished by the study subjects were explained to them. Strict confidentiality was maintained with the information collected. Demographic information of all children in the sampled classes was obtained including name, gender, date of birth, residential address, and parental education. All the measurements for the subjects participating in the study were recorded in the mornings or early afternoons without shoes and in lightweight uniforms.
Measurement of body mass index
Weight (kg) was recorded using standardized weighing machine and height (cm) using a stadiometer. BMI was calculated using the standard BMI formula-subject's weight in kilograms divided by the square of height in meters (kg/m2). According to the specifications of Centre for Disease Control, the children were classified into two groups based on BMI: Healthy-weight (BMI <85th percentile) and overweight (overweight: 85< BMI <95th percentile; obese (BMI >95th percentile).[9]
Measurement of neck circumference
NC was measured by the making the adolescent stand erect with the head positioned in the Frankfurt horizontal plane. The top edge of the tape metric will be placed just below the laryngeal prominence and positioned perpendicular to the long axis of the neck at the level of the thyroid cartilage, and the circumference measured to the value close to 0.1 cm. The participants with NC at < 90th percentile were considered to be normal NC and values of NC >90th were used to use to identity subjects with high NC.[10]
Measurement of blood pressure
BP was recorded in the sitting position after 5 min of rest using standard mercury manometer (Diamond BP Apparatus Mercurial – Deluxe). BP was measured three times with a 5 min interval between the measurements, and the average of the three measurements was taken. Accordingly in all the school children, normal BP was defined as systolic BP (SBP) and diastolic BP (DBP) below the 90th percentile, prehypertension was defined as an average SBP or DBP levels between >90th percentile and <95th percentile; and hypertension was defined as an average SBP or DBP >95th percentile.[10,11]
Data analysis
Data were analyzed by IBM SPSS Statistics for Windows, IBM Corp. Armonk, NY: Pearson correlation followed by t-test was used (r) to observe the significance of the association between the parameters. Unpaired t test was used to compare the significance of difference of the parameters between rural and urban children. One way analysis of variance followed by Bonferroni's multiple comparison test was used to compare the significance of difference of 85th, 90th, and 95th percentiles. P < 0.05 was considered statistically significant.
RESULTS
Among urban population high and normal NC positively correlated with BMI, SBP, and DBP, indicating that the data clearly reflects an increase in BMI, SBP, and DBP values with increase in NC or vice versa. The correlation was statistically significant (P < 0.001) [Table 1] [Figure 1].
Table 1.
Correlation of high and normal with body mass index, systolic blood pressure, and diastolic blood pressure in urban school children
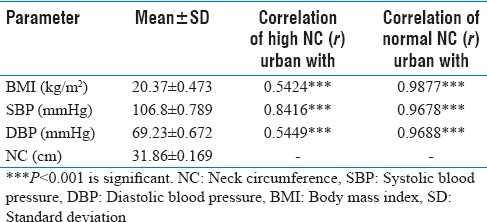
Figure 1.

Correlation of high and normal with body mass index, systolic blood pressure, and diastolic blood pressure in urban school children. NC: Neck circumference, SBP: Systolic blood pressure, DBP: Diastolic blood pressure, BMI: Body mass index
Among rural population high and normal NC positively correlated with BMI, SBP, and DBP, indicating that the data clearly reflects an increase in BMI, SBP, and DBP values with increase in NC or vice versa. The correlation was statistically significant (P < 0.001) [Table 2] [Figure 2].
Table 2.
Correlation of high and normal neck circumference with body mass index, systolic blood pressure, and diastolic blood pressure in rural school children
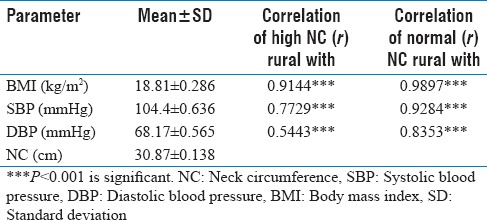
Figure 2.

Correlation of high and normal neck circumference with body mass index, systolic blood pressure, and diastolic blood pressure in rural school children. NC: Neck circumference, SBP: Systolic blood pressure, DBP: Diastolic blood pressure, BMI: Body mass index
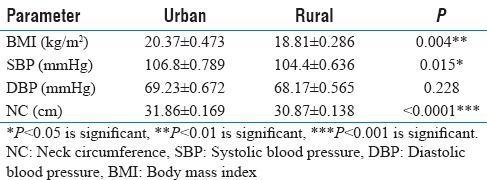
Significantly higher BMI (P < 0.01), SBP (P < 0.05), and NC (P < 0.001) was observed in urban population when compared with rural. DBP was not significantly different in rural and urban population [Figure 3] [Table 3].
Figure 3.
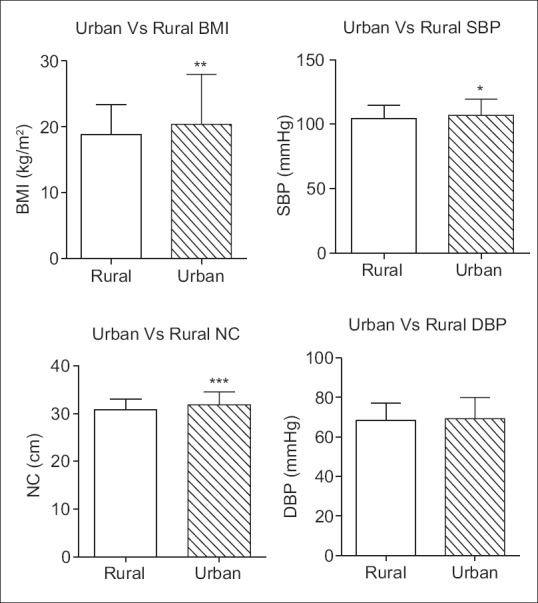
Comparison of body mass index, systolic blood pressure, diastolic blood pressure, and neck circumference in rural and urban school children. *P < 0.05 is significant, **P < 0.01 is significant, ***P < 0.001 is significant. NC: Neck circumference, SBP: Systolic blood pressure, DBP: Diastolic blood pressure, BMI: Body mass index
Table 3.
Comparison of body mass index, systolic blood pressure, diastolic blood pressure, and neck circumference in rural and urban school children
95th percentile values are significantly higher than rest in both urban and rural population. Only the 95th percentile values correlate and reflect similar changes in BMI, SBP, and DBP [Figures 4 and 5].
Figure 4.
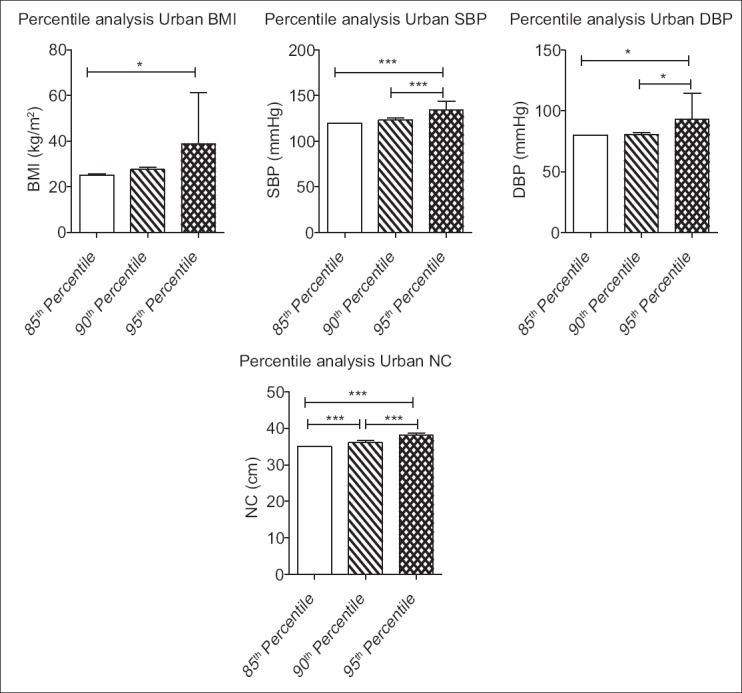
Comparison of 85th, 90th, and 95th percentile body mass index, systolic blood pressure, diastolic blood pressure, and neck circumference among urban school children. *P < 0.05 is significant, ***P < 0.001 is significant. NC: Neck circumference, SBP: Systolic blood pressure, DBP: Diastolic blood pressure, BMI: Body mass index
Figure 5.
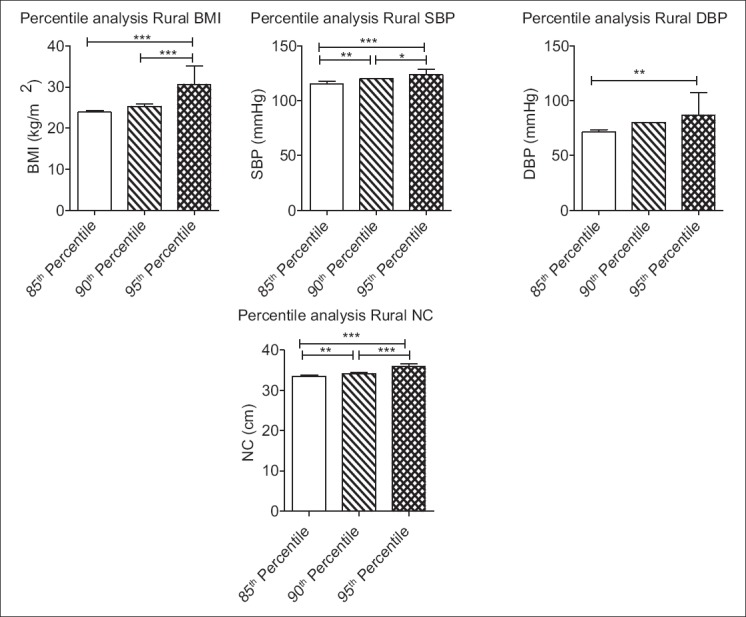
Comparison of 85th, 90th, and 95th percentile body mass index, systolic blood pressure, diastolic blood pressure, and neck circumference among rural school children *P < 0.05 is significant, **P < 0.01 is significant, ***P < 0.001 is significant. NC: Neck circumference, SBP: Systolic blood pressure, DBP: Diastolic blood pressure, BMI: Body mass index
DISCUSSION
We hypothesized that NC, overweight, and obesity as measured by BMI is significantly associated with BP among adolescents in both urban and rural population in North Tamil Nadu. Our hypothesis was confirmed by this study. In this study, increase in NC was significantly correlated with increase in SBP and DBP with higher NC showing a more significant association with elevated BP among the adolescent school children in both urban and rural areas. This is in agreement with a study conducted in Greek children, in both boys and girls, NC was strongly associated with cardiovascular disease risk factors such as SBP and insulin.[12] The Framingham heart study has shown a positive correlation between NC and cardiovascular disease risk factors.[13] Zhou et al.[13] have done a cross-sectional study in adults wherein they have observed that NC was significantly associated with SBP, diastolic BP in both males and females. Studies by Fox et al. have shown a strong positive correlation between visceral adipose tissue and metabolic risk factors.[14] The study findings are supported by a recent case study done in children and adolescents showing a significant association of NC with high BP.[10]
According to our studies, increase in BMI showed a significant positive correlation with BP. Both overweight and obesity in the children was strongly associated with increase in SBP as well as DBP. Our findings are in agreement with previous studies which have shown a positive association of overweight/obesity with pre-hypertension and hypertension in schoolchildren aged 6–16 years.[15] Earlier studies reported that overweight and obese children have a greater risk of increased BP than children with normal weight. Increased incidence of elevated levels of cholesterol, triglycerides, and BP was observed in overweight, obese children, and adolescents compared to people with normal weight.[16]
High NC in combination with obesity was observed to be a strong risk factor for hypertension.[10] Nafiu et al. have shown a significant positive association of NC and obesity with increase in BP in a cross-sectional study done in children.[17] Similar to these observations, our data indicated that children with high NC along with obesity had a significant association with elevated BP Limitations of our study was that it was only conducted in a limited sample of students aged 13–17 years, whereas our findings need to be confirmed and elaborated in larger sample size. Since there is no exact cut-off value for NC we have used the cut-off value as 90th percentile of NC in our study sample. The study data have clearly indicated that urban children had higher values of BMI, NC, and SBP than rural children, therefore, indicating an increased risk of developing prehypertension or hypertension in urban children.
Limitations
Boys versus girls in the groups are not analyzed separately. Results can be interpreted by considering this fact.
CONCLUSION
Our studies indicate a strong association of elevation in BP with high NC and increase in BMI. Overweight and obesity were positively correlated with an increase in SBP and DBP. Obesity is highly prevalent among children and adolescents in our country. A high prevalence of obesity, especially the presence of upper.
Body subcutaneous fat is a significant risk factor for hypertension and cardiovascular diseases. Measurement of NC is a simple, noninvasive procedure to detect prehypertension and hypertension which can easily be done in children and adolescents. NC measurement can be used as a simple screening tool to identify prehypertension and hypertension in large population. Early identification will help in planning strategies for the prevention, management, and treatment of prehypertension and hypertension among adolescents both in rural and urban areas.
Financial support and sponsorship
Nil.
Conflicts of interest
There are no conflicts of interest.
Acknowledgment
The authors would like to thank the ICMR-STS programme, Saveetha Medical College and Hospital for their assistance in the conduct of this study.
REFERENCES
- 1.Weiss R, Caprio S. The metabolic consequences of childhood obesity. Best Pract Res Clin Endocrinol Metab. 2005;19:405–19. doi: 10.1016/j.beem.2005.04.009. [DOI] [PubMed] [Google Scholar]
- 2.Biro FM, Wien M. Childhood obesity and adult morbidities. Am J Clin Nutr. 2010;91:1499S–505S. doi: 10.3945/ajcn.2010.28701B. [DOI] [PMC free article] [PubMed] [Google Scholar]
- 3.Obesity and Overweight, Fact Sheet Updated; March. 2013. [Last accessed on 2014 Apr 11]. Available from: http://www.who.int/mediacentre/factsheets/fs311/en/
- 4.Sjöström CD, Håkangård AC, Lissner L, Sjöström L. Body compartment and subcutaneous adipose tissue distribution – Risk factor patterns in obese subjects. Obes Res. 1995;3:9–22. doi: 10.1002/j.1550-8528.1995.tb00116.x. [DOI] [PubMed] [Google Scholar]
- 5.Ferretti Rde L, Cintra Ide P, Passos MA, de Moraes Ferrari GL, Fisberg M. Elevated neck circumference and associated factors in adolescents. BMC Public Health. 2015;15:208. doi: 10.1186/s12889-015-1517-8. [DOI] [PMC free article] [PubMed] [Google Scholar]
- 6.Nielsen S, Guo Z, Johnson CM, Hensrud DD, Jensen MD. Splanchnic lipolysis in human obesity. J Clin Invest. 2004;113:1582–8. doi: 10.1172/JCI21047. [DOI] [PMC free article] [PubMed] [Google Scholar]
- 7.Horská K, Kucerová J, Suchý P, Kotolová H. Metabolic syndrome – Dysregulation of adipose tissue endocrine function. Ceska Slov Farm. 2014;63:152–9. [PubMed] [Google Scholar]
- 8.Kumar S, Gupta A, Jain S. Neck circumference as a predictor of obesity and overweight in rural central India. Int J Med Public Health. 2012;2:62–6. [Google Scholar]
- 9.Kuczmarski RJ, Ogden CL, Guo S. 2000 CDC Growth Charts for the United States: Methods and Development. Vital Health Stat 11(246) Washington: National Center for Health Statistics; 2002. [PubMed] [Google Scholar]
- 10.Kuciene R, Dulskiene V, Medzioniene J. Association of neck circumference and high blood pressure in children and adolescents: A case-control study. BMC Pediatr. 2015;15:127. doi: 10.1186/s12887-015-0444-2. [DOI] [PMC free article] [PubMed] [Google Scholar]
- 11.National High Blood Pressure Education Program Working Group on High Blood Pressure in Children and Adolescents. The fourth report on the diagnosis, evaluation, and treatment of high blood pressure in children and adolescents. Pediatrics. 2004;114(2 Suppl 4th Report):555–76. [PubMed] [Google Scholar]
- 12.Androutsos O, Grammatikaki E, Moschonis G, Roma-Giannikou E, Chrousos GP, Manios Y, et al. Neck circumference: A useful screening tool of cardiovascular risk in children. Pediatr Obes. 2012;7:187–95. doi: 10.1111/j.2047-6310.2012.00052.x. [DOI] [PubMed] [Google Scholar]
- 13.Zhou JY, Ge H, Zhu MF, Wang LJ, Chen L, Tan YZ, et al. Neck circumference as an independent predictive contributor to cardio-metabolic syndrome. Cardiovasc Diabetol. 2013;12:76. doi: 10.1186/1475-2840-12-76. [DOI] [PMC free article] [PubMed] [Google Scholar]
- 14.Fox CS, Massaro JM, Hoffmann U, Pou KM, Maurovich-Horvat P, Liu CY, et al. Abdominal visceral and subcutaneous adipose tissue compartments: Association with metabolic risk factors in the Framingham Heart Study. Circulation. 2007;116:39–48. doi: 10.1161/CIRCULATIONAHA.106.675355. [DOI] [PubMed] [Google Scholar]
- 15.Badi MA, Garcia-Triana BE, Suarez-Martinez R. Overweight/obesity and hypertension in schoolchildren aged 6-16 years, Aden Governorate, Yemen, 2009. East Mediterr Health J. 2012;18:718–22. doi: 10.26719/2012.18.7.718. [DOI] [PubMed] [Google Scholar]
- 16.Flechtner-Mors M, Thamm M, Wiegand S, Reinehr T, Schwab KO, Kiess W, et al. Comorbidities related to BMI category in children and adolescents: German/Austrian/Swiss Obesity Register APV compared to the German KiGGS Study. Horm Res Paediatr. 2012;77:19–26. doi: 10.1159/000334147. [DOI] [PubMed] [Google Scholar]
- 17.Nafiu OO, Zepeda A, Curcio C, Prasad Y. Association of neck circumference and obesity status with elevated blood pressure in children. J Hum Hypertens. 2014;28:263–8. doi: 10.1038/jhh.2013.93. [DOI] [PubMed] [Google Scholar]