

Abstract
Background
The associations between individual cardiovascular disease risk factors and leukocyte telomere length (LTL) have been inconclusive. We investigated the association between LTL and overall cardiovascular health (CVH) as defined by the American Heart Association and whether the association is modified by sex and race/ethnicity.
Methods and Results
We included 5194 adults (aged ≥20) from the National Health and Nutrition Examination Survey 1999–2002. CVH was defined as a composite score of the 7 metrics (smoking, physical activity, diet, body mass index, blood pressure, total cholesterol, and fasting blood glucose) and categorized as “poor,” “intermediate,” and “ideal.” LTL was assayed from whole blood using the quantitative polymerase chain reaction method relative to standard reference DNA. Multivariable linear regression models were used to estimate the association between CVH and log‐transformed LTL. We found strong graded association between CVH and LTL in the overall sample, with evidence of dose‐response relationship (P for trend=0.013). Individuals with poor and intermediate CVH had significantly shorter LTL than individuals with ideal CVH (−3.4% [95% CI=−6.0%, −0.8%] and −2.4% [−4.4%, −0.3%], respectively), after adjustment for demographic variables, socioeconomic status, and C‐reactive protein. The association was stronger in women (−6.6% [−10.2%, −2.9%] for poor vs ideal CVH) and non‐Hispanic whites (−4.3% [−7.1%, −1.4%] for poor vs ideal CVH).
Conclusions
The findings suggest that less‐than‐ideal CVH is associated with shorter LTL, but this association varies by sex and race/ethnicity. Future longitudinal research is needed to elucidate the mechanisms that underlie the association between CVH and LTL.
Keywords: aging, AHA Scientific Statement, cardiovascular disease risk factors, cardiovascular health, diverse populations, epidemiology, inflammation, leukocyte telomere length, telomere genetics
Subject Categories: Aging, Cardiovascular Disease, Epidemiology, Race and Ethnicity, Inflammation
Introduction
Telomeres are repetitive, noncoding DNA sequences (TTAGGG) located at the ends of chromosomes and play a vital role in providing genomic stability and maintaining chromosomal structural integrity.1 In vitro, telomeres shorten progressively with each cell division, acting as an internal “molecular clock” of aging.2 This process is further enhanced by oxidative stress with each cycle of replication in cultured cells.3 When telomeres become critically short, they trigger an irreversible DNA damage leading to cellular senescence or apoptosis, which may contribute to age‐related diseases.4 In humans, leukocyte telomere length (LTL), which mirrors the replicative history of hematopoietic stems cells (HSCs), is a highly heritable trait and shows large interindividual variation at birth and throughout life course.5, 6 LTL shortening therefore reflects the decline in HSCs reserve attributed to lifelong accumulation of inflammation and oxidative stress—two biological processes of atherosclerosis and cardiovascular disease (CVD).5 Consequently, LTL has been proposed as a potential biomarker of age‐related CVD. Indeed, clinical studies have shown an association between shorter LTL and increased risk of CVD, including atherosclerosis, arterial stiffness, myocardial infarction, coronary heart disease (CHD), stroke, and heart failure, independent of chronical age, although the causality of these associations remain elusive.7, 8, 9, 10, 11
In addition, several epidemiological studies have reported an association between LTL and individual CVD risk factors, but the results have been inconsistent. Some studies have demonstrated an association of shorter LTL with smoking, obesity, physical inactivity, poor diet, hypertension, and type 2 diabetes mellitus.12, 13, 14, 15, 16, 17 However, other studies did not find such an association between LTL and individual CVD risk factors.18, 19, 20, 21 For example, a recent study found no association between LTL and type 2 diabetes mellitus in a large, nationally representative sample of US adults.19 The reasons for these inconsistencies remain the subject of further research, but it has been attributed to differences in populations, methods used to measure telomere length, poor measurements of telomere length, small and nonrepresentative samples, or failure to account for potential confounders.22 In addition, these inconsistencies might also reflect the complex process of LTL shortening, which is likely the result of multiple of CVD risk factors working together synergistically rather than a single CVD risk factor.23 However, the majority of these studies have focused on the association of LTL with individual CVD risk factors. We are aware of only 1 study that has evaluated an association between LTL and disease burden across systems (CVD, stroke, pulmonary disease, diabetes mellitus, kidney disease, arthritis, or depression) and showed that LTL was strongly associated with a physiological index of disease burden, but less strongly or not at all with disease in individual systems.23
In this context, the American Heart Association (AHA) Strategic Impact Goals 2020 introduced the concept of “cardiovascular health” (CVH) to quantify an individual's overall burden of CVD risk factors.24 CVH was defined based on 7 behaviors and health factors, including smoking, physical activity, diet, body mass index, total cholesterol, fasting blood glucose, and blood pressure. Each CVH metric was defined as “ideal,” “intermediate,” and “poor.” Ideal CVH metrics have consistently been found to be associated with reduced CVD morbidity and mortality and greater longevity.25, 26, 27 Accumulating evidence also suggests that individuals with ideal CVH metrics develop less subclinical atherosclerosis, such as coronary artery calcification, carotid intima media thickness, and arterial stiffness.28, 29, 30 Additionally, individuals with ideal CVH have been found to be associated with lower burden of inflammatory markers and oxidative stress.30 These findings underscore the strong predictive value of CVH for vascular alterations or damages than the sum of its components. Given that LTL registers the accruing burden of inflammation and oxidative stress over the life course of an individual and its strong relationship with atherosclerosis,31 it may be that LTL is a better index of vascular alterations or damages associated with poor CVH than indices of inflammation and oxidative stress, which reflect momentary metabolic status at the time of blood collection. It might therefore be of interest to examine the association between LTL and CVH. To our knowledge, no previous study has examined the association between LTL and the CVH construct as defined by AHA, and it is also not clear whether this association is modified by sex and racial/ethnic groups.
Therefore, the objective of this study was to examine the association of CVH with LTL in a large, nationally representative, and ethnically diverse sample of US adults from the National Health and Nutrition Examination Survey (NHANES) 1999–2002. In addition, we examined whether the association was modified by sex and race/ethnicity. We also assessed whether the association between CVH and LTL was attenuated by adjustment for C‐reactive protein, a global biomarker of inflammation.
Methods
Sample and Procedures
We used data from the NHANES, a nationally representative survey conducted by the National Center for Health Statistics (NCHS), Centers for Disease Control and Prevention (CDC). NHANES is a complex, stratified multistage probability sample of the noninstitutionalized US population. For this analysis, we merged NHANES surveys from 1999 to 2000 and 2001 to 2002 because these surveys collected DNA specimens for examination of LTL on participants aged 20 years or older. Of the 10 291 participants aged ≥20 years, 7826 (76.0%) had LTL data. We excluded 653 participants who reported either “other” or “other Hispanic” because of small sample size and mixed composition. We also excluded 782 participants with ≥85 years and those with self‐reported history of CVD (heart attack, angina, CHD, stroke, or heart failure) to reduce survival bias among the extreme elderly22 and potential bias attributed to association of CVD with both LTL and CVH. Additionally, we also excluded 1086 participants because of missing information on CVH metrics, demographic, socioeconomic status (SES), and C‐reactive protein. This resulted in a final sample of 5194 participants. The NHANES surveys for 1999–2002 were approved by the NCHS ethics board and all participants provided written informed consent. The NHANES data sets are available in the public domain, and this study was exempted from human subject review by the National Institutes of Health Office for Human Subjects Research Protections.
LTL Measurement
Detailed analytical methods for assaying LTL have been published elsewhere.32 Briefly, DNA was extracted from whole blood and purified using the Puregene kit protocol (Gentra Systems, Inc., Minneapolis, MN) by the NCHS, CDC. The LTL assay was performed in the laboratory of Dr Elizabeth Blackburn at the University of California, San Francisco (San Francisco, CA), using the quantitative polymerase chain reaction method. This method measures the ratio of telomere length (T) relative to standard (S) single‐copy gene reference, known as the T/S ratio.33 Each sample was assayed twice, and if the variability was >7%, then a third assay was run. The 2 closest T/S ratio values were used to calculate an average. The interassay coefficient of variation was 4.4%. The CDC conducted a quality‐control review before linking the telomere data to the NHANES 1999–2002 public‐use data files.
Cardiovascular Health
CVH was assessed based on 7 metrics: smoking status; physical activity; diet; body mass index; total cholesterol; fasting blood glucose; and blood pressure. Each metric was categorized into 3 levels of “poor,” “intermediate,” and “ideal” and assigned scores of 0, 1, and 2, respectively, according to the AHA definitions (as outlined in Table 1).24 A total CVH score was calculated by summing scores for each of the 7 CVH metrics, ranging from 0 to 14, with the highest of indicating better CVH. Total CVH score was then categorized into poor (0–7), intermediate (8–10), or ideal (11–14) levels of CVH according to previous literature.34
Table 1.
Definition of CVH, NHANES, 1999–2002
| CVH Component | Score | Definition |
|---|---|---|
| Smoking status | ||
| Poor (0) | Smoked at least 100 cigarettes during their lifetime and currently smoking either every day or some days | |
| Intermediate (1) | Smoked at least 100 cigarettes during their lifetime but currently did not smoke | |
| Ideal (2) | Never smoked 100 cigarettes during their lifetime | |
| Physical activity | ||
| Poor (0) | No exercise | |
| Intermediate (1) | 1 to 149 minutes of moderate exercise or 1 to 74 minutes of vigorous exercise/week | |
| Ideal (2) | 150+ minutes of moderate exercise or 75+ minutes of vigorous exercise/week | |
| Diet | ||
| Poor (0) | <50 HEI‐2005 | |
| Intermediate (1) | 50 to 80 HEI‐2005 | |
| Ideal (2) | ≥81 HEI‐2005 | |
| Body mass index | ||
| Poor (0) | ≥30 kg/m2 | |
| Intermediate (1) | 25.0 to 29.99 kg/m2 | |
| Ideal (2) | <25.0 kg/m2 | |
| Total cholesterol | ||
| Poor (0) | ≥240 mg/dL | |
| Intermediate (1) | 200 to 239 mg/dL or treated to <200 mg/dL | |
| Ideal (2) | <200 mg/dL and untreated | |
| Blood pressure | ||
| Poor (0) | SBP ≥140 mm Hg or DBP ≥90 mm Hg | |
| Intermediate (1) | SBP 120 to 139 mm Hg or DBP 80 to 89 mm Hg or treated to <120/80 mm Hg | |
| Ideal (2) | <120/80 mm Hg and untreated | |
| Fasting blood sugar | ||
| Poor (0) | ≥126 mg/dL fasting | |
| Intermediate (1) | 100 to 125 mg/dL fasting or treated to <100 mg/dL | |
| Ideal (2) | <100 mg/dL fasting and untreated | |
CVH indicates cardiovascular health; DBP, diastolic blood pressure; HEI, The Healthy Eating Index; NHANES, National Health and Nutrition Examination Survey; SBP, systolic blood pressure.
Smoking status was categorized as ideal (never smokers, those who reported never having smoked 100 cigarettes during their lifetime), intermediate (former smokers, those who reported smoking at least 100 cigarettes during their lifetime but currently did not smoke), and poor (current smokers, those who smoked 100 cigarettes during their lifetime and were still currently smoking). Physical activity was assessed based on frequency and duration of moderate and vigorous intensity of leisure, transportation, and household activities and classified as ideal (≥150 min/week moderate intensity, ≥75 min/week vigorous intensity, or equivalent combination), intermediate (1–149 min/week moderate intensity, 1–74 min/week vigorous intensity, or equivalent combination), and poor (no moderate and vigorous activity). Body mass index was classified as ideal (<25 kg/m2), intermediate (25 to <30 kg/m2), and poor (≥30 kg/m2).
Healthy dietary score was assessed based on the Healthy Eating Index‐2005 (HEI‐2005). The HEI‐2005 is a measure of diet quality that evaluates the extent to which an individual's dietary conforms to the 2005 US Dietary Guidelines.35 It is composed of 12 nutrients‐ and food‐based components collected by 24‐hour dietary recalls. The first 6 components, including total fruit, whole fruit, total vegetables, dark green and orange vegetables and legumes, and total grains and whole grains, are each given a score of 0 to 5 points. The next 5 components, including milk, meat and beans, oils, saturated fat, and sugar, are each given 0 to 10 points. The last component that reflects calories from solid fat, alcohol, and added sugars is given 0 to 20 points. The total HEI‐2005 scores of the 12 components range from 0 to 100. In this analysis, participants with an HEI‐2005 score <50 were categorized as poor diet quality; those with a score of >50 to <81 were assigned to intermediate diet quality; and those with a score of ≥81 were assigned to ideal diet quality as previously defined by Ford et al.36
Total cholesterol, fasting glucose, and blood pressure were measured according to a standard protocols. The use of cholesterol‐lowering, antihypertensive, and diabetic medications were determined based on self‐report. Total cholesterol status was classified as ideal (untreated and <200 mg/dL), intermediate (treated to <200 or 200–239 mg/dL), and poor (≥240 mg/dL). Fasting blood glucose was classified as ideal (untreated and <100 mg/dL), intermediate (treated to <100 or 100–125 mg/dL), and poor (≥126 mg/dL). Blood pressure was measured based an average of up to 3 systolic (SBP) and diastolic blood pressure (DBP) readings. For participants with only 1 blood pressure reading, that single reading was used. Blood pressure was classified as ideal (untreated and <120/<80 mm Hg), intermediate (treated to <120/<80 mm Hg or 120–139/80–89 mm Hg), and poor (≥140/90 mm Hg).
Other Covariates
Other covariates included age (years), sex (women or men), race/ethnicity (non‐Hispanic whites, non‐Hispanic blacks, and Mexican‐Americans), nativity (foreign‐born or US‐born), and marital status (married/partner or never married/separated/divorced/widowed). Education was classified into 4 groups: less than high school, completed high school or General Educational Development (GED), some college/associate degree, and college graduate or more. Poverty income ratio (PIR) was calculated as the family's income divided by the federal poverty level as defined by the Department of Health and Human Services' poverty guidelines.37 C‐reactive protein (mg/dL) level was measured by high‐sensitivity latex‐enhanced nephelometry by the immunology Division, Department of Laboratory Medicine, University of Washington Medical Center. Age, PIR, and C‐reactive protein were included as continuous variables for this analysis.
Statistical Analysis
All statistical analyses were conducted using SAS survey procedures (SAS 9.3; SAS Institute Inc., Cary, NC) and accounted for the NHANES complex multistage sampling design. Because the distribution of LTL was non‐normal, it was natural log‐transformed before analysis. The characteristics of the study sample across sex and racial/ethnic groups were compared by calculating weighted means and SEs for continuous variables and weighted percentages for categorical variables. We also examined the characteristics of the study sample according to the CVH categories. In addition, we also calculated age‐adjusted geometric means of LTL by sociodemographic characteristics, C‐reactive protein levels, and CVH categories, adjusting for the age distribution of the US population according to the 2000 census.
We used multivariable linear regression models to examine the association between CVH and log‐LTL. We ran 3 sequential models, adjusting for key confounders and/or mediators. Model 1 was adjusted for demographic variables (age, sex, race/ethnicity, marital status, and nativity). Model 2 was additionally adjusted for SES (education and income). Model 3 was further adjusted for C‐reactive protein to test whether the relationship between LTL and CVH is partially explained by the biomarker for the inflammation. In addition, we also performed tests for interactions between CVH and sex and race/ethnicity by including interaction terms in the regression models. Given that the dependent variable LTL was log‐transformed, the regression coefficients (β) were exponentiated using the formula 100%×(eβ−1), with the 95% CIs estimated as 100%×(e(β±1.96×SE)−1) and presented as percent differences comparing poor and intermediate CVH with ideal CVH.38 Statistical tests for linear trends were evaluated by entering CVH categories as ordinal variable in the regression model. In addition, we also reported the stratified analyses by sex and race/ethnicity given that there were significant interactions by sex (P for interaction=0.048) and race/ethnicity (P for interaction=0.065). All tests were 2‐sided, and a P value of <0.05 was considered statistically significant.
Results
Weighted distributions of baseline characteristics of the study sample by sex and race/ethnicity are shown in Table 2. Of the 5194 participants, 2725 were women and 2459 were men. The study sample also comprised 2851 non‐Hispanic whites, 929 non‐Hispanic blacks, and 1414 Mexican Americans. The average age of participants in the study sample was 44.2 years, and there was no significant difference between women and men (44.7 years vs 43.6 years; P=0.272). However, there was significant difference in age by race/ethnicity (P<0.001), with 45.3 years for non‐Hispanic whites, 41.1 years for non‐Hispanic blacks, and 37.2 years for Mexican Americans. Significant differences in sociodemographic and C‐reactive protein levels were also observed by sex and race/ethnicity. Table 3 presents the distribution of baseline characteristics of the study sample according to the categories of CVH. Overall, 22% of the study participants had an ideal CVH (11–14), 44% had an intermediate CVH (8–10), and 34% had a poor CVH (0–7). Adults with an ideal CVH were younger, more likely to be women and non‐Hispanic whites, and had higher education and PIRs, but lower levels of CRP, compared to adults with intermediate or poor CVH (P<0.001 for all; Table 3).
Table 2.
Weighted Characteristics of Study Participants by Sex and Race/Ethnicity, NHANES, 1999–2002
| Characteristica , b | All | Women | Men | P Value | Non‐Hispanic Whites | Non‐Hispanic Blacks | Mexican‐Americans | P Value |
|---|---|---|---|---|---|---|---|---|
| N (%)c | 5194 | 2725 (51.7) | 2459 (48.3) | 2851 (82.0) | 929 (9.2) | 1414 (8.2) | ||
| T/S ratiod, mean (95% CI) | 1.06 (1.03, 1.09) | 1.06 (1.03, 1.09) | 1.05 (1.02, 1.08) | 0.333 | 1.05 (1.02, 1.08) | 1.12 (1.08, 1.16) | 1.05 (1.01, 1.09) | 0.168 |
| T/S ratiod , e, GM (95% CI) | 1.03 (1.00, 1.06) | 1.03 (1.00, 1.06) | 1.02 (1.00, 1.05) | 0.323 | 1.02 (0.99, 1.05) | 1.09 (1.05, 1.13) | 1.03 (0.99, 1.07) | 0.201 |
| Age (y), mean (SE) | 44.2 (0.395) | 44.7 (0.436) | 43.6 (0.527) | 0.272 | 45.3 (0.442) | 41.1 (0.423) | 37.2 (0.589) | <0.001 |
| Education, n (%) | 0.012 | <0.001 | ||||||
| Less than high school | 1595 (17.5) | 797 (17.0) | 798 (18.1) | 408 (12.2) | 327 (31.2) | 860 (54.5) | ||
| High school/GED | 1226 (26.5) | 648 (26.6) | 578 (26.4) | 782 (27.6) | 220 (24.3) | 224 (18.7) | ||
| Some college or AA degree | 1341 (29.8) | 770 (32.0) | 571 (27.4) | 826 (30.6) | 267 (31.8) | 248 (19.8) | ||
| College degree or above | 1032 (26.1) | 510 (24.4) | 522 (28.0) | 835 (29.6) | 115 (12.8) | 82 (7.2) | ||
| Poverty income ratio, mean (SE) | 3.2 (0.073) | 3.0 (0.074) | 3.3 (0.076) | <0.001 | 3.4 (0.089) | 2.3 (0.106) | 2.1 (0.094) | <0.001 |
| Foreign born, n (%) | 1084 (9.5) | 533 (8.2) | 551 (11.0) | <0.001 | 135 (4.3) | 98 (10.5) | 851 (60.8) | <0.001 |
| Married/partner, n (%) | 3432 (67.3) | 1708 (65.2) | 1724 (69.5) | 0.006 | 1998 (69.8) | 427 (44.5) | 1007 (69.6) | <0.001 |
| C‐reactive protein (mg/dL)||, GM (95% CI) | 0.19 (0.18, 0.20) | 0.23 (0.21, 0.25) | 0.15 (0.14, 0.16) | <0.001 | 0.18 (0.17, 0.19) | 0.22 (0.19, 0.25) | 0.2 (0.18, 0.22) | <0.001 |
AA indicates associate in arts; GED, General Educational Development; GM indicates geometric mean; LTL, leukocyte telomere length; NHANES, National Health and Nutrition Examination Survey.
Estimates were expressed as mean (SE) or N (percent). For variables with skewed distribution, data are expressed as GM and 95% CI.
Mean (SE), percent (%), and GM (95% CI) are based on weighted data.
N is based unweighted data.
T/S ratio, leukocyte telomere length relative to standard reference DNA.
Data were natural log‐transformed before analysis because of skewed distribution.
Table 3.
Weighted Characteristics of Study Participants According to CVH Categories, NHANES, 1999–2002
| Characteristica , b | Poor (Score 0–8) | Intermediate (Score 9–10) | Ideal (Score 11–14) | P Valuec |
|---|---|---|---|---|
| N (%)d | 1921 (33.8) | 2337 (44.0) | 936 (22.2) | |
| Age (y), mean (SE) | 49.4 (0.488) | 43.8 (0.560) | 37.1 (0.601) | <0.001 |
| Sex, n (%) | ||||
| Men | 975 (35.4) | 1123 (46.4) | 371 (18.2) | <0.001 |
| Women | 946 (32.3) | 1214 (41.8) | 565 (26.0) | |
| Race/ethnicity, n (%) | <0.001 | |||
| Non‐Hispanic whites | 990 (33.4) | 1252 (43.1) | 609 (23.5) | |
| Non‐Hispanic blacks | 420 (40.4) | 396 (45.1) | 113 (14.5) | |
| Mexican Americans | 511 (29.1) | 689 (51.9) | 214 (19.0) | |
| Education, n (%) | <0.001 | |||
| Less than high school | 755 (47.2) | 693 (43.3) | 147 (9.5) | |
| High school/GED | 493 (40.7) | 551 (43.6) | 182 (15.7) | |
| Some college/AA degree | 437 (30.9) | 626 (45.3) | 278 (23.4) | |
| College degree or above | 236 (21.1) | 467 (43.4) | 329 (35.5) | |
| Poverty income ratio, mean (SE) | 2.90 (0.080) | 3.17 (0.079) | 3.50 (0.098) | <0.001 |
| Nativity, n (%) | ||||
| US born | 1576 (34.7) | 1795 (43.4) | 739 (22.1) | 0.030 |
| Foreign born | 345 (27.1) | 542 (49.4) | 197 (23.5) | |
| Marital status, n (%) | ||||
| Married/partner | 1247 (34.0) | 1564 (43.9) | 621 (22.1) | 0.954 |
| Never married, separated, divorced or widowed | 674 (33.4) | 773 (44.2) | 315 (22.4) | |
| C‐reactive protein (mg/dL)e, GM (95% CI) | 0.31 (0.29, 0.33) | 0.17 (0.16, 0.19) | 0.1 (0.09, 0.11) | <0.001 |
AA indicates associate in arts; CVH, cardiovascular health; GED, General Educational Development; GM, geometric mean; LTL, leukocyte telomere length; NHANES, National Health and Nutrition Examination Survey.
Estimates were expressed as n (%) or mean (SE). For variables with skewed distribution, estimates are expressed as GM and 95% CI.
Percent (%), mean (SE), and GM (95% CI) are based on weighted data.
P value from chi‐square test and univariate linear regression.
N is based on unweighted data.
Data were natural log‐transformed before analysis because of skewed distribution.
Age‐adjusted geometric means (GM) and 95% CI of LTL by demographic, SES, C‐reactive protein, and CVH categories are presented in Table 4. Age‐adjusted GM of LTL was longer in women than in men (1.01 [95% CI=0.98, 1.04] vs 0.99 [0.96, 1.02]; P=0.038). Non‐Hispanic blacks had longer age‐adjusted GM of LTL (1.04 [1.00, 1.07]) than Mexican Americans (1.00 [0.97, 1.03]) and non‐Hispanic whites (0.97 [0.93, 1.01]; P=0.025). In addition, age‐adjusted LTL increased progressively with increasing categories of CVH (P for trend, <0.001) and decreasing levels of C‐reactive protein (P for trend=0.021). Adults with an ideal CVH had longest age‐adjusted GM of LTL (1.03 [1.01, 1.06]) followed by adults with an intermediate CVH (1.00 [0.97, 1.03]) and shortest among adults with a poor CVH (0.98 [0.95, 1.02]; Figure). Furthermore, adults who had lower C‐reactive protein levels had longer age‐adjusted GM of LTL than those with higher C‐reactive protein levels.
Table 4.
Age‐Adjusted Geometric Mean of Leukocyte Telomere Length (T/S Ratio)a by Characteristics of Study Participants, NHANES, 1999–2002
| Characteristic | Geometric Meanb , c (95% CI) | P Value |
|---|---|---|
| Age, y | <0.001 | |
| 20 to 39 | 1.11 (1.08, 1.14) | |
| 30 to 59 | 1.01 (0.98, 1.04) | |
| 60 or older | 0.89 (0.87, 0.92) | |
| Sex | 0.038 | |
| Men | 0.99 (0.96, 1.02) | |
| Women | 1.01 (0.98, 1.04) | |
| Race/ethnicity | 0.025 | |
| Non‐Hispanic whites | 0.97 (0.93, 1.01) | |
| Non‐Hispanic blacks | 1.04 (1.00, 1.07) | |
| Mexican Americans | 1.00 (0.97, 1.03) | |
| Education | 0.011 | |
| Less than high school | 0.97 (0.94, 1.00) | |
| High school/GED | 1.01 (0.97, 1.04) | |
| Some college/associate degree | 1.00 (0.97, 1.03) | |
| College degree or above | 1.01 (0.98, 1.04) | |
| Poverty income ratio | 0.156 | |
| <1 | 1.00 (0.97, 1.03) | |
| 1 to 3 | 0.99 (0.96, 1.02) | |
| >3 | 1.01 (0.98, 1.04) | |
| Nativity | ||
| US born | 1.00 (0.97, 1.03) | 0.983 |
| Foreign born | 1.00 (0.97, 1.03) | |
| Marital status | 0.166 | |
| Married/partner | 0.99 (0.97, 1.02) | |
| Never married, separated, divorced or widowed | 1.02 (0.99, 1.04) | |
| C‐reactive protein, mg/dL | 0.021 | |
| <0.1 | 1.02 (1.00, 1.05) | |
| 0.1 to 0.3 | 1.00 (0.97, 1.03) | |
| >0.3 | 0.98 (0.95, 1.15) | |
| CVH | <0.001 | |
| Poor | 0.98 (0.95, 1.02) | |
| Intermediate | 1.00 (0.97, 1.03) | |
| Ideal | 1.03 (1.01, 1.06) |
CVH indicates cardiovascular health; GED, General Educational Development; LTL, leukocyte telomere length; NHANES, National Health and Nutrition Examination Survey.
T/S ratio, leukocyte telomere length relative to standard reference DNA.
Geometric mean (95% CI) is based on weighed data.
Age‐adjusted by direct method to the year 2000 population using the age group 20 to 39 years, 40 to 50 years, and 60 years or older.
Figure 1.
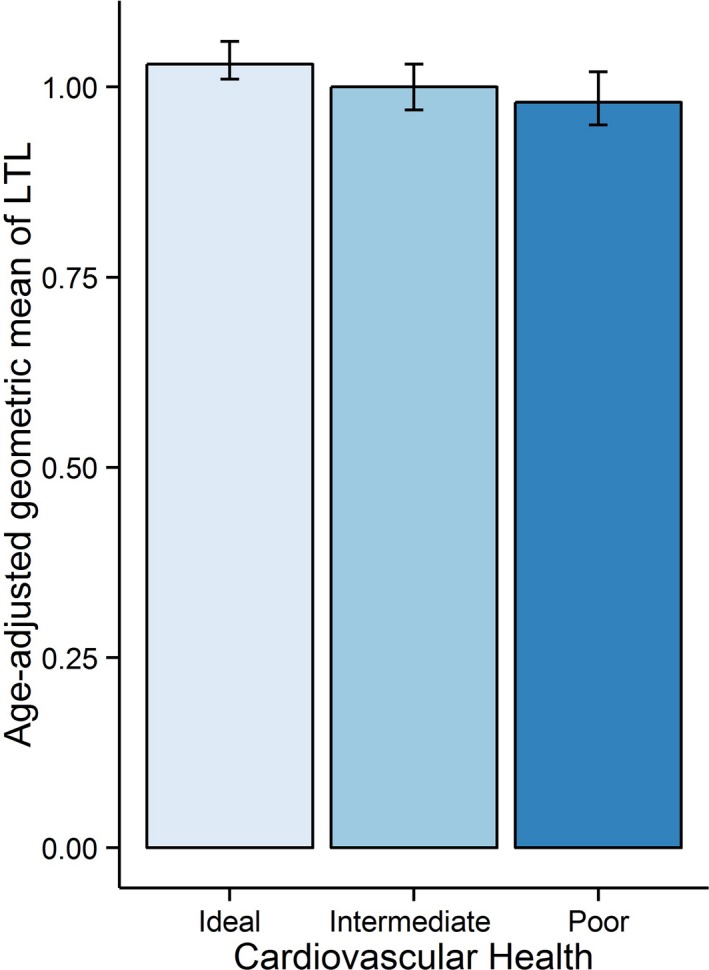
Age‐adjusted geometric mean of leukocyte telomere length (log T/S ratio) by cardiovascular health categories in the overall sample.
Table 5 shows the results of the multivariable regression models estimating the association between CVH and LTL in the overall sample. The results indicated that there was significant positive dose‐response relationship between CVH and LTL in all adjusted models (P for trend, <0.05). In a model adjusted for age, sex, race/ethnicity, marital status, and nativity (model 1), adults having poor and intermediate CVH were associated with shorter LTL compared to those with ideal CVH (percent difference=−4.67% [95% CI=−7.87, −1.46], P=0.006 for poor vs ideal CVH and −2.98 [95% CI=−5.24, −0.72], P=0.011 for intermediate vs ideal CVH), with a significant dose‐response relationship (P for trend=0.007). After adjustment for income and education (model 2), the association was slightly attenuated, but remained statistically significant (percent difference=−3.88% [95% CI=−6.52, −1.25], P=0.005 for poor CVH and −2.56% [95% CI=−4.58, −0.54], P=0.015 for intermediate CVH; P for trend=0.006). This association further attenuated, but largely persisted, following additional adjustment for C‐reactive protein—a global biomarker for inflammation (model 3). In the fully adjusted model, adults with poor and intermediated CVH were associated with −3.41% ([95% CI=−5.97, −0.84]; P=0.011) and −2.37% ([95% CI=−4.41, −0.33]; P=0.024) shorter LTL, respectively, compared to those with ideal CVH (P for trend=0.013). In addition, elevated C‐reactive protein levels were associated with shorter LTL in the fully adjusted model (percent difference=−1.60% [95% CI=−2.69, −0.50]; P=0.006).
Table 5.
Percent Difference (95% CI) in the Association Between CVH and Leukocyte Telomere Length (Log‐Transformed T/S Ratio)a, NHANES, 1999–2002
| Model 1 | Model 2 | Model 3 | ||||
|---|---|---|---|---|---|---|
| Percentb Difference (95% CI) | P Value | Percent Difference (95% CI) | P Value | Percent Difference (95% CI) | P Value | |
| Overall sample (n=5194) | ||||||
| CVH | ||||||
| Poor | −4.67 (−7.87, −1.46) | 0.006 | −3.88 (−6.52, −1.25) | 0.005 | −3.41 (−5.97, −0.84) | 0.011 |
| Intermediate | −2.98 (−5.24, −0.72) | 0.011 | −2.56 (−4.58, −0.54) | 0.015 | −2.37 (−4.41, −0.33) | 0.024 |
| Ideal | Referent | Referent | Referent | |||
| P for trend | 0.007 | 0.006 | 0.013 | |||
| C‐reactive protein | −1.60 (−2.69, −0.50) | 0.006 | ||||
| Women (n=2725) | ||||||
| CVH | ||||||
| Poor | −7.17 (−11.50, −2.83) | 0.002 | −7.00 (−10.74, −3.26) | 0.001 | −6.56 (−10.23, −2.88) | 0.001 |
| Intermediate | −5.29 (−7.90, −2.68) | <0.001 | −5.22 (−7.56, −2.89) | <0.001 | −5.07 (−7.42, −2.71) | <0.001 |
| Ideal | Referent | Referent | Referent | |||
| P for trend | 0.002 | <0.001 | 0.001 | |||
| C‐reactive protein | −1.10 (−2.66, 0.46) | 0.160 | ||||
| Men (n=2469) | ||||||
| CVH | ||||||
| Poor | −1.93 (−4.61, 0.80) | 0.161 | −0.54 (−2.77, 1.70) | 0.628 | −0.12 (−2.35, 2.11) | 0.913 |
| Intermediate | −0.24 (−3.20, 2.72) | 0.869 | 0.54 (−2.35, 3.44) | 0.705 | 0.72 (−2.21, 3.65) | 0.619 |
| Ideal | Referent | Referent | Referent | |||
| P for trend | 0.099 | 0.426 | 0.692 | |||
| C‐reactive protein | −2.26 (−3.92, −0.61) | 0.009 | ||||
| Non‐Hispanic whites (n=2851) | ||||||
| CVH | ||||||
| Poor | −5.67 (−9.18, −2.17) | 0.003 | −4.81 (−7.67, −1.95) | 0.002 | −4.26 (−7.08, −1.44) | 0.004 |
| Intermediate | −3.62 (−6.24, −1.00) | 0.008 | −3.15 (−5.51, −0.80) | 0.010 | −2.94 (−5.33, −0.56) | 0.017 |
| Ideal | Referent | Referent | Referent | |||
| P for trend | 0.045 | 0.002 | 0.004 | |||
| C‐reactive protein | −1.85 (−3.51, −0.18) | 0.031 | ||||
| Non‐Hispanic blacks (n=929) | ||||||
| CVH | ||||||
| Poor | 1.74 (−3.15, 6.63) | 0.473 | 1.85 (−2.85, 6.55) | 0.428 | 2.29 (−2.44, 7.01) | 0.331 |
| Intermediate | 0.37 (−3.50, 4.25) | 0.845 | 0.40 (−3.38, 4.19) | 0.829 | 0.54 (−3.27, 4.34) | 0.775 |
| Ideal | Referent | Referent | Referent | |||
| P for trend | 0.419 | 0.37 | 0.273 | |||
| C‐reactive protein | −1.22 (−2.76, 0.33) | 0.119 | ||||
| Mexican Americans (n=414) | ||||||
| CVH | ||||||
| Poor | −0.45 (−5.27, 4.37) | 0.850 | −0.28 (−5.13, 4.56) | 0.906 | −0.01 (−4.83, 4.81) | 0.996 |
| Intermediate | 0.72 (−2.79, 4.23) | 0.677 | 0.81 (−2.67, 4.32) | 0.638 | 1.01 (−2.52, 4.53) | 0.564 |
| Ideal | Referent | Referent | Referent | |||
| P for trend | 0.79 | 0.845 | 0.93 | |||
| C‐reactive protein | −1.35 (−1.97, −0.73) | <0.001 | ||||
Model 1 was adjusted for demographic variables, including for age, sex (except sex‐specific estimates), race/ethnicity (except race/ethnicity‐specific estimates), and marital status, nativity; model 2 was further adjusted for SES (education and poverty income ratio); model 3 was further adjusted for C‐reactive protein. CVH indicates cardiovascular health; LTL, leukocyte telomere length; NHANES, National Health and Nutrition Examination Survey; SES, socioeconomic status.
T/S ratio, leukocyte telomere length relative to standard reference DNA.
Because the outcome variable was log‐transformed T/S ratio, the regression coefficients were retransformed and expressed as percentage difference. The estimates accounted for the complex survey design.
Further stratified analyses showed sex differences in the association between CVH and LTL (P for interaction=0.048). A strong and graded association between CVH and LTL was observed in women, but not in men (Table 5). Compared to those with ideal CVH, women with poor and intermediate CVH were significantly associated with shorter LTL (percent difference=−6.56% [95% CI=−10.23, −2.88], P=0.001 for poor CVH and −5.07% [95% CI=−7.42, −2.71], P<0.001 for intermediate CVH) in the fully adjusted model (P for trend=0.001). In addition, the association between CVH with LTL was suggestively different by race/ethnic groups (P for interaction=0.065). We observed a strong graded association between CVH and LTL in non‐Hispanic whites (P for trend=0.004). Compared to these with ideal CVH, non‐Hispanic whites with poor and intermediate CVH had significantly shorter LTL (percent difference=−4.26% [95% CI=−7.08, −1.44], P=0.004 for poor CVH and −2.94% [95% CI=[−5.33, −0.56], P=0.017 for intermediate CVH) in the fully adjusted model 3. In contrast, we found no significant association between CVH and LTL in non‐Hispanic blacks and Mexican Americans (Table 5).
Discussion
This is the first study to report a significant, inverse, graded association between LTL and CVH, as defined by the AHA, in a large, nationally representative sample of US adults. This association was independent of chronological age, sex, race/ethnicity, marital status, nativity, income, education, and C‐reactive protein. Moreover, the results showed sex and racial/ethnic differences in the association between CVH and LTL, with a strong graded association in women and non‐Hispanic whites, but there was no association in non‐Hispanic blacks or Mexican Americans. In a fully adjusted model, individuals with intermediate or poor CVH were significantly associated with 2.4% and 3.4% shorter LTL compared to those with ideal CVH in the overall sample, respectively. Given that our model‐based estimate of age‐associated rate of LTL shortening was 0.5% per year, these differences are roughly equivalent to 5 and 7 additional years of aging for participants with intermediate or poor CVH, respectively, compared to those with ideal CVH of the same chronological age in the overall sample. For women with intermediate or poor CVH, this translates into ≈10 and 13 additional years of aging compared to women with ideal CVH, respectively. Similarly, non‐Hispanic whites with intermediate or poor CVH had aged the equivalent of 6 and 9 additional years compared to those with ideal CVH, respectively. If no other factors invalidate these comparisons, these findings suggest that achieving the AHA's ideal CVH may slow down the shortening of LTL, particularly in women and non‐Hispanic whites. However, it is important to acknowledge that given the cross‐sectional nature of our findings and the complexity of LTL dynamics, the clinical interpretations of these findings remain to be explored. This is because LTL at birth is highly variable and a major determinant of LTL through an individual's life course.6, 31 Thus, it is difficult to disentangle whether the observed association between LTL and CVH is attributed to short LTL at birth or age‐dependent LTL shortening during adulthood or combination. Future longitudinal studies must therefore take these things into account perhaps using repeated measurements of LTL and CVH in a wider age range and diverse groups to confirm our findings and to draw more‐meaningful clinical evidence on the effects of change in CVH on the rate of change in LTL over time.
The mechanisms linking CVH to LTL are currently unclear. Poor CVH may affect LTL shortening through increase in the burden of inflammation and oxidative stress.30 Studies in cultured cells have shown that oxidative stress shortens telomeres.3 Chronic inflammation also contributes to LTL shortening by increasing turnover of leukocyte and the rate of HSC replication.31 Although not all studies,39 some studies have also revealed that shorter LTL is associated with higher levels of inflammatory markers, such as C‐reactive protein, tumor necrosis factor‐α, and interleukin‐6,40 and oxidative markers in vivo.15, 16, 21 In our study, we investigated whether C‐reactive protein (a general biomarker of inflammation) explains the association between CVH and LTL. The association between CVH and LTL attenuated, but it still remained significant following adjustment for C‐reactive protein. Thus, it is likely that other unaccounted inflammatory and oxidative stress processes may explain the association between CVH and LTL. Alternatively, poor CVH may also affect LTL shortening through atherosclerosis. Poor CVH has been strongly linked to the development of subclinical atherosclerosis,30 which may influence LTL shortening through the damage‐repair feedback loop between atherosclerosis and diminished HSCs reserve.41 It is also possible that early determinants, such as genetic factors and epigenetic mechanisms that regulate the LTL dynamics, may also drive some of the association between LTL and CVH. Future studies should continue to identify and elucidate the mechanisms that underlie the association between CVH and LTL.
Although previous studies have explored the relationships between LTL and individual CVD risk factors, the results have been inconsistent. Some studies have reported a significant association of shorter LTL with cigarette smoking, obesity, physical inactivity, poor diet, hypertension, and type 2 diabetes mellitus.12, 13, 14, 15, 16, 17 However, others have failed to replicate these findings.18, 19, 20, 21 For example, a study by Menke et al found no association between LTL and type 2 diabetes mellitus using the same NHANES data.19 The reasons for these inconsistencies are not completely understood, but it is likely that LTL shortening is the result of the overall impact of multiple CVD risk factors working in tandem than a single CVD risk factor. Therefore, the current study significantly contributes to the understanding of the relationship between LTL and CVD by reporting a strong graded association between LTL and CVH—a measure of cumulative burden of CVD, even after accounting for sociodemographic factors and inflammation marker. Furthermore, the current study also addresses the limited data available on the sex and race/ethnicity‐related variations in the relationship between CVH and LTL. Previous studies on LTL and CVD risk factors were predominantly in non‐Hispanic white populations. Studies on sex‐specific or non‐Hispanic blacks and Mexican Americans are limited. Our findings of sex and racial/ethnic differences in the association between CVH and LTL provide important justification for examining this relationship across subgroups.
We found a strong graded association between CVH and LTL in women, but not in men. Previous studies of sex‐specific associations between LTL and CVD risk factors have been equivocal. Similar to our study, 1 previous work reported an inverse association between LTL and obesity‐related measures in women, but not in men.42 Other studies have also reported an inverse association of LTL with smoking, obesity, poor dietary factors, and type 2 diabetes mellitus in women‐only samples.12, 43, 44 In contrast, 1 study reported associations of unhealthy lifestyle factors (smoking activity, alcohol consumption, physical activity, and diet) with shorter LTL in men, but not in women.21 The nature of this sex difference on the association between CVH and LTL is unclear. Research has suggested that sex differences in biological (eg, sex hormones, menopausal status), behavioral, and psychosocial factors might explain these differences.45, 46 However, future work should continue to investigate the role of sex as a possible modifier and the factors that contribute to the sex differences in CVH‐LTL association.
We also observed evidence of racial/ethnic differences in the association between CVH and LTL. Our results showed that non‐Hispanic blacks had significantly longer LTL compared to non‐Hispanic whites and Mexican Americans, consistent with previous findings.47 We also found a strong graded association between CVH and LTL in non‐Hispanic whites, but not among non‐Hispanic blacks and Mexican Americans despite their higher rates of poor CVH. Although limited data exist in non‐Hispanic blacks, our findings are consistent with 1 study that reported no association between LTL and obesity measures in a small sample of non‐Hispanic blacks.48 Three other studies also reported no association of LTL with coronary artery calcification and CHD in non‐Hispanic blacks, but significant associations in non‐Hispanic whites.49, 50, 51 To our knowledge, no data are available in Mexican Americans regarding LTL and CVD risk factors. It remains unclear why CVH is predictive of LTL in non‐Hispanic whites, but not in non‐Hispanic blacks and Mexican Americans. The lack of association in non‐Hispanic blacks and Mexican Americans in our study may be related to their younger age, difference in distribution of leukocyte subtypes, and higher interindividual variability of LTL, which may underestimate the association of CVH with LTL in these subgroups.
However, there might also be several possible explanations for the observed racial/ethnic differences in our study. One possibility is that non‐Hispanic blacks display lower leukocyte and neutrophil counts than non‐Hispanic whites; therefore, they may benefit from fewer replications of hematopoietic stem and progenitor cells,47 leading to a longer LTL, and, in turn, may play a protective role against the deleterious effect of poor CVH on LTL. A second possibility could be attributed to racial/ethnic differences in the prevalence of arteriosclerosis. Non‐Hispanic whites experience higher rates of atherosclerosis than non‐Hispanic blacks and Mexican Americans.52, 53 Moreover, LTL has been shown to be a stronger predictor of atherosclerosis in non‐Hispanic whites than in non‐Hispanic blacks.49, 50, 51 Therefore, the shorter LTL in non‐Hispanic whites with poor CVH might be indicative of the link between diminished HSC reserves and the burden of atherosclerosis.41 A third possibility is that the adverse effects of poor CVH on LTL in non‐Hispanic blacks and Mexican Americans might have been obscured by other important social and environmental factors. Both non‐Hispanic blacks and Mexican Americans are more likely than non‐Hispanic whites to experience increased chronic stress, discrimination, poverty, and adverse neighborhood conditions. These factors have been shown to affect LTL shortening in previous studies.54, 55, 56, 57 Alternatively, ancestry‐related genetic variations in LTL and/or gene‐environment interactions may also drive the observed racial/ethnic differences in the association. A recent study, for example, showed that European ancestry displays shorter LTL than Africans and African Americans attributed to polygenetic adaptation.58 A genome‐wide study also revealed an association between genetic variants related to shorter LTL and CHD in European descent.59 Future studies should continue to identify the underlying biological factors that may explain the observed racial/ethnic differences in LTL‐CVH association.
The AHA's 2020 Strategic Impact Goals was introduced to reduce the burden of CVD and stroke morbidity and mortality by achieving ideal CVH.24 Here, we have demonstrated that adults with less‐than‐ideal CVH are associated with shorter LTL compared to those with ideal CVH over and above sociodemographic factors and inflammation marker, suggesting that achieving AHA's ideal CVH may have an additional benefit of slowing down the rate of LTL shortening. Our findings therefore underscore the importance of public health promotion of ideal CVH aimed at preserving telomere length or decreasing the rate of LTL shortening. However, caution should be exercised in interpreting these findings that future longitudinal studies will be needed to confirm our findings and determine whether the association between LTL and CVH are causal. More research is also needed to understand the biological contributors to sex and racial/ethnic differences in the association of LTL and CVH. Furthermore, our findings appear to suggest that LTL may be one of the missing links between CVH and CVD outcomes, which requires further investigation whether LTL is a mediator in the association between CVH and CVD events above and beyond inflammation biomarkers. If confirmed, LTL could be a promising biomarker of an overall vascular health status in the general population and, in particular, for targeting patients at high risk of vascular alterations or damages.
Our results should be interpreted in the context of some limitations. The main limitation in our study is that CVH and LTL were associated at only 1 point in time. Therefore, the cross‐sectional nature of our study makes it difficult to determine whether poor CVH has caused shortening of LTL or short LTL at birth has contributed to poor CVH in adulthood. Hence, longitudinal studies should be conducted to determine whether change in CVH predicts change in the rate of LTL shortening. Second, we used mean LTL measured in leukocyte cells, which are a heterogeneous mix of cells with varying telomere length. It is possible the association may vary depending on cell type (eg, vascular cells) used to measure telomere length, although previous work has indicated that telomere length is highly correlated across different cells.60 Third, although we have adjusted for important potential confounders and mediators, residual confounding correlated with both CVH and LTL may still exist, including other chronic diseases (eg, cancer), menopausal status, sex‐hormones, medication use, and genetic, behavioral, psychosocial, and environmental factors. Additionally, physical activity and diet were evaluated based on self‐reported, so misclassification attributed to recall bias and measurement errors may underestimate some of the association. Finally, we did not relate individual components of the CVH to LTL because the main objective of the current study was to assess the composite effects of the AHA's CVH construct on LTL, but it is possible that the different components of CVH may affect LTL differently.
Despite these limitations, our study is unique in that we are the first to report the association between LTL and CVH as defined by the AHA. In addition, our study was conducted in a large, ethnically diverse, and representative sample of US adults, suggesting that our findings are generalizable. Moreover, our study significantly contributes to the limited and conflicting literature by providing evidence of sex and racial differences in the association between CVH and LTL. Additionally, we have also extended previous studies by examining potential mediation of the CVH‐LTL association by an inflammation biomarker, C‐reactive protein. Finally, the use of reliable and standardized measures of CVH and LTL were also an important strength of this study.
Conclusions
In this large and nationally representative sample, we found that adults with less‐than‐ideal CVH had significantly shorter LTL compared to those with ideal CVH, even after accounting for sociodemographic factors and inflammation marker. These findings suggest that achieving the AHA's ideal CVH may have an additional benefit of slowing down the shortening of LTL and subsequently delaying vascular aging. Moreover, we also found that the association between LTL‐CVH differs by sex and race/ethnicity, suggesting the importance of examining this association by subgroups to gain better insights into sex‐ and race‐related disparities in CVD morbidity and mortality. However, future longitudinal studies using repeated measures of LTL and CVH are required to better understand how change in CVH affects the rate of change in LTL shortening. If proven true, LTL could potentially serve as a screening biomarker for targeting patients at high risk of vascular alterations or damages.
Sources of Funding
This research is supported by the Intramural Research Program of the National Human Genome Research Institute, National Institutes of Health.
Author Contributions
Gebreab conceptualized the study. Gebreab and Manna conducted the statistical analysis. Gebreab prepared the draft manuscript. Khan, Riestra, Xu, and Davis contributed to the study design, interpretation of data, and the preparation of the manuscript. All authors read and approved the final manuscript. Davis supervised the study, provided funding and administrative, technical, and material support.
Disclosures
None.
Acknowledgments
The findings and conclusions expressed in this article are those of the authors and do not necessarily represent the views of the National Institutes of Health (NIH) or the Department of Health and Human Services (DHHS).
(J Am Heart Assoc. 2017;6:e004105. DOI: 10.1161/JAHA.116.004105.)
References
- 1. Blackburn EH. Switching and signaling at the telomere. Cell. 2001;106:661–673. [DOI] [PubMed] [Google Scholar]
- 2. Harley CB. Telomere loss: mitotic clock or genetic time bomb? Mutat Res. 1991;256:271–282. [DOI] [PubMed] [Google Scholar]
- 3. Zglinicki T. Oxidative stress shortens telomeres. Trends Biochem Sci. 2002;27:339–344. [DOI] [PubMed] [Google Scholar]
- 4. Fyhrquist F, Saijonmaa O, Strandberg T. The roles of senescence and telomere shortening in cardiovascular disease. Nat Rev Cardiol. 2013;10:274–283. [DOI] [PubMed] [Google Scholar]
- 5. Aviv A. Genetics of leukocyte telomere length and its role in atherosclerosis. Mutat Res. 2012;730:68–74. [DOI] [PMC free article] [PubMed] [Google Scholar]
- 6. Okuda K, Bardeguez A, Gardner JP, Rodriguez P, Ganesh V, Kimura M, Skurnick J, Awad G, Aviv A. Telomere length in the newborn. Pediatr Res. 2002;52:377–381. [DOI] [PubMed] [Google Scholar]
- 7. Nilsson PM, Tufvesson H, Leosdottir M, Melander O. Telomeres and cardiovascular disease risk: an update 2013. Transl Res. 2013;162:371–380. [DOI] [PubMed] [Google Scholar]
- 8. Kroenke CH, Pletcher MJ, Lin J, Blackburn E, Adler N, Matthews K, Epel E. Telomerase, telomere length, and coronary artery calcium in black and white men in the CARDIA study. Atherosclerosis. 2012;220:506–512. [DOI] [PubMed] [Google Scholar]
- 9. Haycock PC, Heydon EE, Kaptoge S, Butterworth AS, Thompson A, Willeit P. Leucocyte telomere length and risk of cardiovascular disease: systematic review and meta‐analysis. BMJ. 2014;349:g4227. [DOI] [PMC free article] [PubMed] [Google Scholar]
- 10. Willeit P, Willeit J, Brandstatter A, Ehrlenbach S, Mayr A, Gasperi A, Weger S, Oberhollenzer F, Reindl M, Kronenberg F, Kiechl S. Cellular aging reflected by leukocyte telomere length predicts advanced atherosclerosis and cardiovascular disease risk. Arterioscler Thromb Vasc Biol. 2010;30:1649–1656. [DOI] [PubMed] [Google Scholar]
- 11. D'Mello MJJ, Ross SA, Briel M, Anand SS, Gerstein H, Paré G. The association between shortened leukocyte telomere length and cardio‐metabolic outcomes: a systematic review and meta‐analysis. Circ Cardiovasc Genet. 2015;8:82–90. [DOI] [PubMed] [Google Scholar]
- 12. Valdes AM, Andrew T, Gardner JP, Kimura M, Oelsner E, Cherkas LF, Aviv A, Spector TD. Obesity, cigarette smoking, and telomere length in women. Lancet. 2005;366:662–664. [DOI] [PubMed] [Google Scholar]
- 13. Cherkas LF, Hunkin JL, Kato BS, Richards JB, Gardner JP, Surdulescu GL, Kimura M, Lu X, Spector TD, Aviv A. The association between physical activity in leisure time and leukocyte telomere length. Arch Intern Med. 2008;168:154–158. [DOI] [PubMed] [Google Scholar]
- 14. Nettleton JA, Diez‐Roux A, Jenny NS, Fitzpatrick AL, Jacobs DR Jr. Dietary patterns, food groups, and telomere length in the Multi‐Ethnic Study of Atherosclerosis (MESA). Am J Clin Nutr. 2008;88:1405–1412. [DOI] [PMC free article] [PubMed] [Google Scholar]
- 15. Demissie S, Levy D, Benjamin EJ, Cupples LA, Gardner JP, Herbert A, Kimura M, Larson MG, Meigs JB, Keaney JF, Aviv A. Insulin resistance, oxidative stress, hypertension, and leukocyte telomere length in men from the Framingham Heart Study. Aging Cell. 2006;5:325–330. [DOI] [PubMed] [Google Scholar]
- 16. Salpea KD, Talmud PJ, Cooper JA, Maubaret CG, Stephens JW, Abelak K. Association of telomere length with type 2 diabetes, oxidative stress and UCP2 gene variation. Atherosclerosis. 2010;209:42–50. [DOI] [PMC free article] [PubMed] [Google Scholar]
- 17. Zee RY, Castonguay AJ, Barton NS, Germer S, Martin M. Mean leukocyte telomere length shortening and type 2 diabetes mellitus: a case–control study. Transl Res. 2010;155:166–169. [DOI] [PubMed] [Google Scholar]
- 18. Neuner B, Lenfers A, Kelsch R, Jäger K, Brüggmann N, van der Harst P, Walter M. Telomere length is not related to established cardiovascular risk factors but does correlate with red and white blood cell counts in a German blood donor population. PLoS One. 2015;10:e0139308. [DOI] [PMC free article] [PubMed] [Google Scholar]
- 19. Menke A, Casagrande S, Cowie CC. Leukocyte telomere length and diabetes status, duration, and control: the 1999–2002 National Health and Nutrition Examination Survey. BMC Endocr Disord. 2015;15:015–0050. [DOI] [PMC free article] [PubMed] [Google Scholar]
- 20. Fitzpatrick AL, Kronmal RA, Gardner JP, Psaty BM, Jenny NS, Tracy RP, Walston J, Kimura M, Aviv A. Leukocyte telomere length and cardiovascular disease in the Cardiovascular Health Study. Am J Epidemiol. 2007;165:14–21. [DOI] [PubMed] [Google Scholar]
- 21. Bekaert S, De Meyer T, Rietzschel ER, De Buyzere ML, De Bacquer D, Langlois M, Segers P, Cooman L, Van Damme P, Cassiman P, Van Criekinge W, Verdonck P, De Backer GG, Gillebert TC, Van Oostveldt P; Asklepios investigators . Telomere length and cardiovascular risk factors in a middle‐aged population free of overt cardiovascular disease. Aging Cell. 2007;6:639–647. [DOI] [PubMed] [Google Scholar]
- 22. Aviv A, Valdes AM, Spector TD. Human telomere biology: pitfalls of moving from the laboratory to epidemiology. Int J Epidemiol. 2006;35:1424–1429. [DOI] [PubMed] [Google Scholar]
- 23. Sanders JL, Fitzpatrick AL, Boudreau RM, Arnold AM, Aviv A, Kimura M, Fried LF, Harris TB, Newman AB. Leukocyte telomere length is associated with noninvasively measured age‐related disease: the Cardiovascular Health Study. J Gerontol A Biol Sci Med Sci. 2012;67:409–416. [DOI] [PMC free article] [PubMed] [Google Scholar]
- 24. Lloyd‐Jones DM, Hong Y, Labarthe D, Mozaffarian D, Appel LJ, Van Horn L, Greenlund K, Daniels S, Nichol G, Tomaselli GF, Arnett DK, Fonarow GC, Ho PM, Lauer MS, Masoudi FA, Robertson RM, Roger V, Schwamm LH, Sorlie P, Yancy CW, Rosamond WD; American Heart Association Strategic Planning Task Force and Statistics Committee . Defining and setting national goals for cardiovascular health promotion and disease reduction: the American Heart Association's Strategic Impact Goal through 2020 and beyond. Circulation. 2010;121:586–613. [DOI] [PubMed] [Google Scholar]
- 25. Folsom AR, Yatsuya H, Nettleton JA, Lutsey PL, Cushman M, Rosamond WD. Community prevalence of ideal cardiovascular health, by the American Heart Association definition, and relationship with cardiovascular disease incidence. J Am Coll Cardiol. 2011;57:1690–1696. [DOI] [PMC free article] [PubMed] [Google Scholar]
- 26. Yang Q, Cogswell ME, Flanders W, Hong Y, Zhang Z, Loustalot F, Gillespie C, Merritt R, Hu FB. Trends in cardiovascular health metrics and associations with all‐cause and CVD mortality among US adults. JAMA. 2012;307:1273–1283. [DOI] [PMC free article] [PubMed] [Google Scholar]
- 27. Shay CM, Gooding HS, Murillo R, Foraker R. Understanding and improving cardiovascular health: an update on the American Heart Association's Concept of Cardiovascular Health. Prog Cardiovasc Dis. 2015;58:41–49. [DOI] [PubMed] [Google Scholar]
- 28. Kulshreshtha A, Goyal A, Veledar E, McClellan W, Judd S, Eufinger SC, Bremner DJ, Goldberg J, Vaccarino V. Association between ideal cardiovascular health and carotid intima‐media thickness: a twin study. J Am Heart Assoc. 2014;3:e000282 DOI: 10.1161/JAHA.113.000282. [DOI] [PMC free article] [PubMed] [Google Scholar]
- 29. Aatola H, Hutri‐Kähönen N, Juonala M, Laitinen TT, Pahkala K, Mikkilä V, Telama R, Koivistoinen T, Lehtimäki T, Viikari JS, Raitakari OT, Kähönen M. Prospective relationship of change in ideal cardiovascular health status and arterial stiffness: the Cardiovascular Risk in Young Finns Study. J Am Heart Assoc. 2014;3:e000532 DOI: 10.1161/JAHA.113.000532. [DOI] [PMC free article] [PubMed] [Google Scholar]
- 30. Xanthakis V, Enserro DM, Murabito JM, Polak JF, Wollert KC, Januzzi JL, Wang TJ, Tofler G, Vasan RS. Ideal cardiovascular health: associations with biomarkers and subclinical disease, and impact on incidence of cardiovascular disease in the Framingham Offspring Study. Circulation. 2014;130:1676–1683. [DOI] [PubMed] [Google Scholar]
- 31. Aviv A, Kark JD, Susser E. Telomeres, atherosclerosis, and human longevity: a causal hypothesis. Epidemiology. 2015;26:295–299. [DOI] [PMC free article] [PubMed] [Google Scholar]
- 32. Needham BL, Adler N, Gregorich S, Rehkopf D, Lin J, Blackburn EH, Epel ES. Socioeconomic status, health behavior, and leukocyte telomere length in the National Health and Nutrition Examination Survey, 1999–2002. Soc Sci Med. 2013;85:1–8. [DOI] [PMC free article] [PubMed] [Google Scholar]
- 33. Cawthon RM. Telomere measurement by quantitative PCR. Nucleic Acids Res. 2002;30:e47. [DOI] [PMC free article] [PubMed] [Google Scholar]
- 34. Huffman MD, Capewell S, Ning H, Shay CM, Ford ES, Lloyd‐Jones DM. Cardiovascular health behavior and health factor changes (1988–2008) and projections to 2020: results from the National Health and Nutrition Examination Surveys. Circulation. 2012;125:2595–2602. [DOI] [PMC free article] [PubMed] [Google Scholar]
- 35. Guenther PM, Reedy J, Krebs‐Smith SM. Development of the healthy eating index‐2005. J Am Diet Assoc. 2008;108:1896–1901. [DOI] [PubMed] [Google Scholar]
- 36. Ford ES, Greenlund KJ, Hong Y. Ideal cardiovascular health and mortality from all causes and diseases of the circulatory system among adults in the United States. Circulation. 2012;125:987–995. [DOI] [PMC free article] [PubMed] [Google Scholar]
- 37. Wong MD, Shapiro MF, Boscardin WJ, Ettner SL. Contribution of major diseases to disparities in mortality. N Engl J Med. 2002;347:1585–1592. [DOI] [PubMed] [Google Scholar]
- 38. Zota AR, Needham BL, Blackburn EH, Lin J, Park SK, Rehkopf DH, Epel ES. Associations of cadmium and lead exposure with leukocyte telomere length: findings from National Health and Nutrition Examination Survey, 1999–2002. Am J Epidemiol. 2014;181:127–136. [DOI] [PMC free article] [PubMed] [Google Scholar]
- 39. Sanders JL, Newman AB. Telomere length in epidemiology: a biomarker of aging, age‐related disease, both, or neither? Epidemiol Rev. 2013;35:112–131. [DOI] [PMC free article] [PubMed] [Google Scholar]
- 40. O'Donovan A, Pantell MS, Puterman E, Dhabhar FS, Blackburn EH, Yaffe K, Cawthon RM, Opresko PL, Hsueh WC, Satterfield S, Newman AB, Ayonayon HN, Rubin SM, Harris TB, Epel ES; Health Aging and Body Composition Study . Cumulative inflammatory load is associated with short leukocyte telomere length in the Health, Aging and Body Composition Study. PLoS One. 2011;6:e19687. [DOI] [PMC free article] [PubMed] [Google Scholar]
- 41. Aviv A, Levy D. Telomeres, atherosclerosis, and the hemothelium: the longer view. Annu Rev Med. 2012;63:293–301. [DOI] [PMC free article] [PubMed] [Google Scholar]
- 42. Nordfjall K, Eliasson M, Stegmayr B, Melander O, Nilsson P, Roos G. Telomere length is associated with obesity parameters but with a gender difference. Obesity (Silver Spring). 2008;16:2682–2689. [DOI] [PubMed] [Google Scholar]
- 43. Cassidy A, De Vivo I, Liu Y, Han J, Prescott J, Hunter DJ, Rimm EB. Associations between diet, lifestyle factors, and telomere length in women. Am J Clin Nutr. 2010;91:1273–1280. [DOI] [PMC free article] [PubMed] [Google Scholar]
- 44. You NC, Chen BH, Song Y, Lu X, Chen Y, Manson JE. A prospective study of leukocyte telomere length and risk of type 2 diabetes in postmenopausal women. Diabetes. 2012;61:2998–3004. [DOI] [PMC free article] [PubMed] [Google Scholar]
- 45. Aviv A, Shay J, Christensen K, Wright W. The longevity gender gap: are telomeres the explanation? Sci Aging Knowledge Environ. 2005;23:pe16. [DOI] [PubMed] [Google Scholar]
- 46. Barrett EL, Richardson DS. Sex differences in telomeres and lifespan. Aging Cell. 2011;10:913–921. [DOI] [PubMed] [Google Scholar]
- 47. Hunt SC, Chen W, Gardner JP, Kimura M, Srinivasan SR, Eckfeldt JH, Berenson GS, Aviv A. Leukocyte telomeres are longer in African Americans than in whites: the National Heart, Lung, and Blood Institute Family Heart Study and the Bogalusa Heart Study. Aging Cell. 2008;7:451–458. [DOI] [PMC free article] [PubMed] [Google Scholar]
- 48. Diaz VA, Mainous AG, Player MS, Everett CJ. Telomere length and adiposity in a racially diverse sample. Int J Obes. 2009;34:261–265. [DOI] [PubMed] [Google Scholar]
- 49. Mainous AG III, Codd V, Diaz VA, Schoepf UJ, Everett CJ, Player MS, Samani NJ. Leukocyte telomere length and coronary artery calcification. Atherosclerosis. 2010;210:262–267. [DOI] [PubMed] [Google Scholar]
- 50. Hunt SC, Kimura M, Hopkins PN, Carr JJ, Heiss G, Province MA, Aviv A. Leukocyte telomere length and coronary artery calcium. Am J Cardiol. 2015;116:214–218. [DOI] [PMC free article] [PubMed] [Google Scholar]
- 51. Carty CL, Kooperberg C, Liu J, Herndon M, Assimes T, Hou L, Kroenke CH, LaCroix AZ, Kimura M, Aviv A, Reiner AP. Leukocyte telomere length and risks of incident coronary heart disease and mortality in a racially diverse population of postmenopausal women. Arterioscler Thromb Vasc Biol. 2015;35:2225–2231. [DOI] [PMC free article] [PubMed] [Google Scholar]
- 52. Wassel CL, Pankow JS, Peralta CA, Choudhry S, Seldin MF, Arnett DK. Genetic ancestry is associated with subclinical cardiovascular disease in African Americans and Hispanics from the Multi‐Ethnic Study of Atherosclerosis (MESA). Circ Cardiovasc Genet. 2009;2:629–636. [DOI] [PMC free article] [PubMed] [Google Scholar]
- 53. Gebreab SY, Riestra P, Khan RJ, Xu R, Musani SK, Tekola‐Ayele F, Correa A, Wilson JG, Rotimi CN, Davis SK. Genetic ancestry is associated with measures of subclinical atherosclerosis in African Americans: the Jackson Heart Study. Arterioscler Thromb Vasc Biol. 2015;35:1271–1278. [DOI] [PMC free article] [PubMed] [Google Scholar]
- 54. Epel ES, Blackburn EH, Lin J, Dhabhar FS, Adler NE, Morrow JD, Cawthon RM. Accelerated telomere shortening in response to life stress. Proc Natl Acad Sci USA. 2004;101:17312–17315. [DOI] [PMC free article] [PubMed] [Google Scholar]
- 55. Chae DH, Nuru‐Jeter AM, Adler NE, Brody GH, Lin J, Blackburn EH, Epel ES. Discrimination, racial bias, and telomere length in African‐American men. Am J Prev Med. 2014;46:103–111. [DOI] [PMC free article] [PubMed] [Google Scholar]
- 56. Geronimus AT, Pearson JA, Linnenbringer E, Schulz AJ, Reyes AG, Epel ES, Lin J, Blackburn EH. Race‐ethnicity, poverty, urban stressors, and telomere length in a detroit community‐based sample. J Health Soc Behav. 2015;56:199–224. [DOI] [PMC free article] [PubMed] [Google Scholar]
- 57. Diez Roux AV, Ranjit N, Jenny NS, Shea S, Cushman M, Fitzpatrick A, Seeman T. Race/ethnicity and telomere length in the Multi‐Ethnic Study of Atherosclerosis. Aging Cell. 2009;8:251–257. [DOI] [PMC free article] [PubMed] [Google Scholar]
- 58. Hansen MEB, Hunt SC, Stone RC, Horvath K, Herbig U, Ranciaro A, Hirbo J, Beggs W, Reiner AP, Wilson JG, Kimura M, De Vivo I, Chen MM, Kark JD, Levy D, Nyambo T, Tishkoff SA, Aviv A. Shorter telomere length in Europeans than in Africans due to polygenetic adaptation. Hum Mol Genet. 2016;25:2324–2330. [DOI] [PMC free article] [PubMed] [Google Scholar]
- 59. Codd V, Nelson CP, Albrecht E, Mangino M, Deelen J, Buxton JL, Hottenga JJ, Fischer K, Esko T, Surakka I, Broer L, Nyholt DR, Mateo Leach I, Salo P, Hägg S, Matthews MK, Palmen J, Norata GD, O'Reilly PF, Saleheen D, Amin N, Balmforth AJ, Beekman M, de Boer RA, Böhringer S, Braund PS, Burton PR, de Craen AJ, Denniff M, Dong Y, Douroudis K, Dubinina E, Eriksson JG, Garlaschelli K, Guo D, Hartikainen AL, Henders AK, Houwing‐Duistermaat JJ, Kananen L, Karssen LC, Kettunen J, Klopp N, Lagou V, van Leeuwen EM, Madden PA, Mägi R, Magnusson PK, Männistö S, McCarthy MI, Medland SE, Mihailov E, Montgomery GW, Oostra BA, Palotie A, Peters A, Pollard H, Pouta A, Prokopenko I, Ripatti S, Salomaa V, Suchiman HE, Valdes AM, Verweij N, Viñuela A, Wang X, Wichmann HE, Widen E, Willemsen G, Wright MJ, Xia K, Xiao X, van Veldhuisen DJ, Catapano AL, Tobin MD, Hall AS, Blakemore AI, van Gilst WH, Zhu H; CARDIoGRAM consortium , Erdmann J, Reilly MP, Kathiresan S, Schunkert H, Talmud PJ, Pedersen NL, Perola M, Ouwehand W, Kaprio J, Martin NG, van Duijn CM, Hovatta I, Gieger C, Metspalu A, Boomsma DI, Jarvelin MR, Slagboom PE, Thompson JR, Spector TD, van der Harst P, Samani NJ. Identification of seven loci affecting mean telomere length and their association with disease. Nat Genet. 2013;45:422–427, 427.e1‐2. doi: 10.1038/ng.2528. [DOI] [PMC free article] [PubMed] [Google Scholar]
- 60. Daniali L, Benetos A, Susser E, Kark JD, Labat C, Kimura M, Desai K, Granick M, Aviv A. Telomeres shorten at equivalent rates in somatic tissues of adults. Nat Commun. 2013;4:1597 DOI: 10.1038/ncomms2602. [DOI] [PMC free article] [PubMed] [Google Scholar]