Abstract
Object
MR imaging of low-gamma nuclei at the ultrahigh magnetic field of 21.1 T provides a new opportunity for understanding a variety of biological processes. Among these, chlorine and sodium are attracting attention for their involvement in brain function and cancer development.
Materials and methods
MRI of 35Cl and 23Na were performed and relaxation times were measured in vivo in normal rat (n = 3) and in rat with glioma (n = 3) at 21.1 T. The concentrations of both nuclei were evaluated using the center-out back-projection method.
Results
T1 relaxation curve of chlorine in normal rat head was fitted by bi-exponential function (T1a = 4.8 ms (0.7) T1b = 24.4 ± 7 ms (0.3) and compared with sodium (T1 = 41.4 ms). Free induction decays (FID) of chlorine and sodium in vivo were bi-exponential with similar rapidly decaying components of ms and ms, respectively. Effects of small acquisition matrix and bi-exponential FIDs were assessed for quantification of chlorine (33.2 mM) and sodium (44.4 mM) in rat brain.
Conclusion
The study modeled a dramatic effect of the bi-exponential decay on MRI results. The revealed increased chlorine concentration in glioma (~1.5 times) relative to a normal brain correlates with the hypothesis asserting the importance of chlorine for tumor progression.
Keywords: Chlorine, Sodium, MR imaging, Ultrahigh magnetic field, Rat, In vivo, Glioma, Bi-exponential, Fid
Introduction
Ultrahigh magnetic fields expand our capability to perform MR imaging beyond commonly used proton imaging. The applications of sodium MRI have been demonstrated by many research groups in humans and animal models [1–6]. The potential of low sensitivity and low–gyro-magnetic ratio nuclei, such as chlorine, for MRI remain largely unexplored, especially for in vivo applications. Chlorine MRI is more challenging than sodium. The main difficulty for imaging of such nuclei is the low intensity of their MR signals. Nevertheless, there are efforts underway to perform imaging of chlorine as well [7].
Both sodium and chlorine nuclei have important advantages in that they are inherent in living systems and actively involved in cell functioning. Since they are intrinsic, each can provide a unique window on the biological processes taking place during normal in vivo function occurring in interventions and diseases. Their concentration, however, is around 45 mM depending on the location. Sodium MR signal in vivo, being the most intensive after proton, is reduced relative to water (95,000 mM) almost 2,111 times due to low sodium concentration (Table 1). A further reduction in MR signal intensity is expected for chlorine MRI. The most abundant chlorine-35 nuclei with abundance of 75.8 % has ~20.3 times less intensive MR signal than sodium.
Table 1.
In vivo MR signal sensitivity relationship at 21.1 T
| Nuclei | γ | Frequency (F, MHz) | Abundance (A, %) | Spin (S) | Concentration (C, mM) | MR sensitivity |
|---|---|---|---|---|---|---|
| Proton-1 | 26.8 | 900 | 99.9 | 1/2 | 95,000 | 6,026 |
| Sodium-23 | 7.08 | 238 | 100 | 3/2 | 45 | 1 |
| Chlorine-35 | 2.62 | 88.2 | 75.5 | 3/2 | 45a | 1/20.3 |
| Chlorine-37 | 2.18 | 73.4 | 24.2 | 3/2 | 45a | 1/105 |
MR sensitivity relative to sodium is ~ γACS(S + 1)(F)7/4 for low-gamma nuclei and ~γACS(S + 1)F for proton
γ magnetogyric ratio, 10^7 radian/(s * T)
Expected concentration, mM
It is remarkable that the gain in sensitivity at ultrahigh magnetic fields is especially favorable for low-gamma nuclei. This gain is very close to a theoretical prediction of the 7/4 power of the gain in the magnetic field [8]. This favorable field dependence has been found to hold at high fields up to 21.1 T [9, 10]. Thus, the ultrahigh magnetic fields are effective tools to improve MR sensitivity.
Following the problem of sensitivity, the challenge for chlorine and sodium MRI is the presence of quadrupolar interactions of these nuclei (both of them have spin 3/2) with a variety of electric fields in vivo, especially during ion binding. MRI, in such cases, requires ultrashort time delays after RF pulses for detection of the full free induction decay (FID) of MR signals without losses. Additionally, bi-exponential decay of FIDs and partial volume effects [11–13] are expected for sodium and chlorine, which need to be considered for quantification of MRI data.
The current study was prompted by an assessment of the capability of low-gamma MRI at the ultrahigh magnetic field of 21.1 T, and the expectation that changes in the chlorine signal can be a precursor of tumor cell progression, apoptosis and variations in cellular energetic [14–20]. The main goal was to evaluate the feasibility of chlorine MRI in normal rat brain and in rat with glioma, and, if possible, quantify the results and compare them with sodium MRI. The current study utilizes volume RF coils of similar design for chlorine and sodium to facilitate the comparison of MR signal intensities.
Materials and methods
The experiments were conducted using the NHMFL 21.1 T magnet [10, 21] with Bruker Avance III console (PV5.1 software) and a custom gradient coil with an inner diameter of 64 mm (Resonance Research Inc., Billerica, MA). At 21.1 T, the magnetic resonance frequencies for chlorine and sodium are 88.15 and 237.5 MHz, respectively. Careful shielding of the RF probe and gradient coils was essential for chlorine, as our resonance frequency for chlorine was very close to the Tallahassee public radio station at 88.1 MHz.
The test samples were designed to have an RF load comparable to the in vivo rat head and were used for calibration of the MR signals. The samples were located in the same place inside the RF coil as a rat brain. Each sample consisted of 50-ml vial which had inside a machined plastic shape. The plastic cylinder decreased the amount of saline solution in the vial and provided profiles to assess MR image quality. The cylinder (D × L = 25 × 92 mm) had a central hole of 15 mm in diameter. Four longitudinal square grooves 4 × 4 mm were cut into the outside of the cylinder. With the plastic shape in place, 31.3 ml of 0.9 % NaCl solution (154 mM) was used to fill the remaining empty space inside the vial. The two samples used in this study had matching MRI signals. In vivo MR imaging was performed using Fisher 344 rats (n = 3, weight ~150 g). Tumor implantation (9L glioma, n = 3) was accomplished using a procedure described previously [4]. All animal experiments were conducted according to the protocols approved by The Florida State University ACUC.
The measurement of relaxation time T1 was performed using an inversion recovery (180° – τ-90°) pulse sequence with a repetition time of 400 ms. Transmitter output power of 300 W created a 90° pulse for sodium with a duration of 130 μs. The same transmitter for chlorine, using a quadrature RF coil, provided a 90° pulse of 140 μs. Each FID was acquired with 4,096 complex points and a spectral width (SW) of 10 kHz. The hardware delay for the FID acquisition was 50 μs. The pulse sequence had a list of 42 values of τ delays covering the range 0.001–0.5 s. The number of accumulations for T1 measurements was 16 for sodium and 64 for chlorine. The temperature inside the RF probe during MR measurements was maintained by water circulating through the gradient coil at 28 °C.
The 3D back-projection MRI pulse sequence was a modified version of the ultrashort echo time 2D pulse sequence provided with Bruker ParaVision 5.0. The center-out readout direction was rotated in plane using nv steps of 360°/nv increments, and each plane was rotated using nv1 steps of 180°/nv1 increments. Chlorine scans had field of view of 64 mm and SW = 3 kHz. Each FID was acquired with np = 40 complex points in the readout direction, and the image acquisition had nv = 84 projections in each plane and nv1 = 42 different planes. The number of accumulation (NA) was 128. During back-projection processing in Matlab, the number of points in the readout direction was set to np = 32, to give an estimated resolution for chlorine of 1 mm in all three dimensions. Sodium 3D MRI scans had field of view of 48 mm. The acquisition matrix for sodium was np × nv × nv1 = 64 × 336 × 168, spectral width 22.3 kHz, two accumulations and estimated resolution ~0.375 mm. Repetition time was 100 ms for sodium and 20 ms for chlorine which determined a scan time for sodium of 180 and 150 min for chlorine. The FID acquisition delay (TE) was 0.1 ms for both chlorine and sodium MRI, thus permitting virtually detection of all MR signals with minimum loss.
The signal-to-noise ratio was determined from the first (absolute maximum) point of FID relative to the standard deviation (STD) of the noise using the formula SNR = FID(1)/STD. The area for noise calculation was selected to be the last 1/8 of the number of points used to measure FID. Base line offset was corrected. The possible very small presence of the MR signal in this area was subtracted using a linear fit of such signal in this area. The results of measurements below are presented as mean ± STD.
RF coil for chlorine MRI
For improved sensitivity, a quadrature birdcage coil has been designed and constructed for 35Cl in vivo MRI. The low-pass birdcage coil has 8 rungs with an inner diameter of 33 mm and length of 54 mm (Fig. 1). The coil is surrounded by a 53-mm-diameter Faraday shield. Figure 2 illustrates the electrical circuit for the birdcage coil. Independent tuning and matching trimmer capacitors were implemented for in-phase and quadrature ports. The chlorine coil was designed for use with a vertical in vivo probe frame developed at the NHMFL [22] which provides support for gas anesthesia and respiratory monitoring. The tuning and matching capacitors can be adjusted from the base of the probe. Isolation between the ports was about 6 dB. The −3 dB quality factor for each port of the coil was 71 when empty and 51 when loaded by the test sample. A hybrid coupler was constructed for use with the birdcage coil (Fig. 2). It is based on a single-box branch line coupler design but with lumped element pi-networks used to realize the transmission lines.
Fig. 1.
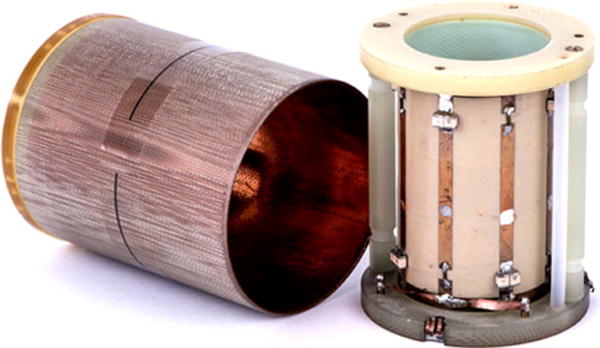
Birdcage RF coil for 35Cl in vivo MRI
Fig. 2.
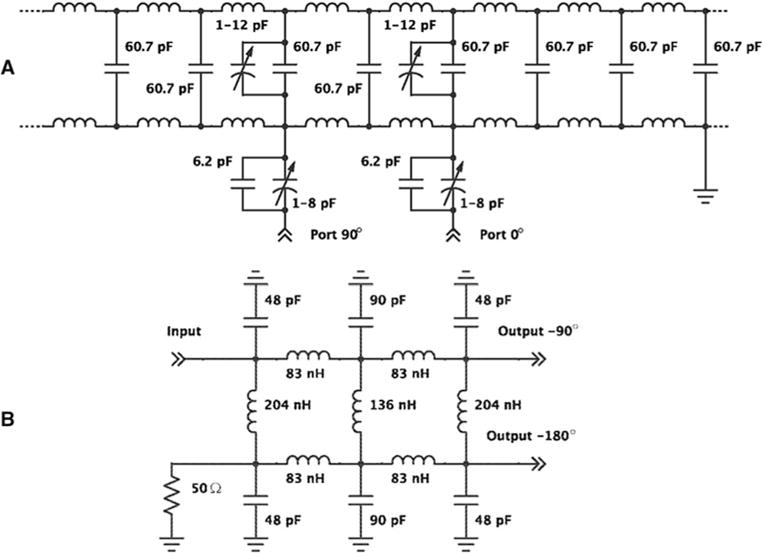
Electric circuit for the chlorine RF coil (a) and a hybrid coupler (b) based on a single-box branch line design but with lumped element pi-networks used to realize the transmission lines
The coil in quadrature mode with the hybrid coupler needed 3 dB less power from transmitter. In quadrature mode, there was an increase in signal of 1.3 ± 0.06 relative to a coil with single-mode detection. However, the gain in S/N from the quadrature coil was just 1.18 ± 0.1 as there was an increase in total noise of 1.1 ± 0.01.
Both chlorine and sodium volume coils were of the same size (Fig. 1) and utilized the low-pass birdcage circuit. The signals for chlorine were decreased by a factor of quadrature coil gain (1.18) to get the values comparable to chlorine single tuned coil.
The sodium coil was double tuned for hydrogen by using a sliding ring over the coil [22]. The −3 dB quality factor for the sodium coil loaded by the same test sample was 71, and for the empty coil, it was 114. The isolation between sodium and proton channels was at least 20 dB. The double tuning capability reduced the sensitivity of the sodium coil by 10 % compared to a single tuned sodium coil of otherwise identical design built in our laboratory. This difference was taken into consideration during calculations of sodium signal and S/N ratio. Thus, all sodium signal evaluations below were presented relative to a single tuned sodium coil.
Results
Comparison of chlorine and sodium MR signals from in vivo rat head and saline
For MRI of quickly decaying signals, it is very important to know the shape of the FID, as it may dramatically affect the results of quantification of the corresponding images. Both sodium and chlorine in vivo FID signals from the rat head demonstrate the presence of such components in their FIDs. The FID signals were fitted by bi-exponential functions and the results are presented together with the corresponding signals from saline in our test samples (Fig. 3). The chlorine FID (n = 3) has ms with amplitude A = 41 ± 2 % and ms, B = 59 ± 3 % (R2 ≥ 0.9983). For the sodium FID (n = 3), the corresponding values were ms, A = 83 ± 0.5 %, ms, B = 17 ± 0.3 % (R2 ≥ 0.9989).
Fig. 3.
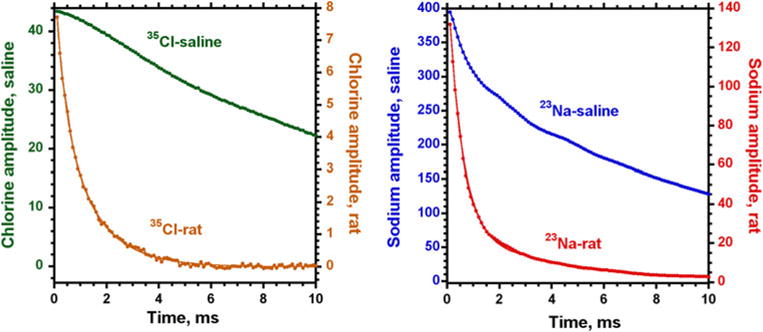
In vivo chlorine and sodium FID signals after shimming from whole rat head and the corresponding signals from saline solution, NA = 256. Signal-to-noise ratio for chlorine in rat was 89.6 ± 6, and in the test saline sample 519 ± 10, the corresponding S/N values for sodium were in rat 2504 ± 78, and in test sample 8,365 ± 62. Both FID signals in vivo were fitted by two exponential functions: for chlorine ms, A = 41 ± 2 % and ms, B = 59 ± 3 % (R2 = 0.9983); for sodium ms, A = 83 ± 0.5 %, ms, B = 17 ± 0.3 % (R2 = 0.9989)
S/N for chlorine in whole rat head was 89.6 ± 6 (n = 3) and in the test saline sample 519 ± 10 (n = 3) for NA = 256. The corresponding values of S/N for sodium were in rat 2,504 ± 78 (n = 3) and in test sample 8,365 ± 62 (n = 3) also using NA = 256.
Effect of limited k-space sampling and bi-exponential FID on chlorine and sodium MRI
3D MRI image intensity modeling was performed for sodium and chlorine signals to determine the true concentration from MR signal intensity (Fig. 4). The measured values for chlorine and sodium MR signals from the rat head (Fig. 3) were used to estimate the effect of bi-exponential FID on the intensity of the corresponding MR images. The related FIDs from saline (Fig. 3) were used to represent signals from the corresponding reference samples. The bi-exponential decays from Fig. 3 were applied along each readout direction in k-space. The partial volume effect was modeled by changing diameter of the spherical object from 1 pixel to 56, where the dimension of the field of view was 64 pixels in all three directions. The results were re-gridded in k-space in Matlab before the final Fourier processing. The average MR intensity in the object is shown relative to the reference having a spherical-size filling almost all field of view and covered by 56 × 56 × 56 voxels. Spectral width for chlorine detection is usually selected less for sodium; in the model, it was selected as 29.7 kHz for sodium and 3 kHz for chlorine. This difference in spectral width increases the readout time for chlorine up to 10.6 ms. At this condition, the effect of chlorine FID decay is already noticeable even for saline solution (Fig. 4). The effect of bi-exponential decay in chlorine FID is especially dramatic for chlorine quantification. Bi-exponential decay, long readout time and small size of the k-space matrix during acquisition may be the reasons for a large decrease in MR image intensity for chlorine relative to sodium.
Fig. 4.
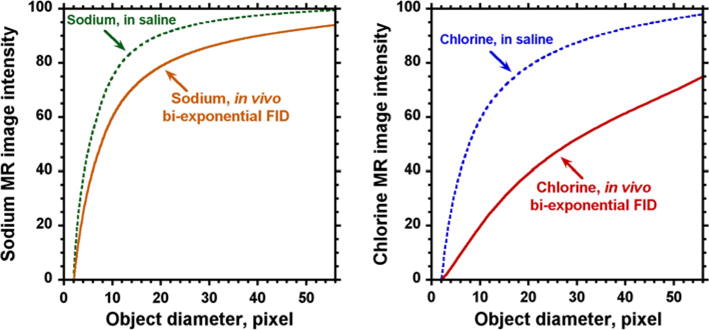
3D model of the effect from bi-exponential FID, and small acquisition matrix size on the image intensity for sodium and chlorine MRI. X-axis shows the diameter of a spherical object in pixels for the field of view covered by 64 pixels. Y-axis represents the average intensity inside the object relative to the reference which had the size covered by matrix of 56 × 56 × 56 voxels. The upper curves demonstrate a partial volume effect on image intensity for the saline test sample. The lower curves represent additional contributions occurring due to the bi-exponential decay of the FIDs in vivo for sodium and chlorine. The model shows a dramatic effect of both effects for chlorine MRI. The shapes of the chlorine and sodium bi-exponential functions were taken from the corresponding FIDs acquired in this study from a whole rat head
In vivo chlorine and sodium T1 relaxation times in rat head and saline
The inversion recovery curve for chlorine in vivo demonstrates a different behavior from sodium (Fig. 5). A bi-exponential recovery of magnetization was observed only for chlorine: T1a = 4.8 ± 1 ms (A = 70 ± 7 %) and T1b = 24.4 ± 7 ms (B = 30 ± 7 %) with R2 ≥ 0.9982 (n = 3). For sodium, T1 relaxation was well represented by a single exponential function with T1 = 41.4 ± 0.4 ms, R2 ≥ 0.9998 (n = 3). The corresponding T1 values in saline for chlorine were 37.6 ± 0.3 ms, R2 ≥ 0.9988 (n = 14) and for sodium 61 ± 0.3 ms, R2 ≥ 0.9982 (n = 3).
Fig. 5.
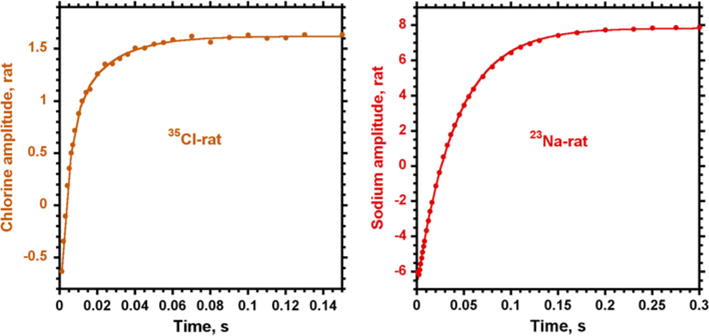
Comparison of chlorine and sodium T1 relaxation curves from rat head in vivo. For chlorine, two exponential fit gave T1a = 4.8 ± 1 ms (A = 70 ± 7 %) and T1b = 24.4 ± 7 ms (B = 30 ± 7 %), while T1 relaxation of sodium revealed a single exponential curve with T1 = 41.4 ± 0.4 ms
Chlorine and sodium MRI
The MR images for chlorine and sodium quantification were processed with the same number of FID points of 32, as it was modeled on Fig. 4. To measure 23Na and 35Cl concentration in the rat brain, several ROI were placed within the striatum, laterally to the rat brain midline excluding the ventricles in three different rats. The image intensities were first corrected for T1 relaxation time using the T1 values for the rat head above. Then, the corrections for bi-exponential FID were implemented according to the model (Fig. 4). The correction factors were selected using volume of the test sample (~13.5 ml) and volume of the rat head (~14.9 ml) determined from MRI data. The corresponding object diameters were calculated from the above volumes using the diameters of the matching spheres. As a result, the correction values from Fig. 4 for a bi-exponential decay were for chlorine of 0.575 and for sodium of 0.948. Using these corrections, chlorine concentration in normal rat brain was found to be 33.2 ± 3.8 mM and for sodium of 44.4 ± 3.7 mM.
Chlorine and sodium MR images of rat glioma were acquired for the same animals and are illustrated in Fig. 6. The images were co-registered and show the same part of the anatomy. The large heterogeneity of sodium concentration throughout the glioma can be easily detected. The average sodium concentration in glioma was increased relative to a normal brain approximately 1.4 times. The chlorine concentration is also increased in glioma and spatially correlates with sodium MRI. The ratio for chlorine concentrations between glioma and normal brain was found to be ~1.5.
Fig. 6.
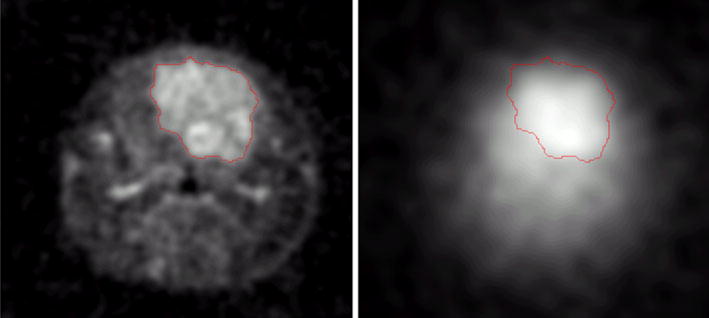
In vivo sodium (left) and chlorine (right) MRI of non-treated rat glioma with resolution of 0.38 and 1 mm, respectively. Chlorine, as well as sodium, concentrations are increased in glioma
Discussion
The weak MR signal from chlorine was dramatically enhanced at the magnetic field of 21.1 T and, thereby, allowed for performing MR imaging experiments in the rat head using a volume RF coil. No doubt, the ultrahigh magnetic field extends the potential of MR imaging for low-gamma nuclei. The most dramatic gain is expected for low-gamma nuclei, where the sensitivity improves proportional to almost the square of the frequency increase [8]. There is a major gap in MR sensitivity between proton and sodium (Table 1). If, however, we can overcome this gap by accessing ultrahigh magnetic fields, then we can be very close to performing MRI for many different less-sensitive nuclei such as chlorine, potassium and others.
In vivo FID signals from both chlorine and sodium exhibit similar very rapidly decaying components ( ms for chlorine and ms for sodium) in addition to more slowly decaying components. The rapidly decaying components represent up to 41 % of the FID for chlorine and up to 83 % of the signal for sodium. The presence of very quickly decaying components in the FID makes it important to have only a very small delay after the RF pulse to allow detection of the entire MR signals. It also requires using very short readout time to minimize the distortions in the MR images due to an additional partial volume effect because of the bi-exponential FID [4]. For nuclei as chlorine, with strong quadrupolar interactions, the effects from bi-exponential decay can be very dramatic and require proper correction.
T1 relaxation curves were different for chlorine and sodium in the rat head. The relaxation of sodium showed mono-exponential behavior with T1 = 41.4 ms. The presence of two components in chlorine T1 relaxation can be an indicator of a strong quadrupolar interaction of chlorine in vivo relative to sodium. The more rapid relaxation of chlorine (T1 = 37.6 ms) in saline solution than of sodium (T1 = 61 ms) also supports this statement. This observation from MR relaxation correlates with the enhanced binding capability of chlorine [23].
It was compelling to evaluate the difference in S/N between chlorine and sodium signals at 21.1 T. A direct comparison of the sodium and chlorine signal was feasible due to the identical design and size of the RF coils used. We also used the same sample size, position and molar concentrations to facilitate S/N comparison. The sensitivity difference between sodium and chlorine for the test sample represented as a ratio of its S/N values was found to be 19.4 ± 0.5. This is reasonably close to the theoretical value of 20.3 (Table 1) evaluated using dependence of S/N on resonance frequency [8].
We used normal rats having the same age and weight to perform the comparison between sodium and chlorine MRI. The corresponding ratio of sodium to chlorine S/N values for the rat heads in vivo was 36.1 ± 3.6. Thus, the ratio in vivo was ~1.9 times higher than the same ratio for the test sample. This finding was somewhat surprising, showing that a total content of chlorine in the rat head is 1.9 times less than sodium. It is generally anticipated that the in vivo sodium signal is 100 % visible and can be detected by MRI. There is also no evidence that in vivo chlorine could be invisible. This is also supported by our data for the rat head revealing that in vivo value for chlorine FID is comparable to the corresponding value for sodium. The concentrations of sodium and chlorine found in the rat brain in the present study agree with the measurements of others also performed in the rat brain [24, 25]. Thus, it is expected that the chlorine concentration in tissue beyond the brain could be dramatically less than sodium.
Sodium concentration is usually higher in glioma than in a normal brain. The current experiments demonstrate a sodium concentration in glioma 1.4 times higher than in a normal brain. Moreover, the high-resolution images revealed a large heterogeneity of sodium concentration inside the glioma. It was also remarkable to find a very large chlorine concentration inside glioma, estimated at ~1.5 times more than that in a normal brain. This value is only an estimation, as no corrections for chlorine relaxation time in glioma were performed. The T1 relaxation measurements of chlorine and sodium have been done only in normal rats. T1 relaxation time of sodium in glioma can be up to 57 ms, which is larger than that in a normal rat brain [26]. Thus, in reality, the difference can be more than 1.5 times. The increased chlorine concentration in glioma correlates with the hypothesis of others on the importance of chlorine for tumor progression [14–18].
Conclusion
The study demonstrates the capability of using low-gamma nuclei for MRI at 21.1 T. For the first time, 3D in vivo chlorine MR images of rat head were acquired. The quality of the images with a resolution of 1 mm allowed the quantification of chlorine concentration and comparison to sodium concentration in the rat brain. It was crucial to compensate for the fast relaxing components of both chlorine and sodium as well as for limited k-space sampling typical of MRI of weak signals. The modeling of these effects demonstrates their dramatic contribution to the quantification of in vivo chlorine and sodium MR signals. The finding of increased concentration of chlorine in glioma correlates with the hypothesis on critical role of chlorine for tumor progression. Sodium MRI with 3D resolution of 0.38 mm was achieved which demonstrates a high heterogeneity of sodium throughout glioma and a capability of MRI at ultrahigh magnetic field.
Acknowledgments
Special thanks to Ashley Blue, Richard Desilets, for their valuable help and contribution to the project. The study was supported by National Science Foundation Grant No. DMR-0654118.
Contributor Information
Victor D. Schepkin, National High Magnetic Field Laboratory, Florida State University, 1800 East Paul Dirac Drive, Tallahassee, FL 32310-4005, USA
Malathy Elumalai, National High Magnetic Field Laboratory, Florida State University, 1800 East Paul Dirac Drive, Tallahassee, FL 32310-4005, USA.
Jason A. Kitchen, National High Magnetic Field Laboratory, Florida State University, 1800 East Paul Dirac Drive, Tallahassee, FL 32310-4005, USA
Chunqi Qian, National Institute of Neurological Disorders and Stroke, National Institutes of Health, Bethesda, MD 20892, USA.
Peter L. Gor’kov, National High Magnetic Field Laboratory, Florida State University, 1800 East Paul Dirac Drive, Tallahassee, FL 32310-4005, USA
William W. Brey, National High Magnetic Field Laboratory, Florida State University, 1800 East Paul Dirac Drive, Tallahassee, FL 32310-4005, USA
References
- 1.Thulborn KR, Lu A, Atkinson IC, Damen F, Villano JL. Quantitative sodium MR imaging and sodium bioscales for the management of brain tumors. Neuroimag Clin N Am. 2009;19(4):615–624. doi: 10.1016/j.nic.2009.09.001. [DOI] [PMC free article] [PubMed] [Google Scholar]
- 2.Boada FE, LaVerde G, Jungreis C, Nemoto E, Tanase C, Hancu I. Loss of cell ion homeostasis and cell viability in the brain: what sodium MRI can tell us. Curr Top Dev Biol. 2005;70:77–101. doi: 10.1016/S0070-2153(05)70004-1. [DOI] [PubMed] [Google Scholar]
- 3.Ouwerkerk R, Bottomley PA, Solaiyappan M, Spooner AE, Tomaselli GF, Wu KC, Weiss RG. Tissue sodium concentration in myocardial infarction in humans: a quantitative 23Na MR imaging study. Radiology. 2008;248(1):88–96. doi: 10.1148/radiol.2481071027. [DOI] [PMC free article] [PubMed] [Google Scholar]
- 4.Schepkin VD, Bejarano FC, Morgan T, Gower-Winter S, Ozambela M, Jr, Levenson CW. In vivo magnetic resonance imaging of sodium and diffusion in rat glioma at 21.1 T. Magn Reson Med. 2012;67(4):1159–1166. doi: 10.1002/mrm.23077. [DOI] [PMC free article] [PubMed] [Google Scholar]
- 5.Zaaraoui W, Konstandin S, Audoin B, Nagel AM, Rico A, Malikova I, Soulier E, Viout P, Confort-Gouny S, Cozzone PJ, Pelletier J, Schad LR, Ranjeva JP. Distribution of brain sodium accumulation correlates with disability in multiple sclerosis: a cross-sectional 23Na MR imaging study. Radiology. 2012;264(3):859–867. doi: 10.1148/radiol.12112680. [DOI] [PubMed] [Google Scholar]
- 6.Nielles-Vallespin S, Weber MA, Bock M, Bongers A, Speier P, Combs SE, Wohrle J, Lehmann-Horn F, Essig M, Schad LR. 3D radial projection technique with ultrashort echo times for sodium MRI: clinical applications in human brain and skeletal muscle. Magn Reson Med. 2007;57(1):74–81. doi: 10.1002/mrm.21104. [DOI] [PubMed] [Google Scholar]
- 7.Kirsch S, Augath M, Seiffge D, Schilling L, Schad LR. In vivo chlorine-35, sodium-23 and proton magnetic resonance imaging of the rat brain. NMR Biomed. 2010;23(6):592–600. doi: 10.1002/nbm.1500. [DOI] [PubMed] [Google Scholar]
- 8.Hoult DI, Richards RE. The signal-to-noise ratio of the nuclear magnetic resonance experiment. J Magn Reson. 1976;213(2):329–343. doi: 10.1016/j.jmr.2011.09.018. [DOI] [PubMed] [Google Scholar]
- 9.Lu M, Zhang Y, Ugurbil K, Chen W, Zhu XH. In vitro and in vivo studies of (17) O NMR sensitivity at 9.4 and 16.4 T. Magn Reson Med. 2012;69(6):1523–1527. doi: 10.1002/mrm.24386. [DOI] [PMC free article] [PubMed] [Google Scholar]
- 10.Schepkin VD, Brey WW, Gor’kov PL, Grant SC. Initial in vivo rodent sodium and proton MR imaging at 21.1 T. Magn Reson Imaging. 2010;28(3):400–407. doi: 10.1016/j.mri.2009.10.002. [DOI] [PMC free article] [PubMed] [Google Scholar]
- 11.Haacke EM. Magnetic resonance imaging: physical principles and sequence design. Wiley; New York: 1999. [Google Scholar]
- 12.Bernstein MA, King KF, Zhou ZJ. Handbook of MRI pulse sequences. Academic Press; Amsterdam: 2004. [Google Scholar]
- 13.Liang Z-P, Lauterbur PC, IEEE Engineering in Medicine and Biology Society . Principles of magnetic resonance imaging: a signal processing perspective. SPIE Optical Engineering Press; IEEE Press; Bellingham: 2000. (IEEE Press series in biomedical engineering). [Google Scholar]
- 14.Habela CW, Ernest NJ, Swindall AF, Sontheimer H. Chloride accumulation drives volume dynamics underlying cell proliferation and migration. J Neurophysiol. 2009;101(2):750–757. doi: 10.1152/jn.90840.2008. [DOI] [PMC free article] [PubMed] [Google Scholar]
- 15.Hiraoka K, Miyazaki H, Niisato N, Iwasaki Y, Kawauchi A, Miki T, Marunaka Y. Chloride ion modulates cell proliferation of human androgen-independent prostatic cancer cell. Cell Physiol Biochem. 2009;25(4–5):379–388. doi: 10.1159/000303042. [DOI] [PubMed] [Google Scholar]
- 16.Civan MM. Transporters beyond transport. Focus on “Deregulation of apoptotic volume decrease and ionic movements in multidrug-resistant tumor cells: role of chloride channels”. Am J Physiol Cell Physiol. 2010;298(1):C11–C13. doi: 10.1152/ajpcell.00459.2009. [DOI] [PMC free article] [PubMed] [Google Scholar]
- 17.Heimlich G, Cidlowski JA. Selective role of intracellular chloride in the regulation of the intrinsic but not extrinsic pathway of apoptosis in Jurkat T-cells. J Biol Chem. 2006;281(4):2232–2241. doi: 10.1074/jbc.M507367200. [DOI] [PubMed] [Google Scholar]
- 18.Sontheimer H. An unexpected role for ion channels in brain tumor metastasis. Exp Biol Med. 2008;233(7):779–791. doi: 10.3181/0711-MR-308. [DOI] [PMC free article] [PubMed] [Google Scholar]
- 19.Sartor P, Madec F, Garcia L, Dejean L, Beauvoit B, Dufy B, Rigoulet M. Interactions between intracellular chloride concentrations, intracellular pH and energetic status in rat lactotrope cells in primary culture. Gen Physiol Biophys. 2004;23(2):195–208. [PubMed] [Google Scholar]
- 20.Poulsen KA, Andersen EC, Hansen CF, Klausen TK, Hougaard C, Lambert IH, Hoffmann EK. Deregulation of apoptotic volume decrease and ionic movements in multidrug-resistant tumor cells: role of chloride channels. Am J Physiol Cell Physiol. 2010;298(1):C14–C25. doi: 10.1152/ajpcell.00654.2008. [DOI] [PubMed] [Google Scholar]
- 21.Fu R, Brey WW, Shetty K, Gor’kov P, Saha S, Long JR, Grant SC, Chekmenev EY, Hu J, Gan Z, Sharma M, Zhang F, Logan TM, Bruschweller R, Edison A, Blue A, Dixon IR, Markiewicz WD, Cross TA. Ultra-wide bore 900 MHz high-resolution NMR at the National High Magnetic Field Laboratory. J Magn Reson. 2005;177(1):1–8. doi: 10.1016/j.jmr.2005.07.013. [DOI] [PubMed] [Google Scholar]
- 22.Qian C, Masad IS, Rosenberg JT, Elumalai M, Brey WW, Grant SC, Gor’kov PL. A volume birdcage coil with an adjustable sliding tuner ring for neuroimaging in high field vertical magnets: ex and in vivo applications at 21.1 T. J Magn Reson. 2012;221:110–116. doi: 10.1016/j.jmr.2012.05.016. [DOI] [PMC free article] [PubMed] [Google Scholar]
- 23.Bull TE, Andrasko J, Chiancone E, Forsen S. Pulsed nuclear magnetic resonance studies on 23 Na, 7 Li and 35 Cl binding to human oxy- and carbon monoxyhaemoglobin. J Mol Biol. 1973;73(2):251–259. doi: 10.1016/0022-2836(73)90327-6. [DOI] [PubMed] [Google Scholar]
- 24.Christensen JD, Barrere BJ, Boada FE, Vevea JM, Thulborn KR. Quantitative tissue sodium concentration mapping of normal rat brain. Magn Reson Med. 1996;36(1):83–89. doi: 10.1002/mrm.1910360115. [DOI] [PubMed] [Google Scholar]
- 25.Erecinska M, Cherian S, Silver IA. Brain development and susceptibility to damage; ion levels and movements. Curr Top Dev Biol. 2005;69:139–186. doi: 10.1016/S0070-2153(05)69006-0. [DOI] [PubMed] [Google Scholar]
- 26.Schepkin VD. Proceedings of the joint annual meeting ISMRM-ESMRMB. Vol. 2007. Berlin, Germany: 2007. May 19–25, Sodium MRI clocks pre-necrotic alterations in rat glioma without changes in tumor diffusion; p. 2997. [Google Scholar]


