

Abstract
Background
The effect of second‐hand smoking, especially husband smoking, on wife's hypertension has not been well studied. The current study was aimed to assess the association of husband smoking with wife's hypertension among females aged 20 to 49 years.
Methods and Results
This study included 5 027 731 females along with their husbands from the National Free Pre‐pregnancy Checkup Projects conducted across 31 provinces in China in 2014. Smoking/passive smoking status was collected by a standard questionnaire and blood pressure was measured by an electronic device after 10 minutes rest. Odds ratios and their corresponding 95% CIs for female hypertension were estimated according to smoking status of husband and wife, husbands' smoking amount, and cumulative exposure to husband smoking. Compared with neither‐smoker group, the multivariable‐adjusted odds ratio for female hypertension was 1.28 (1.27–1.30), 1.53 (1.30–1.79), and 1.50 (1.36–1.67) in husband‐only, wife‐only, and mixed group, respectively. Furthermore, a higher risk of having hypertension was associated with amount and cumulative exposure of husband smoking. For example, compared with neither‐smoker, the multivariate‐adjusted odds ratio was 1.22 (1.19–1.25), 1.24 (1.21–1.26), 1.32 (1.26–1.37), 1.37 (1.34–1.41), and 1.75 (1.64–1.87) for females whose husband smoked 1 to 5, 6 to 10, 11 to 15, 16 to 20, and ≥21 cigarettes per day, respectively (P for trend<0.001). Subgroup analyses identified similar results.
Conclusions
There were associations of husband smoking with female hypertension prevalence. A family‐based smoking restriction strategy may reduce smoking in males and improve hypertension control in females.
Keywords: China, cross‐sectional study, hypertension, passive smoking
Subject Categories: Epidemiology, Lifestyle, Risk Factors, Women, Hypertension
Introduction
As the leading risk factor for global burden of disease and global mortality, the prevalence of high blood pressure (BP) has been expected to increase over the next decade worldwide.1, 2 In 2010, the prevalence of hypertension was about 26.7% among the Chinese population aged 20 years and older, and that in women has reached 24.5%.3 Although 31% to 68% of BP variation in the population may be genetically determined,4 the small aggregate effect of identified genetic loci has limited its applicability to hypertension prevention.5 Therefore, environmental factors, also important in causing high BP, are critical in the management, prevention, and control of hypertension.
Nonpharmacological management of hypertension, including smoking cessation, weight reduction, and a healthy dietary pattern with low sodium, low fat, and high fresh fruit and vegetable intake and physical activities, have been recommended in the most recent hypertension guidelines from the United States, the United Kingdom, Europe, and China.6, 7, 8, 9 Tobacco smoking is one of the leading risk factors for disease burden in China and worldwide.10 Globally, 35% of women nonsmokers were exposed to second‐hand smoke, and 47% of deaths from second‐hand smoke occurred in women in 2004.11 In China, an estimate of only 2.4% adult women were smokers and over 740 million nonsmokers were exposed to second‐hand smoke,12, 13 which means passive smoking is a more serious public health problem than active smoking in women in countries where the prevalence of women smoking is low. Studies of health consequences of passive smoking in China, a country where the prevalence of tobacco use in men is one of the highest in the world,13 have critical implications.
Active and passive smoking has been established as a risk factor for all causes of mortality and several chronic diseases, including coronary heart disease and stroke,14, 15, 16 and active smoking is identified as a risk factor for hypertension by abundant evidence.17 However, whether exposure to second‐hand smoking, especially husband smoking, increases the risk of hypertension of females remains unclear. Several studies have investigated the effect of passive smoking on hypertension, but their generalities were limited by small sample size or restriction of only rural participants.18, 19, 20 It is noteworthy that women in China are exposed to tobacco smoke more frequently at home than at workplaces.13 Therefore, evidence on the association of husband smoking with wife's hypertension will be helpful for hypertension prevention in Chinese women.
The current study aimed to assess the association between husband smoking and wife's hypertension among over 5 million couples in a cross‐sectional study based on the National Free Pre‐pregnancy Checkups Project (NFPCP) in 2014.
Methods
Participants
The NFPCP is a national health service for reproductive‐aged couples who plan to conceive in 6 months. Since 2010, the NFPCP has been supported by the National Health and Family Planning Commission and the Ministry of Finance of the People's Republic of China. Detailed design, organization, and implementation of this project are described elsewhere.21 The NFPCP started with serving only rural married couples between 2010 and 2012 and after 2013, the services were extended to both rural and urban married couples. Women aged 20 to 49 years old were eligible for this service, and no age limitation was set for men. In 2014, the NFPCP has served couples from 2907 counties/districts across 31 provinces in Mainland China. Through health education and advocacy by residents' committee, eligible couples were encouraged to participate in the NFPCP services together in local family planning service agencies or maternal and child care service centers.
The current study was based on the health examination data of the NFPCP from January 1 to December 31, 2014. A total of 5 537 307 eligible couples participated in the NFPCP in 2014. We then further excluded participants with missing information on BP or smoking status, as well as those with heart disease, chronic kidney disease, diabetes mellitus, or thyroid diseases. Finally, 5 027 731 couples were included in the current analysis. Detailed information on the study population recruitment is shown in Figure 1.
Figure 1.
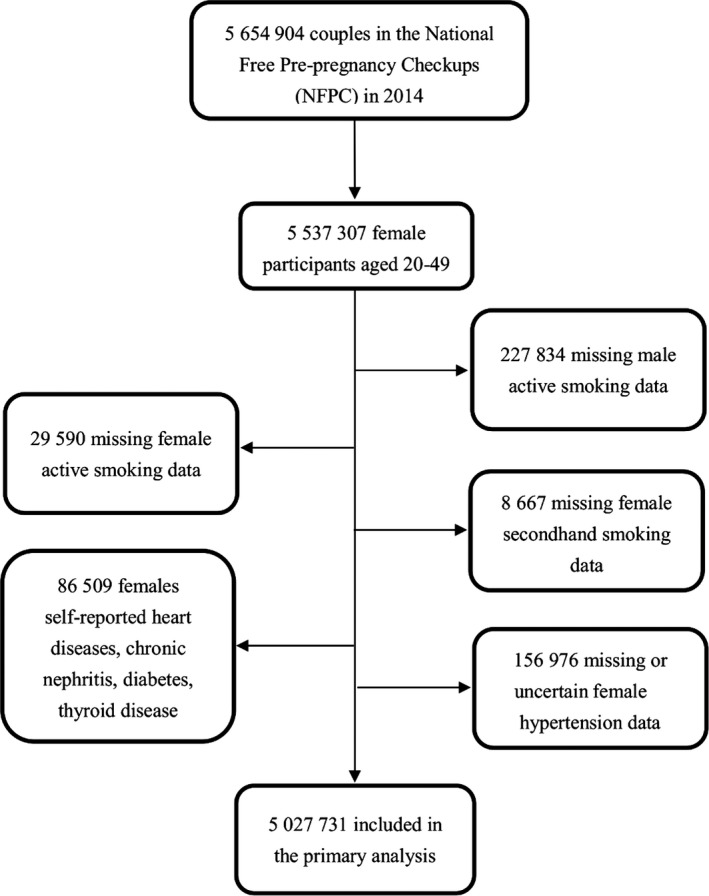
Selection of couples for examining association of husband smoking with wife's hypertension.
Data Collection
A face‐to‐face interview and medical examination were conducted by trained healthcare staff. Demographic characteristics and lifestyle information were collected by questionnaires for husband and wife, separately. “Did you smoke?” and “Are you exposed to passive smoking?” were asked to identify active and passive smoking status of husbands and wives. Furthermore, smoking amount (cigarettes per day) was collected if they replied “yes” to the first question and the duration of exposure to passive smoking (minutes per day) was also collected if they replied “often” to the second question. Other survey variables included women's alcohol consumption and hypertension history, education level, and urban/rural inhabitants according to the address of household registration; vegetable consumption and meat/egg consumption were also collected. All data were uploaded and transferred remotely and stored in the NFPCP medical service information system, which was supported by the National Research Institute for Family Planning. This study was approved by the Institutional Research Review Board at the National Health and Family Planning Commission. Informed consents were obtained from all the NFPCP participants.
Exposure and Outcome
Smoking was defined as ≥1 cigarette smoking per day for at least 1 year at the time of examination. Second‐hand smoking exposure was defined as exposure to environmental tobacco smoke every day. Duration of marriage was the interval years between marriage year and the examination year, which is 2014. Body weight and height were measured with light indoor clothes without shoes and other accessories. Body mass index (BMI) was calculated as kilograms per square meters (kg/m2). According to smoking status of both husband and wife, 5 027 731 couples were divided into 4 groups: (1) neither wife nor husband smoked (neither‐smoker), (2) only the husband smoked (husband‐only), (3) only the wife smoked (wife‐only), and (4) both smoked (mixed). Based on husbands' smoking amount, we also split the couples into 6 groups (0, 1–5, 6–10, 11–15, 16–20, and ≥21 cigarettes per day). In addition, with the purpose of evaluating the cumulative effect of husband smoking on wife's hypertension, we calculated “pack‐marriage year” by multiplying the number of packs of cigarettes husband smoked per day by the number of marriage duration, which is similar to “pack‐year.” For example, 1 pack‐marriage years is equal to husbands' smoking 20 cigarettes (1 pack) per day for 1 year of marriage, or 40 cigarettes (2 packs) per day for half a year of marriage. All couples were divided into 6 groups according to pack‐marriage year (0, 0.1–2.0, 2.1–4.0, 4.1–6.0, 6.1–8.0, and >8.0 pack‐marriage years).
By following the standard protocol entitled “Guidelines for Physical Examination of the NFPCP,” physicians conducted BP measurement in the right arm of the participants using an automated BP monitor, on a single occasion after participants rested for at least 10 minutes. As the main outcome of this study, hypertension status in women is determined by the combined information of self‐reported hypertension history and seated BP measurement. Hypertension was defined as systolic BP/diastolic BP ≥140/90 mm Hg or self‐reported hypertension history.
Statistical Analysis
Baseline characteristics were presented as mean (SD) or median (interquartile range) for continuous variables, and number (percentages) for categorical variables according to BP status, respectively. Differences of baseline characteristics between BP groups were examined using independent t tests or Wilcoxon rank sum tests for continuous variables and χ2 tests for categorical variables, respectively.
We estimated the odds ratios (ORs) and their corresponding 95% CIs of hypertension associated with smoking status of couples (neither‐smoker, husband‐only, wife‐only, and mixed group), husband smoking amount (0, 1–5, 6–10, 11–15, 16–20, and ≥21 cigarettes per day), and the cumulative exposure to husband smoking (0, 0.1–2.0, 2.1–4.0, 4.1–6.0, 6.1–8.0, and >8.0 pack‐marriage years) using an age‐adjusted and multivariate‐adjusted logistic regression model, respectively. A total of 5 027 731 couples were used to examine the association between couples smoking status and hypertension, and 15 753 couples from the wife‐only group or mixed group were excluded from the analyses on association of husband smoking amount or cumulative exposure to husband smoking with hypertension. Furthermore, 621 776 couples with missing marriage duration were also excluded from the analysis on association of cumulative exposure to husband smoking with hypertension. Covariates in the multivariate‐adjusted logistic regression model included age, high school education, urban inhabitants, BMI, and alcohol consumption. Subgroup analyses were performed according to the duration of husband smoking exposure (minutes per day), education levels, living area (urban/rural), alcohol consumption, and the BMI category, respectively. The current study incorporated a wide range of Chinese ethnicities including Han, Uygur, Zhuang, Hui, Miao, Tujia, Yi, Mongolia, Manchu, Tibetan, and others. The Chinese Han population accounted for 87.8% of the total study population. Subgroup analysis was also conducted taking the impact of sodium intake on BP into consideration.22 Participants were classified into 3 groups according to sodium intake condition of different provinces, including provinces with less sodium intake (group 1=Sichuan, Guangdong, Jiangxi, Ningxia, Jilin, Shanghai, Inner Mongolia, Heilongjiang, and Liaoning), excessive sodium intake provinces (group 2=Jiangsu, Zhejiang, Qinghai, Hubei, Hebei, Shaanxi, Hunan, Fujian, Henan, Guangxi, and Beijing), and sodium intake unavailable provinces (group 3=Tianjin, Anhui, Shandong, Hainan, Chongqing, Guizhou, Yunnan, Tibetan, Shanxi, Gansu, and Sinkiang). We also conducted sensitivity analyses restricting the population from the same specific ethnicities, couples where wives were without known hypertension, and couples with marriage duration of ≥2 years. Additionally, sensitivity analysis was also conducted by excluding women who did not like vegetables and those who were vegetarian.
We further conducted dose–response analyses on the association of husband smoking and hypertension prevalence based on the husband smoking amount and the cumulative exposure to husband smoking. By treating a categorical variable as an ordinal variable in the regression model, we tested the significance of the linear trend. The R software (version 3.2.2; https://www.r-project.org/) was used for all analyses. The Speedglm package (version 0.3–1) was used for fitting logistic regression modeling with large data sets by updating algorithms.
Results
Among 5 027 731 women aged 20 to 49 years recruited in 2014, the prevalence of hypertension is 1.88%. Among 94 550 hypertensive patients, 92 549 were defined by BP measurement, 3983 were defined by self‐reported hypertension history, and 1982 were self‐reported hypertensive patients with systolic BP/diastolic BP ≥140/90 mm Hg during the physical examination. The characteristics of women are presented according to their hypertension status (Table 1). Women with hypertension were more likely to be older, urban inhabitants, and with less educational attainment, compared to the women without hypertension. They were also more likely to drink alcohol and have higher BMIs than those who were not hypertensive. Particularly, women with hypertension had longer marriage duration, larger probability of exposure to husband smoking, and longer duration of second‐hand smoking exposure than those in the normotensive group.
Table 1.
Characteristics of Female Participants According to Blood Pressure Status From 5 027 731 Couples
| Variables | Normotensive | Hypertensive | P Value |
|---|---|---|---|
| N | 4 933 181 | 94 550 | ··· |
| Age, y | <0.0001 | ||
| 20 to 24 | 1 971 069 (39.96) | 26 787 (28.33) | |
| 25 to 29 | 1 979 067 (40.12) | 32 639 (34.52) | |
| 30 to 34 | 664 997 (13.48) | 17 964 (19.00) | |
| 35 to 39 | 231 436 (4.69) | 10 543 (11.15) | |
| ≥40 | 86 612 (1.76) | 6617 (7.00) | |
| Nationality, n (%) | <0.0001 | ||
| Han | 4 332 198 (88.95) | 80 695 (86.21) | |
| Others | 538 388 (11.05) | 12 903 (13.79) | |
| Urban inhabitants, n (%) | 396 603 (8.04) | 8743 (9.25) | <0.0001 |
| Higher education, n (%) | 1 568 691 (32.7) | 25 961 (28.17) | <0.0001 |
| Marriage duration (y)a, median (IQR) | 1 (0–4) | 3 (0–7) | <0.0001 |
| BMI (kg/m2) | <0.0001 | ||
| Underweight (<18.5) | 642 793 (13.05) | 7944 (8.42) | |
| Normal weight (18.5‐) | 3 488 821 (70.84) | 50 805 (53.86) | |
| Overweight (24.0‐) | 640 849 (13.01) | 22 773 (24.14) | |
| Obese (28.0‐) | 152 525 (3.10) | 12 812 (13.58) | |
| Alcohol consumption, n (%) | 144 316 (2.93) | 3658 (3.88) | <0.0001 |
| Smoking amount (cigarettes per day), n (%) | <0.0001 | ||
| 0 | 4 918 004 (99.69) | 93 974 (99.39) | |
| 1 to 5 | 7889 (0.16) | 264 (0.28) | |
| 6 to 10 | 4628 (0.09) | 189 (0.20) | |
| 11 to 15 | 2532 (0.05) | 121 (0.13) | |
| Duration of second‐hand smoking exposure (minutes/day), n (%) | <0.0001 | ||
| 0 | 4 399 820 (95.73) | 80 461 (93.25) | |
| 1 to 15 | 124 287 (2.70) | 3199 (3.71) | |
| ≥16 | 72 153 (1.57) | 2622 (3.04) | |
| Smoking status of couples, n (%) | <0.0001 | ||
| Neither‐smoker | 3 531 347 (71.58) | 61 343 (64.88) | |
| Husband‐only | 1 386 657 (28.11) | 32 631 (34.51) | |
| Wife‐only | 4189 (0.08) | 172 (0.18) | |
| Mixed | 10 988 (0.22) | 404 (0.43) | |
| Husband smoking amount (cigarettes per day), n (%) | <0.0001 | ||
| 0 | 3 535 536 (71.67) | 61 515 (65.06) | |
| 1 to 5 | 339 318 (6.88) | 7076 (7.48) | |
| 6 to 10 | 609 206 (12.35) | 13 310 (14.08) | |
| 11 to 15 | 113 207 (2.29) | 2700 (2.86) | |
| 16 to 20 | 313 259 (6.35) | 8968 (9.48) | |
| ≥21 | 22 655 (0.46) | 981 (1.04) | |
| Cumulative exposure of husband smoking (pack‐marriage years)b, n (%) | <0.0001 | ||
| 0 | 3 750 871 (84.89) | 65 502 (76.7) | |
| 0.1 to 2.0 | 376 222 (8.51) | 8350 (9.78) | |
| 2.1 to 4.0 | 141 110 (3.19) | 4186 (4.90) | |
| 4.1 to 6.0 | 65 963 (1.49) | 2366 (2.77) | |
| 6.1 to 8.0 | 31 813 (0.72) | 1432 (1.68) | |
| >8.0 | 52 537 (1.19) | 3568 (4.18) | |
BMI indicates body mass index; IQR, interquartile range.
Duration of marriage was defined as the interval years between marriage year and the examination year.
Pack‐marriage years were used to evaluate the cumulative exposure of spouse smoking, calculated by multiplying the number of packs of cigarettes husband smoked per day by the number of marriage duration.
Among 5 027 731 couples, 28.23% of them (1 419 288 couples) were classified into the husband‐only group. The hypertension prevalence of women was 1.71%, 2.30%, 3.94%, and 3.55% in the neither‐smoker, husband‐only, wife‐only, and mixed group, respectively. Compared with couples where neither spouse smoked, the multivariate‐adjusted OR for hypertension among women was 1.28 (95% CI: 1.27–1.30), 1.53 (95% CI: 1.30–1.79), and 1.50 (95% CI: 1.36–1.67) in the husband‐only, wife‐only, and mixed group, respectively, which implied a significant adverse effect of husband smoking on wife's hypertension (Table 2). In addition, subgroup analyses revealed that the associations between husband smoking and wife's hypertension were consistent across all subgroups (Table 3). It is interesting that although wives did not report second‐hand smoking exposure, those in the husband‐only group were still at an increased risk of hypertension, with the multivariate‐adjusted OR being 1.22 (95% CI: 1.20–1.24) (Table 3).
Table 2.
Association Between Exposure Measurements and Prevalent Hypertension of Female Participants
| Exposure Measurements | Age‐Adjusted | Multivariate‐Adjusteda | ||
|---|---|---|---|---|
| N (%) | OR (95% CI) | N (%) | OR (95% CI) | |
| Couples smoking status | ||||
| Neither‐smoker | 3 592 690 (1.71) | 1.00 | 3 476 410 (1.71) | 1.00 |
| Husband‐only | 1 419 288 (2.30) | 1.35 (1.33–1.36) | 1 379 157 (2.31) | 1.28 (1.27–1.30) |
| Wife‐only | 4361 (3.94) | 1.84 (1.58–2.15) | 4203 (3.88) | 1.53 (1.30–1.79) |
| Mixed | 11 392 (3.55) | 1.76 (1.60–1.95) | 10 972 (3.63) | 1.50 (1.36–1.67) |
| Husbands' smoking amountb | ||||
| 0 | 3 592 690 (1.71) | 1.00 | 3 476 410 (1.71) | 1.00 |
| 1 to 5 | 344 356 (2.04) | 1.26 (1.22–1.29) | 333 811 (2.03) | 1.22 (1.19–1.25) |
| 6 to 10 | 618 257 (2.13) | 1.28 (1.26–1.31) | 600 548 (2.14) | 1.24 (1.21–1.26) |
| 11 to 15 | 114 818 (2.32) | 1.37 (1.32–1.42) | 111 745 (2.32) | 1.32 (1.26–1.37) |
| 16 to 20 | 318 620 (2.77) | 1.48 (1.45–1.52) | 310 371 (2.79) | 1.37 (1.34–1.41) |
| ≥21 | 23 237 (4.14) | 1.94 (1.81–2.07) | 22 682 (4.16) | 1.75 (1.64–1.87) |
| P for trend | <0.0001 | <0.0001 | <0.0001 | <0.0001 |
| Cumulative exposure of Spouse smokingc, d | ||||
| 0 | 3 807 995 (1.71) | 1.00 | 3 731 435 (1.71) | 1.00 |
| 0.1 to 2.0 | 382 046 (2.16) | 1.34 (1.31–1.37) | 376 515 (2.15) | 1.23 (1.20–1.26) |
| 2.1 to 4.0 | 144 216 (2.87) | 1.49 (1.44–1.54) | 142 135 (2.85) | 1.36 (1.32–1.41) |
| 4.1 to 6.0 | 67 739 (3.46) | 1.53 (1.47–1.60) | 66 801 (3.45) | 1.40 (1.35–1.47) |
| 6.1 to 8.0 | 32 932 (4.29) | 1.63 (1.54–1.72) | 32 469 (4.29) | 1.50 (1.42–1.59) |
| >8.0 | 55 274 (6.35) | 1.79 (1.72–1.85) | 54 532 (6.35) | 1.63 (1.56–1.68) |
| P for trend | <0.0001 | <0.0001 | <0.0001 | <0.0001 |
OR indicates odds ratio.
Adjusted for age, urban inhabitants, higher school education, body mass index, and alcohol consumption.
After excluding 15 753 couples from the analysis because of female active smoking, 5 011 978 couples remained in this analysis.
Cumulative exposure of Spouse smoking was defined by pack‐marriage year to evaluate the cumulative exposure of spouse smoking, calculated by multiplying the number of packs of cigarettes husband smoked per day by the number of marriage duration.
After excluding 15 753 couples from the analysis because of female active smoking and 621 776 couples missing marriage duration, 4 390 202 couples remained in this analysis.
Table 3.
Subgroup Analyses on Associations Between Husband Smoking and Prevalent Hypertension Among Females
| Subgroup | Neither‐Smoker | Husband‐Only | Multivariate‐Adjusted ORa (95% CI) | ||
|---|---|---|---|---|---|
| No. of Participants | No. of Hypertension (%) | No. of Participants | No. of Hypertension (%) | ||
| Age, y | |||||
| 20 to 24 | 1 317 255 | 16 512 (1.25) | 496 225 | 7551 (1.52) | 1.16 (1.13–1.19) |
| 25 to 29 | 1 338 749 | 19 750 (1.48) | 463 824 | 8929 (1.93) | 1.21 (1.18–1.24) |
| 30 to 34 | 447 925 | 10 477 (2.34) | 163 527 | 5181 (3.17) | 1.25 (1.20–1.29) |
| 35 to 39 | 156 924 | 5967 (3.80) | 60 497 | 3207 (5.30) | 1.29 (1.23–1.35) |
| ≥40 | 60 104 | 3630 (6.04) | 23 846 | 2123 (8.90) | 1.37 (1.29–1.45) |
| Second‐hand smoking, minutes per day | |||||
| 0 | 3 256 825 | 54 743 (1.68) | 1 080 787 | 23 117 (2.14) | 1.22 (1.20–1.24) |
| 1 to 15 | 43 930 | 991 (2.26) | 75 578 | 2040 (2.63) | 1.12 (1.03–1.21) |
| ≥16 | 20 202 | 602 (2.98) | 49 554 | 1834 (3.70) | 1.20 (1.09–1.32) |
| Higher school education | |||||
| Yes | 1 134 542 | 17 132 (1.50) | 447 119 | 8543 (1.91) | 1.21 (1.18–1.24) |
| No | 2 341 868 | 42 219 (1.80) | 932 038 | 23 247 (2.49) | 1.32 (1.29–1.34) |
| Urban inhabitants | |||||
| Yes | 265 128 | 5167 (1.95) | 114 362 | 2939 (2.57) | 1.22 (1.16–1.27) |
| No | 3 211 282 | 54 184 (1.69) | 1 264 795 | 28 851 (2.28) | 1.29 (1.27–1.31) |
| Drinking | |||||
| Yes | 76 268 | 1660 (2.18) | 76 268 | 1660 (2.18) | 1.17 (1.09–1.25) |
| No | 3 400 142 | 57 691 (1.70) | 1 318 465 | 30 148 (2.29) | 1.29 (1.27–1.31) |
| BMI categoryb | |||||
| Underweight | 425 212 | 4918 (1.16) | 200 708 | 2748 (1.37) | 1.17 (1.12–1.23) |
| Normal weight | 2 501 460 | 33 159 (1.33) | 928 725 | 15 872 (1.72) | 1.29 (1.26–1.31) |
| Overweight | 444 280 | 13 795 (3.11) | 198 725 | 8237 (4.14) | 1.33 (1.29–1.36) |
| Obesity | 105 458 | 7479 (7.09) | 54 999 | 4933 (8.97) | 1.28 (1.24–1.33) |
BMI indicates body mass index; OR, odds ratio.
Adjusted for age, urban inhabitants, higher school education, BMI, and alcohol consumption.
Females with BMI ≤18.0, 18.0 to 23.9, 24.0 to 27.9, and ≥28.0 kg/m2 were defined as underweight, normal weight, overweight, and obese.
The hypertension prevalence in women showed significant linear trends with husband smoking amount (Table 2). Using neither‐smoker group as the reference group, the multivariate‐adjusted ORs of hypertension among women were 1.22 (95% CI: 1.19–1.25), 1.24 (95% CI: 1.21–1.26), 1.32 (95% CI: 1.26–1.37), 1.37 (95% CI: 1.34–1.41), and 1.75 (95% CI: 1.64–1.87) for women whose husband smoked 1 to 5, 6 to 10, 11 to 15, 16 to 20, and ≥21 cigarettes per day, respectively (P for trend<0.001). Consistent results and similar linear trends were also obtained across all subgroup analyses according to age, duration of second‐hand smoking exposure, education level, living area (urban/rural), alcohol consumption, and BMI category (Figure 2, P for trend<0.001). In addition, increases in both duration of second‐hand smoking exposure and husband smoking amount were associated with substantially increased risk of hypertension. Similar results were also observed for combined groups of duration of second‐hand smoking with husband smoking amount or cumulative exposure to husband smoking, as well as of BMI categories with the aforementioned 2 indicators (Tables 4 and 5).
Figure 2.
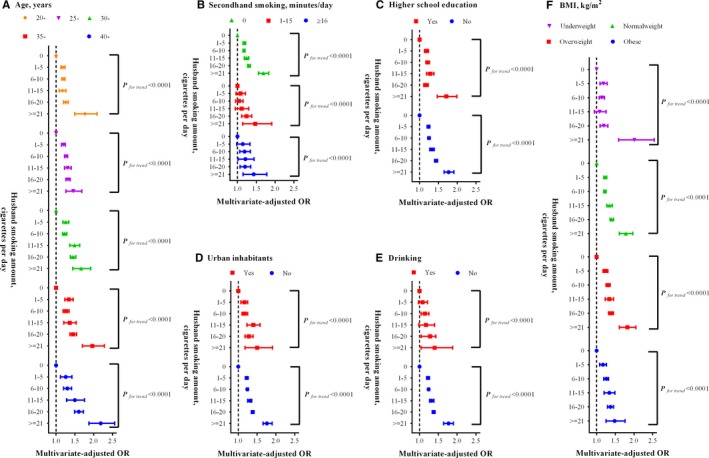
Subgroup analyses on association between husband smoking amount and prevalent hypertension in women. (A), Age, years; (B) second‐hand smoking, minutes/day; (C) higher school education; (D) urban inhabitants; (E) drinking; (F) BMI, kg/m2. BMI indicates body mass index; OR, odds ratio.
Table 4.
Odds Ratiosa (95% CI) for Female Hypertension in Females With Different Husband Smoking Amount According to Second‐Hand‐Smoking Duration and BMI Category
| Group | Husband Smoking Amount (Cigarettes Per Day) | |||||
|---|---|---|---|---|---|---|
| 0 | 1 to 5 | 6 to 10 | 11 to 15 | 16 to 20 | ≥21 | |
| Second‐hand smoking duration, minutes per day | ||||||
| 0 | 1.00 | 1.18 (1.15–1.22) | 1.17 (1.15–1.20) | 1.24 (1.18–1.30) | 1.30 (1.27–1.34) | 1.69 (1.56–1.83) |
| 1 to 15 | 1.30 (1.22–1.38) | 1.39 (1.26–1.53) | 1.34 (1.24–1.44) | 1.43 (1.23–1.66) | 1.63 (1.50–1.77) | 1.99 (1.55–2.55) |
| ≥16 | 1.53 (1.41–1.66) | 1.72 (1.51–1.96) | 1.82 (1.68–1.97) | 1.85 (1.59–2.15) | 1.88 (1.73–2.04) | 2.26 (1.85–2.76) |
| BMI categoryb | ||||||
| Underweight | 0.96 (0.94–0.99) | 1.14 (1.06–1.23) | 1.11 (1.05–1.17) | 1.06 (0.92–1.21) | 1.17 (1.08–1.27) | 1.97 (1.57–2.49) |
| Normal weight | 1.00 | 1.22 (1.18–1.27) | 1.22 (1.19–1.25) | 1.34 (1.27–1.42) | 1.41 (1.36–1.45) | 1.78 (1.61–1.97) |
| Overweight | 2.14 (2.09–2.18) | 2.63 (2.50–2.77) | 2.78 (2.68–2.88) | 2.85 (2.63–3.09) | 2.96 (2.83–3.09) | 3.92 (3.48–4.42) |
| Obese | 5.12 (4.99–5.26) | 6.13 (5.73–6.56) | 6.48 (6.18–6.81) | 6.91 (6.22–7.68) | 6.91 (6.54–7.29) | 7.37 (6.23–8.73) |
BMI indicates body mass index.
Adjusted for age, urban inhabitants, higher school education, BMI, and alcohol consumption.
Females with BMI ≤18.0, 18.0 to 23.9, 24.0 to 27.9, and ≥28.0 kg/m2 were defined as underweight, normal weight, overweight, and obese.
Table 5.
Odds Ratiosa (95% CI) for Female Hypertension in Females With Different Cumulative Exposure of Husband Smoking According to Second‐Hand‐Smoking Duration and BMI Category
| Group | Cumulative Exposure of Husband Smoking (Pack‐Marriage Years)b | |||||
|---|---|---|---|---|---|---|
| 0 | 0.1 to 2.0 | 2.1 to 4.0 | 4.1 to 6.0 | 6.1 to 8.0 | >8.0 | |
| Second‐hand smoking, minutes per day | ||||||
| 0 | 1.00 | 1.19 (1.16–1.22) | 1.32 (1.27–1.37) | 1.34 (1.27–1.41) | 1.43 (1.33–1.52) | 1.56 (1.49–1.63) |
| 1 to 15 | 1.24 (1.18–1.31) | 1.38 (1.26–1.51) | 1.55 (1.37–1.75) | 1.65 (1.41–1.94) | 1.90 (1.55–2.34) | 1.87 (1.64–2.15) |
| ≥16 | 1.59 (1.49–1.69) | 1.91 (1.73–2.11) | 1.80 (1.57–2.05) | 1.96 (1.66–2.31) | 1.85 (1.48–2.30) | 2.33 (2.06–2.62) |
| BMI categoryc | ||||||
| Underweight | 0.95 (0.92–0.98) | 1.16 (1.07–1.25) | 1.26 (1.11–1.44) | 1.29 (1.07–1.56) | 1.33 (1.02–1.74) | 1.43 (1.17–1.75) |
| Normal weight | 1.00 | 1.24 (1.20–1.28) | 1.36 (1.29–1.42) | 1.46 (1.38–1.56) | 1.57 (1.45–1.70) | 1.72 (1.63–1.82) |
| Overweight | 2.17 (2.13–2.21) | 2.62 (2.51–2.74) | 2.93 (2.76–3.12) | 3.02 (2.80–3.27) | 3.21 (2.91–3.54) | 3.55 (3.34–3.77) |
| Obese | 5.21 (5.08–5.35) | 6.31 (5.97–6.67) | 7.20 (6.68–7.76) | 6.65 (5.99–7.37) | 7.14 (6.24–8.16) | 7.32 (6.71–7.99) |
BMI indicates body mass index.
Adjusted for age, urban inhabitants, higher school education, BMI, and alcohol consumption.
Pack‐marriage year were used to evaluate the cumulative exposure of spouse smoking, calculated by multiplying the number of packs of cigarettes husband smoked per day by the number of marriage duration.
BMI ≤18.0, 18.0 to 23.9, 24.0 to 27.9, and ≥28.0 kg/m2 was defined as underweight, normal weight, overweight, and obese.
As shown in Table 2, the risk of having hypertension in women increased with the increment of cumulative exposure, and the multivariate‐adjusted ORs were 1.23 (95% CI: 1.20–1.26), 1.36 (95% CI: 1.32–1.41), 1.40 (95% CI: 1.35–1.47), 1.50 (95% CI: 1.42–1.59), and 1.63 (95% CI: 1.56–1.68) in the group with cumulative exposure of 0.1 to 2.0, 2.1 to 4.0, 4.1 to 6.0, 6.1 to 8.0, and >8.0 pack‐marriage years (P for trend<0.001), respectively, when comparing those who were not exposed to husband smoking. Subgroup analyses generated similar results and linear trends (Figure 3).
Figure 3.
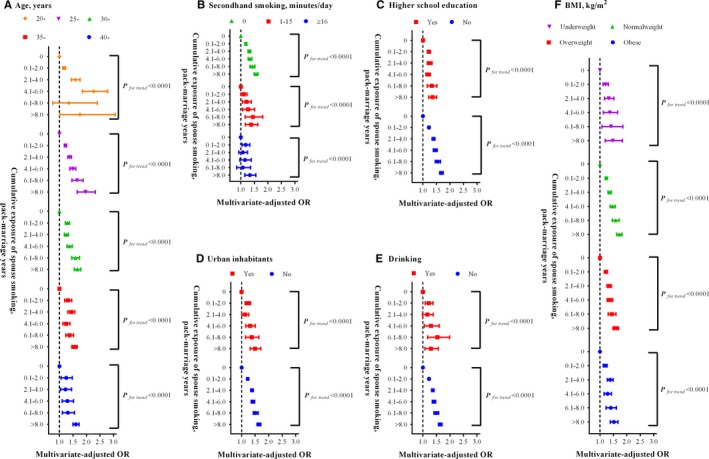
Subgroup analyses on association between cumulative exposure of husband smoking and prevalent hypertension in women. (A), Age, years; (B) second‐hand smoking, minutes/day; (C) higher school education; (D) urban inhabitants; (E) drinking; (F) BMI, kg/m2. BMI indicates body mass index; OR, odds ratio.
In the subgroup analyses restricting to specific ethnicity (including Han, Uygur, Zhuang, Hui, Miao, Tujia, Yi, Mongolia, Manchu, Tibetan, and others), hypertension among women was associated with husband smoking in both categorical and dose–response manners (Table 6). To enhance our findings, provincial analyzed sodium intake was also taken into consideration for subgroup analysis, and the result showed that female hypertension was significantly associated with husband smoking of different measurement in all subgroups (Table 7). To test the robustness of our findings, we excluded women with hypertension history, couples with marriage duration of less than 2 years, women who did not like vegetables, and those who were vegetarian, respectively, and found that the results were not substantially changed (Table 8).
Table 6.
Association of Husband Smoking With Wife's Hypertension According to Ethnicitya
| Han | Uygur | Zhuang | Hui | Miao | Tujia | Yi | Mongolia | Manchu | Tibetan | Others | |
|---|---|---|---|---|---|---|---|---|---|---|---|
| Couples smoking status | |||||||||||
| Neither‐smoker | 1.00 | 1.00 | 1.00 | 1.00 | 1.00 | 1.00 | 1.00 | 1.00 | 1.00 | 1.00 | 1.00 |
| Husband‐only | 1.30 (1.28–1.32) | 0.97 (0.84–1.10) | 1.27 (1.14–1.41) | 1.09 (0.95–1.25) | 1.16 (1.00–1.34) | 1.29 (1.12–1.49) | 1.03 (0.89–1.18) | 0.89 (0.75–1.07) | 1.31 (1.09–1.56) | 0.99 (0.84–1.16) | 1.36 (1.27–1.45) |
| Wife‐only | 1.46 (1.22–1.75) | 2.83 (0.78–10.29) | 3.68 (1.06–12.73) | ··· | 2.71 (0.83–8.90) | 2.29 (0.68–7.71) | 0.91 (0.28–2.91) | 2.09 (1.06–4.13) | 0.87 (0.21–3.66) | 0.86 (0.20–3.62) | 1.68 (0.77–3.65) |
| Mixed | 1.48 (1.32–1.66) | 0.72 (0.10–5.24) | 1.05 (0.25–4.34) | 4.69 (2.44–9.00) | 0.77 (0.19–3.17) | 1.39 (0.59–3.25) | 1.21 (0.70–2.10) | 0.94 (0.42–2.09) | 2.92 (1.59–5.36) | 0.68 (0.21–2.21) | 1.43 (0.86–2.38) |
| Spouse smoking amount, cigarettes per dayb | |||||||||||
| 0 | 1.00 | 1.00 | 1.00 | 1.00 | 1.00 | 1.00 | 1.00 | 1.00 | 1.00 | 1.00 | 1.00 |
| 1 to 5 | 1.25 (1.21–1.28) | 0.95 (0.78–1.16) | 1.17 (0.93–1.48) | 1.14 (0.90–1.44) | 0.95 (0.66–1.35) | 1.05 (0.71–1.55) | 0.92 (0.69–1.22) | 0.86 (0.59–1.25) | 0.89 (0.59–1.36) | 1.03 (0.76–1.39) | 1.28 (1.11–1.48) |
| 6 to 10 | 1.26 (1.23–1.29) | 1.00 (0.82–1.22) | 1.32 (1.15–1.52) | 1.10 (0.91–1.33) | 1.09 (0.88–1.34) | 1.19 (0.98–1.46) | 0.96 (0.79–1.16) | 0.90 (0.70–1.16) | 1.28 (1.00–1.63) | 0.99 (0.78–1.27) | 1.21 (1.09–1.33) |
| 11 to 15 | 1.36 (1.30–1.42) | 0.67 (0.37–1.22) | 1.18 (0.85–1.63) | 1.02 (0.63–1.63) | 0.92 (0.60–1.40) | 1.26 (0.85–1.87) | 1.19 (0.87–1.63) | 0.97 (0.57–1.65) | 1.33 (0.70–2.54) | 0.70 (0.41–1.21) | 1.17 (0.97–1.40) |
| 16 to 20 | 1.38 (1.34–1.41) | 1.01 (0.72–1.43) | 1.18 (1.00–1.40) | 1.17 (0.91–1.49) | 1.31 (1.06–1.61) | 1.38 (1.14–1.67) | 1.10 (0.91–1.33) | 0.83 (0.63–1.11) | 1.51 (1.18–1.94) | 1.11 (0.83–1.48) | 1.57 (1.43–1.72) |
| ≥21 | 1.72 (1.59–1.85) | 1.19 (0.38–3.75) | 2.22 (1.43–3.43) | 1.10 (0.44–2.70) | 1.94 (1.14–3.31) | 1.93 (1.20–3.12) | 1.31 (0.74–2.32) | 1.10 (0.51–2.40) | 2.66 (1.54–4.60) | 0.58 (0.23–1.44) | 2.04 (1.61–2.59) |
| P for trend | <0.0001 | 0.61 | <0.0001 | 0.47 | 0.01 | <0.0001 | 0.22 | 0.43 | <0.0001 | 0.97 | <0.0001 |
| Cumulative exposure of husband smoking (pack‐marriage years)c, d | |||||||||||
| 0 | 1.00 | 1.00 | 1.00 | 1.00 | 1.00 | 1.00 | 1.00 | 1.00 | 1.00 | 1.00 | 1.00 |
| 0.1 to 2.0 | 1.23 (1.20–1.26) | 0.87 (0.71–1.07) | 1.59 (1.33–1.90) | 1.19 (0.97–1.45) | 1.14 (0.89–1.45) | 0.99 (0.71–1.36) | 0.86 (0.69–1.08) | 0.78 (0.55–1.12) | 1.07 (0.76–1.49) | 1.36 (1.05–1.75) | 1.30 (1.17–1.45) |
| 2.1 to 4.0 | 1.38 (1.33–1.43) | 0.91 (0.68–1.23) | 1.35 (1.04–1.75) | 0.96 (0.70–1.30) | 1.33 (0.97–1.81) | 1.49 (1.03–2.14) | 0.94 (0.72–1.22) | 1.28 (0.90–1.81) | 1.17 (0.79–1.72) | 0.72 (0.47–1.11) | 1.33 (1.15–1.52) |
| 4.1 to 6.0 | 1.43 (1.37–1.50) | 0.70 (0.39–1.14) | 1.45 (1.04–2.02) | 1.06 (0.71–1.59) | 1.56 (1.08–2.25) | 1.30 (0.78–2.18) | 0.92 (0.65–1.30) | 0.84 (0.52–1.36) | 1.26 (0.80–1.99) | 1.17 (0.72–1.88) | 1.27 (1.06–1.52) |
| 6.1 to 8.0 | 1.55 (1.46–1.65) | 0.94 (0.50–1.77) | 1.51 (1.00–2.31) | 0.77 (0.42–1.42) | 1.57 (0.96–2.56) | 1.67 (0.96–2.91) | 0.85 (0.53–1.36) | 0.83 (0.47–1.47) | 1.53 (0.94–2.48) | 0.54 (0.20–1.48) | 1.34 (1.06–1.69) |
| >8.0 | 1.64 (1.57–1.71) | 1.53 (1.00–2.34) | 1.98 (1.46–2.68) | 1.07 (0.72–1.59) | 1.21 (0.82–1.81) | 2.20 (1.61–3.01) | 1.46 (1.07–1.98) | 0.85 (0.59–1.23) | 1.31 (0.97–1.76) | 1.27 (0.77–2.08) | 1.63 (1.38–1.92) |
| P for trend | <0.0001 | 0.88 | <0.0001 | 0.59 | 0.01 | <0.0001 | 0.57 | 0.65 | 0.02 | 0.63 | <0.0001 |
Odds ratios (95% CI) were adjusted for age, urban inhabitants, higher school education, body mass index, and alcohol consumption.
Couples with female active smoking were excluded from this analysis.
Pack‐marriage year were used to evaluate the cumulative exposure of spouse smoking, calculated by multiplying the number of packs of cigarettes husband smoked per day by the number of marriage duration.
Couples with female active smoking and missing marriage duration were excluded from this analysis.
Table 7.
Association of Husband Smoking With Wife's Hypertension According to Sodium Intake
| Exposure Measurements | Group 1 | Group 2 | Group 3 | |||
|---|---|---|---|---|---|---|
| N (%) | OR (95% CI)a | N (%) | OR (95% CI)a | N (%) | OR (95% CI)a | |
| Couples smoking status | ||||||
| Neither‐smoker | 685 294 (1.82) | 1.00 | 1 649 556 (1.26) | 1.00 | 1 137 298 (2.29) | 1.00 |
| Husband‐only | 285 379 (2.62) | 1.35 (1.31–1.39) | 581 759 (1.78) | 1.33 (1.30–1.36) | 509 174 (2.72) | 1.17 (1.14–1.19) |
| Wife‐only | 1891 (4.44) | 1.52 (1.21–1.90) | 1251 (3.52) | 1.91 (1.40–2.59) | 1055 (3.32) | 1.21 (0.86–1.70) |
| Mixed | 4471 (3.94) | 1.49 (1.27–1.74) | 3175 (2.83) | 1.52 (1.23–1.89) | 3302 (4.00) | 1.45 (1.21–1.73) |
| Husbands' smoking amountb | ||||||
| 0 | 685 294 (1.82) | 1.00 | 1 649 556 (1.26) | 1.00 | 1 137 298 (2.29) | 1.00 |
| 1 to 5 | 69 194 (2.48) | 1.43 (1.36–1.51) | 145 944 (1.54) | 1.23 (1.18–1.29) | 117 737 (2.37) | 1.07 (1.03–1.11) |
| 6 to 10 | 125 035 (2.28) | 1.24 (1.19–1.29) | 255 636 (1.70) | 1.32 (1.28–1.37) | 218 789 (2.56) | 1.13 (1.10–1.16) |
| 11 to 15 | 23 068 (2.71) | 1.43 (1.32–1.55) | 44 380 (1.76) | 1.35 (1.25–1.45) | 44 059 (2.69) | 1.17 (1.10–1.24) |
| 16 to 20 | 63 598 (3.21) | 1.39 (1.33–1.46) | 127 075 (2.13) | 1.40 (1.35–1.46) | 119 154 (3.25) | 1.28 (1.24–1.33) |
| ≥21 | 4484 (5.11) | 1.91 (1.66–2.19) | 8724 (3.23) | 1.71 (1.51–1.93) | 9435 (4.55) | 1.61 (1.46–1.78) |
| P for trend | <0.0001 | <0.0001 | <0.0001 | <0.0001 | <0.0001 | <0.0001 |
| Cumulative exposure of Spouse smokingc, d | ||||||
| 0 | 747 852 (1.85) | 1.00 | 1 748 583 (1.24) | 1.00 | 1 230 136 (2.27) | 1.00 |
| 0.1 to 2.0 | 53 824 (2.63) | 1.35 (1.27–1.42) | 139 845 (1.71) | 1.29 (1.23–1.34) | 182 027 (2.35) | 1.06 (1.02–1.10) |
| 2.1 to 4.0 | 22 975 (3.58) | 1.52 (1.41–1.63) | 51 227 (2.17) | 1.34 (1.26–1.42) | 67 551 (3.13) | 1.23 (1.17–1.29) |
| 4.1 to 6.0 | 12 833 (4.27) | 1.55 (1.42–1.70) | 22 891 (2.75) | 1.44 (1.33–1.56) | 30 864 (3.62) | 1.24 (1.16–1.32) |
| 6.1 to 8.0 | 7380 (4.86) | 1.54 (1.38–1.72) | 10 653 (3.68) | 1.63 (1.47–1.81) | 14 287 (4.45) | 1.33 (1.23–1.44) |
| >8.0 | 15 950 (6.99) | 1.58 (1.48–1.70) | 17 412 (5.51) | 1.74 (1.62–1.87) | 20 887 (6.57) | 1.52 (1.43–1.61) |
| P for trend | <0.0001 | <0.0001 | <0.0001 | <0.0001 | <0.0001 | <0.0001 |
Group 1, Sichuan, Guangdong, Jiangxi, Ningxia, Jilin, Shanghai, Inner Mongolia, Heilongjiang, and Liaoning; Group 2, Jiangsu, Zhejiang, Qinghai, Hubei, Hebei, Shaanxi, Hunan, Fujian, Henan, Guangxi, and Beijing; Group 3, Tianjin, Anhui, Shandong, Hainan, Chongqing, Guizhou, Yunnan, Tibetan, Shanxi, Gansu, and Sinkiang; OR, odds ratio.
Adjusted for age, urban inhabitants, higher school education, body mass index, and alcohol consumption.
Couples with female active smoking were excluded from this analysis.
Pack‐marriage year were used to evaluate the cumulative exposure of Spouse smoking, calculated by multiplying the number of packs of cigarettes husband smoked per day by the number of marriage duration.
Couples with female active smoking and missing marriage duration were excluded from this analysis.
Table 8.
Sensitivity Analyses on Association of Husband's Smoking and Wife's Hypertensiona
| Exposure Measurements | Sample 1 | Sample 2 | Sample 3 | Sample 4 | ||||
|---|---|---|---|---|---|---|---|---|
| N (%) | OR (95% CI) | N (%) | OR (95% CI) | N (%) | OR (95% CI) | N (%) | OR (95% CI) | |
| Couples smoking status | ||||||||
| Neither‐smoker | 3 473 168 (1.62) | 1.00 | 1 335 623 (2.31) | 1.00 | 3 458 232 (1.70) | 1.00 | 3 443 854 (1.70) | 1.00 |
| Husband‐only | 1 376 424 (2.11) | 1.25 (1.23–1.27) | 551 304 (3.09) | 1.29 (1.27–1.31) | 1 370 226 (2.29) | 1.29 (1.27–1.31) | 1 365 940 (2.30) | 1.29 (1.27–1.31) |
| Wife‐only | 4185 (3.46) | 1.51 (1.27–1.78) | 1754 (4.90) | 1.46 (1.17–1.82) | 4039 (3.84) | 1.51 (1.27–1.78) | 4098 (3.88) | 1.54 (1.31–1.81) |
| Mixed | 10 897 (2.96) | 1.34 (1.20–1.50) | 4301 (4.58) | 1.47 (1.27–1.70) | 10 664 (3.50) | 1.50 (1.35–1.67) | 10 755 (3.62) | 1.51 (1.36–1.67) |
| Husbands' smoking amountb | ||||||||
| 0 | 3 473 168 (1.62) | 1.00 | 1 335 623 (2.31) | 1.00 | 3 458 232 (1.70) | 1.00 | 3 443 854 (1.70) | 1.00 |
| 1 to 5 | 333 303 (1.88) | 1.19 (1.16–1.23) | 119 292 (2.70) | 1.19 (1.14–1.23) | 331 230 (2.02) | 1.22 (1.19–1.25) | 330 100 (2.02) | 1.22 (1.19–1.25) |
| 6 to 10 | 599 551 (1.97) | 1.21 (1.18–1.23) | 228 662 (2.81) | 1.21 (1.18–1.25) | 596 922 (2.13) | 1.24 (1.22–1.27) | 595 040 (2.13) | 1.24 (1.22–1.27) |
| 11 to 15 | 111 531 (2.13) | 1.28 (1.23–1.34) | 43 670 (3.21) | 1.38 (1.31–1.46) | 110 980 (2.30) | 1.32 (1.27–1.37) | 110 713 (2.31) | 1.32 (1.27–1.37) |
| 16 to 20 | 309 497 (2.51) | 1.32 (1.29–1.35) | 147 041 (3.63) | 1.40 (1.36–1.45) | 308 584 (2.77) | 1.38 (1.34–1.41) | 307 627 (2.78) | 1.38 (1.35–1.41) |
| ≥21 | 22 542 (3.56) | 1.61 (1.50–1.73) | 12 639 (4.93) | 1.72 (1.58–1.87) | 22 510 (4.14) | 1.75 (1.64–1.88) | 22 460 (4.14) | 1.75 (1.64–1.88) |
| P for trend | <0.0001 | <0.0001 | <0.0001 | <0.0001 | <0.0001 | <0.0001 | <0.0001 | <0.0001 |
| Cumulative exposure of Spouse smokingc, d | ||||||||
| 0 | 3 727 962 (1.61) | 1.00 | 1 335 623 (2.31) | 1.00 | 3 712 012 (1.69) | 1.00 | 3 698 517 (1.70) | 1.00 |
| 0.1 to 2.0 | 375 889 (1.99) | 1.19 (1.16–1.22) | 255 436 (2.27) | 1.14 (1.11–1.17) | 374 125 (2.14) | 1.23 (1.20–1.26) | 373 273 (2.14) | 1.23 (1.20–1.26) |
| 2.1 to 4.0 | 141 783 (2.61) | 1.32 (1.28–1.37) | 142 067 (2.85) | 1.27 (1.23–1.31) | 141 299 (2.84) | 1.36 (1.32–1.40) | 141 036 (2.85) | 1.37 (1.32–1.41) |
| 4.1 to 6.0 | 66 551 (3.09) | 1.35 (1.29–1.41) | 66 790 (3.45) | 1.33 (1.28–1.39) | 66 395 (3.43) | 1.40 (1.34–1.47) | 66 259 (3.44) | 1.41 (1.35–1.47) |
| 6.1 to 8.0 | 32 293 (3.77) | 1.43 (1.34–1.51) | 32 466 (4.29) | 1.44 (1.36–1.52) | 32 255 (4.29) | 1.51 (1.43–1.60) | 32 197 (4.29) | 1.51 (1.43–1.60) |
| >8.0 | 54 032 (5.49) | 1.54 (1.48–1.61) | 54 523 (6.36) | 1.58 (1.52–1.64) | 54 189 (6.33) | 1.63 (1.57–1.69) | 54 030 (6.34) | 1.63 (1.57–1.69) |
| P for trend | <0.0001 | <0.0001 | <0.0001 | <0.0001 | <0.0001 | <0.0001 | <0.0001 | <0.0001 |
OR indicates odds ratio; Sample 1, self‐reported female hypertension participants are excluded; Sample 2, couples with marriage duration of less than 2 years are excluded; Sample 3, women who did not like vegetables are excluded; sample 4, vegetarian women are excluded.
ORs were adjusted by age, urban inhabitants, higher school education, body mass index, and alcohol consumption.
Couples with female active smoking were excluded from this analysis.
Pack‐marriage year were used to evaluate the cumulative exposure of spouse smoking, calculated by multiplying the number of packs of cigarettes husband smoked per day by the number of marriage duration.
Couples with female active smoking and missing marriage duration were excluded from this analysis.
Discussion
In this large cross‐sectional study incorporating over 5 million married couples in both urban and rural China, we identified that husband smoking was significantly associated with increased prevalence of hypertension among their wives, consistently in categorical, dose–response, and cumulative manners. It is noteworthy to point out that the associations persisted in the subgroup analyses by the duration of husband smoking exposure, the women's education level, alcohol consumption, and BMI categories, as well as the couples' living areas (urban/rural).
The relationship between active smoking and hypertension has been clarified in men and women,23, 24 but only a few studies explored the effect of passive smoking on hypertension. After conducting a systematic review, 13 studies were conducted to investigate the association of passive smoking with hypertension or BP.18, 19, 20, 25, 26, 27, 28, 29, 30, 31, 32, 33, 34 Among these, 4 examined the association among infants or adolescents27, 28, 29, 32 and 2 were conducted in pregnant women.26, 31 Another 7 studies conducted in general adults were limited by passive smoking assessment accuracy or small sample size, and none of them assessed the influence of husband smoking on hypertension or BP of their wives.18, 19, 20, 25, 30, 33, 34 The current study has important public health implications. Despite the fact that, in the past few years, multiple cities in China have launched smoke‐free laws in public spaces, women are still exposed to an alarming amount of tobacco smoke from passive smoking in private homes. Findings from our study highlighted the demand for more restrictions on smoking in private homes where most cigarette smoking and passive smoke exposure take place in women's daily lives. Therefore, clarifying the association between husband smoking and the hypertension of women who are planning for pregnancy is critical to provide evidence on formulating family‐based smoking intervention strategies involving both husbands and wives. This type of intervention will be effective for protecting wives from environmental tobacco smoke as well as preventing and reducing hazardous active smoking among husbands. Antismoking public education targeting smoking husbands may also have an impact on reducing harm through changing husbands' knowledge, beliefs, and attitudes about the consequences of smoking on their wives' health.
The current study was the largest study showing an increased risk of wives' hypertension with increasing exposure to husband smoking. Several studies provided inconsistent results on association of risks of having hypertension with exposure to passive smoking, which was not limited to husband smoking. The Ohasama study found that environmental tobacco smoke exposure may increase systolic BP by 4 mm Hg for morning measurement and by 3 mm Hg for evening measurement.19 Another study identified that second‐hand smoke exposure, measured by serum cotinine levels, was associated with increased systolic BP and hypertension, independently. This study also found that the multivariable adjusted OR for hypertension was 1.44 (95% CI: 1.01, 2.04) in the group with serum cotinine levels of 0.218 ng/mL, when compared with those with serum cotinine levels ≤0.025 ng/mL. However, the significant association of passive smoking with hypertension risk was only observed at higher exposure rates other than 1 to 3 times/week in a study conducted in 392 rural Chinese women.18
In dose–response analyses, women exposed to a larger husband‐smoking amount were at a higher risk of hypertension. It is noteworthy to point out that even the passive exposure of 1 to 5 cigarettes per day would significantly increase women's hypertension risk, indicated by the multivariate‐adjusted OR of 1.22 (95% CI: 1.19, 1.25). In the following analysis about the cumulative exposure, a dose–response relationship was also identified. Exposure to husband smoking increased the risk of hypertension through several mechanisms similar to active smoking, including the stimulation of the sympathetic nervous system induced by impaired baroreflex.17, 35 In addition, they were also found to be associated with elevated levels of inflammation markers and impaired endothelia function.36, 37
Findings of the current study are drawn from a cross‐sectional study in over 5 million couples, which ensured the statistical power of overall analysis and subgroup analysis. Similar findings and dose–response relationship were also observed in the nation‐specific analyses. It is interesting that although women reported no second‐hand smoking exposure, those in the husband‐only group were also at higher risk of having hypertension. We speculated that third‐hand smoking, which accumulates in smoker's fingers, hair, clothes, and rooms and persists for a long time,38 might also play a role in the development of women' hypertension. The present study differs from other studies, in that the information about wives' exposure to tobacco smoke was obtained by asking the husband participants directly, instead of the wives, improving the accuracy of the exposure measurement. In addition, analysis on the cumulative effect of husband smoking identified that the long‐term low‐dose exposure of husband smoking was also harmful. Furthermore, subgroup analyses in various ethnicities greatly improved the generalizability of the current findings to the overall population in China.
However, some limitations should be kept in mind when interpreting these study results. First, information on antihypertensive treatment or hypertension duration was not collected in the current study, and BP measurement or the hypertension history was used to define hypertension status. However, those without hypertension history are less likely to take antihypertensive medication, which minimized the likelihood of misclassification bias. Second, husband‐smoking exposure was self‐reported rather than evaluated by an objective measurement such as serum nicotine levels. Nondifferential misclassification and bias towards null association might have occurred from using our method. In addition, we did not collect information on the brand name of cigarettes, which might influence the results. Third, women might have been exposed to second‐hand smoke prior to having husbands who smoked, which was not covered in our questionnaire. However, the association of second‐hand smoke with hypertension was more obvious for those with longer marriage duration. This association has minimized the influence of past exposure before marriage. Additionally, results were not substantially changed in sensitivity analysis by exclusion of couples with marriage duration of less than 2 years. Fourth, participants in the current study are couples taking prepregnancy physical examinations and they might be healthier than the general population. This difference may introduce underestimation of the risk in our study population. Fifth, former smokers and current smokers could not be split according to our questionnaire, but former smokers were more likely to be grouped into the reference group, which might also introduce underestimation of the effect. Sixth, provincial analyzed sodium intake was used to account for the potential confounding of sodium intake on association of second‐hand smoking with BP, which is not as accurate as individual sodium intake. In addition, physical activity was not included in the questionnaire, which has limited our ability to address its influence on the association. Finally, a cross‐sectional design will introduce recall bias, and cannot draw the temporal association or causal relationship between husband smoking and wives' hypertension, thus warranting prospective studies.
To the best of our knowledge, this study is the first to assess the influence of husband smoking on prevalent hypertension in over 5 million couples. The current study has revealed significant associations between husband smoking and wives' hypertension status in both a categorical and dose–response manner. Considering the great burden of second‐hand smoking and hypertension, the current study has several implications for public health. Evidence from the current study fuels the fire for more restrictions on smoke in public venues, as well as at home, and emphasizes the importance of a family‐based intervention strategy in tobacco control and hypertension management.
Sources of Funding
This study was supported by the National Key Research and Development Program of China (grant no. 2016YFC1000300, grant no. 2016YFC1000307), National Natural Science Foundation (grant no. 81402757, grant no. 81600332), and International Science and Technology Cooperation Program of China (grant no. 2012DFB30130).
Disclosures
None.
Acknowledgments
The corresponding author has full access to data in the study and takes responsibility for data integrity and the accuracy of data analysis. Ying Yang and Fangchao Liu designed and supervised the study. Qiaomei Wang, Haiping Shen, and Donghai Yan led the data collection and laboratory testing. Ying Yang, Fangchao Liu, and Long Wang searched the literature, analyzed the data, interpreted the results, and drafted the manuscript. Qian Li and Xingyu Wang Yiping Zhang, Donghai Yan, Yuanyuan Wang, Hongguang Zhang, Zuoqi Peng, Yuan He, Jihong Xu, Jun Zhao, Ya Zhang, Yan Wang, Xiaona Xin, Dujia Liu, Tongjun Guo, and Qiaoyun Dai collected the data and Julia C. Chen revised the manuscript. Xu Ma conceived of the study and provided overall guidance and revised the manuscript. All authors contributed to the writing of the manuscript. We thank health workers and countless participants throughout 31 provinces in the NFPCP for great efforts and collaboration.
(J Am Heart Assoc. 2017;6:e004924. DOI: 10.1161/JAHA.116.004924.)
References
- 1. Poulter NR, Prabhakaran D, Caulfield M. Hypertension. Lancet. 2015;386:801–812. [DOI] [PubMed] [Google Scholar]
- 2. Lim SS, Vos T, Flaxman AD, Danaei G, Shibuya K, Adair‐Rohani H, Amann M, Anderson HR, Andrews KG, Aryee M, Atkinson C, Bacchus LJ, Bahalim AN, Balakrishnan K, Balmes J, Barker‐Collo S, Baxter A, Bell ML, Blore JD, Blyth F, Bonner C, Borges G, Bourne R, Boussinesq M, Brauer M, Brooks P, Bruce NG, Brunekreef B, Bryan‐Hancock C, Bucello C, Buchbinder R, Bull F, Burnett RT, Byers TE, Calabria B, Carapetis J, Carnahan E, Chafe Z, Charlson F, Chen H, Chen JS, Cheng AT, Child JC, Cohen A, Colson KE, Cowie BC, Darby S, Darling S, Davis A, Degenhardt L, Dentener F, Des Jarlais DC, Devries K, Dherani M, Ding EL, Dorsey ER, Driscoll T, Edmond K, Ali SE, Engell RE, Erwin PJ, Fahimi S, Falder G, Farzadfar F, Ferrari A, Finucane MM, Flaxman S, Fowkes FG, Freedman G, Freeman MK, Gakidou E, Ghosh S, Giovannucci E, Gmel G, Graham K, Grainger R, Grant B, Gunnell D, Gutierrez HR, Hall W, Hoek HW, Hogan A, Hosgood HD III, Hoy D, Hu H, Hubbell BJ, Hutchings SJ, Ibeanusi SE, Jacklyn GL, Jasrasaria R, Jonas JB, Kan H, Kanis JA, Kassebaum N, Kawakami N, Khang YH, Khatibzadeh S, Khoo JP, Kok C, Laden F, Lalloo R, Lan Q, Lathlean T, Leasher JL, Leigh J, Li Y, Lin JK, Lipshultz SE, London S, Lozano R, Lu Y, Mak J, Malekzadeh R, Mallinger L, Marcenes W, March L, Marks R, Martin R, McGale P, McGrath J, Mehta S, Mensah GA, Merriman TR, Micha R, Michaud C, Mishra V, Mohd Hanafiah K, Mokdad AA, Morawska L, Mozaffarian D, Murphy T, Naghavi M, Neal B, Nelson PK, Nolla JM, Norman R, Olives C, Omer SB, Orchard J, Osborne R, Ostro B, Page A, Pandey KD, Parry CD, Passmore E, Patra J, Pearce N, Pelizzari PM, Petzold M, Phillips MR, Pope D, Pope CA III, Powles J, Rao M, Razavi H, Rehfuess EA, Rehm JT, Ritz B, Rivara FP, Roberts T, Robinson C, Rodriguez‐Portales JA, Romieu I, Room R, Rosenfeld LC, Roy A, Rushton L, Salomon JA, Sampson U, Sanchez‐Riera L, Sanman E, Sapkota A, Seedat S, Shi P, Shield K, Shivakoti R, Singh GM, Sleet DA, Smith E, Smith KR, Stapelberg NJ, Steenland K, Stockl H, Stovner LJ, Straif K, Straney L, Thurston GD, Tran JH, Van Dingenen R, van Donkelaar A, Veerman JL, Vijayakumar L, Weintraub R, Weissman MM, White RA, Whiteford H, Wiersma ST, Wilkinson JD, Williams HC, Williams W, Wilson N, Woolf AD, Yip P, Zielinski JM, Lopez AD, Murray CJ, Ezzati M, AlMazroa MA, Memish ZA. A comparative risk assessment of burden of disease and injury attributable to 67 risk factors and risk factor clusters in 21 regions, 1990–2010: a systematic analysis for the Global Burden of Disease Study 2010. Lancet. 2012;380:2224–2260. [DOI] [PMC free article] [PubMed] [Google Scholar]
- 3. Li D, Lv J, Liu F, Liu P, Yang X, Feng Y, Chen G, Hao M. Hypertension burden and control in mainland China: analysis of nationwide data 2003–2012. Int J Cardiol. 2015;184:637–644. [DOI] [PubMed] [Google Scholar]
- 4. Ehret GB. Genome‐wide association studies: contribution of genomics to understanding blood pressure and essential hypertension. Curr Hypertens Rep. 2010;12:17–25. [DOI] [PMC free article] [PubMed] [Google Scholar]
- 5. Munroe PB, Barnes MR, Caulfield MJ. Advances in blood pressure genomics. Circ Res. 2013;112:1365–1379. [DOI] [PubMed] [Google Scholar]
- 6. Weber MA, Schiffrin EL, White WB, Mann S, Lindholm LH, Kenerson JG, Flack JM, Carter BL, Materson BJ, Ram CV, Cohen DL, Cadet JC, Jean‐Charles RR, Taler S, Kountz D, Townsend R, Chalmers J, Ramirez AJ, Bakris GL, Wang J, Schutte AE, Bisognano JD, Touyz RM, Sica D, Harrap SB. Clinical practice guidelines for the management of hypertension in the community a statement by the American Society of Hypertension and the International Society of Hypertension. J Hypertens. 2014;32:3–15. [DOI] [PubMed] [Google Scholar]
- 7. Mancia G, Fagard R, Narkiewicz K, Redon J, Zanchetti A, Bohm M, Christiaens T, Cifkova R, De Backer G, Dominiczak A, Galderisi M, Grobbee DE, Jaarsma T, Kirchhof P, Kjeldsen SE, Laurent S, Manolis AJ, Nilsson PM, Ruilope LM, Schmieder RE, Sirnes PA, Sleight P, Viigimaa M, Waeber B, Zannad F, Redon J, Dominiczak A, Narkiewicz K, Nilsson PM, Burnier M, Viigimaa M, Ambrosioni E, Caufield M, Coca A, Olsen MH, Schmieder RE, Tsioufis C, van de Borne P, Zamorano JL, Achenbach S, Baumgartner H, Bax JJ, Bueno H, Dean V, Deaton C, Erol C, Fagard R, Ferrari R, Hasdai D, Hoes AW, Kirchhof P, Knuuti J, Kolh P, Lancellotti P, Linhart A, Nihoyannopoulos P, Piepoli MF, Ponikowski P, Sirnes PA, Tamargo JL, Tendera M, Torbicki A, Wijns W, Windecker S, Clement DL, Coca A, Gillebert TC, Tendera M, Rosei EA, Ambrosioni E, Anker SD, Bauersachs J, Hitij JB, Caulfield M, De Buyzere M, De Geest S, Derumeaux GA, Erdine S, Farsang C, Funck‐Brentano C, Gerc V, Germano G, Gielen S, Haller H, Hoes AW, Jordan J, Kahan T, Komajda M, Lovic D, Mahrholdt H, Olsen MH, Ostergren J, Parati G, Perk J, Polonia J, Popescu BA, Reiner Z, Ryden L, Sirenko Y, Stanton A, Struijker‐Boudier H, Tsioufis C, van de Borne P, Vlachopoulos C, Volpe M, Wood DA. 2013 ESH/ESC guidelines for the management of arterial hypertension: the task force for the management of arterial hypertension of the European Society of Hypertension (ESH) and of the European Society of Cardiology (ESC). Eur Heart J. 2013;34:2159–2219. [DOI] [PubMed] [Google Scholar]
- 8. National Institute for Health and Clinical Excellence . Hypertension: The Clinical Management of Primary Hypertension in Adults: Update of Clinical Guidelines 18 and 34. London: National Clinical Guideline Centre; 2011. [Google Scholar]
- 9. CoCGftMoHit Community . Chinese guidelines for the management of hypertension in the community (2014 revised edition). Chin J Hypertens. 2015;23:24–43. [In Chinese] [Google Scholar]
- 10. Yang G, Wang Y, Zeng Y, Gao GF, Liang X, Zhou M, Wan X, Yu S, Jiang Y, Naghavi M, Vos T, Wang H, Lopez AD, Murray CJ. Rapid health transition in China, 1990–2010: findings from the Global Burden of Disease Study 2010. Lancet. 2013;381:1987–2015. [DOI] [PMC free article] [PubMed] [Google Scholar]
- 11. Oberg M, Jaakkola MS, Woodward A, Peruga A, Pruss‐Ustun A. Worldwide burden of disease from exposure to second‐hand smoke: a retrospective analysis of data from 192 countries. Lancet. 2011;377:139–146. [DOI] [PubMed] [Google Scholar]
- 12. Yang G, Wang Y, Wu Y, Yang J, Wan X. The road to effective tobacco control in China. Lancet. 2015;385:1019–1028. [DOI] [PubMed] [Google Scholar]
- 13. Prevention CCoDCa . Global adults tobacco survey (GATS) China 2010 country report. 2011.
- 14. Iversen B, Jacobsen BK, Lochen ML. Active and passive smoking and the risk of myocardial infarction in 24,968 men and women during 11 year of follow‐up: the Tromso Study. Eur J Epidemiol. 2013;28:659–667. [DOI] [PMC free article] [PubMed] [Google Scholar]
- 15. Whincup PH, Gilg JA, Emberson JR, Jarvis MJ, Feyerabend C, Bryant A, Walker M, Cook DG. Passive smoking and risk of coronary heart disease and stroke: prospective study with cotinine measurement. BMJ. 2004;329:200–205. [DOI] [PMC free article] [PubMed] [Google Scholar]
- 16. He Y, Lam TH, Jiang B, Wang J, Sai X, Fan L, Li X, Qin Y, Hu FB. Passive smoking and risk of peripheral arterial disease and ischemic stroke in Chinese women who never smoked. Circulation. 2008;118:1535–1540. [DOI] [PubMed] [Google Scholar]
- 17. Virdis A, Giannarelli C, Neves MF, Taddei S, Ghiadoni L. Cigarette smoking and hypertension. Curr Pharm Des. 2010;16:2518–2525. [DOI] [PubMed] [Google Scholar]
- 18. Li N, Li Z, Chen S, Yang N, Ren A, Ye R. Effects of passive smoking on hypertension in rural Chinese nonsmoking women. J Hypertens. 2015;33:2210–2214. [DOI] [PubMed] [Google Scholar]
- 19. Seki M, Inoue R, Ohkubo T, Kikuya M, Hara A, Metoki H, Hirose T, Tsubota‐Utsugi M, Asayama K, Kanno A, Obara T, Hoshi H, Totsune K, Satoh H, Imai Y. Association of environmental tobacco smoke exposure with elevated home blood pressure in Japanese women: the Ohasama study. J Hypertens. 2010;28:1814–1820. [DOI] [PubMed] [Google Scholar]
- 20. Felber Dietrich D, Schwartz J, Schindler C, Gaspoz JM, Barthelemy JC, Tschopp JM, Roche F, von Eckardstein A, Brandli O, Leuenberger P, Gold DR, Ackermann‐Liebrich U. Effects of passive smoking on heart rate variability, heart rate and blood pressure: an observational study. Int J Epidemiol. 2007;36:834–840. [DOI] [PubMed] [Google Scholar]
- 21. Zhang S, Wang Q, Shen H. Design, implementation and purposes of China national free pre‐pregnancy checkups project. Zhonghua Yi Xue Za Zhi. 2015;95:162–166. [PubMed] [Google Scholar]
- 22. Hipgrave DB, Chang S, Li X, Wu Y. Salt and sodium intake in China. JAMA. 2016;315:703–705. [DOI] [PubMed] [Google Scholar]
- 23. Groppelli A, Giorgi DM, Omboni S, Parati G, Mancia G. Persistent blood pressure increase induced by heavy smoking. J Hypertens. 1992;10:495–499. [DOI] [PubMed] [Google Scholar]
- 24. Verdecchia P, Schillaci G, Borgioni C, Ciucci A, Zampi I, Battistelli M, Gattobigio R, Sacchi N, Porcellati C. Cigarette smoking, ambulatory blood pressure and cardiac hypertrophy in essential hypertension. J Hypertens. 1995;13:1209–1215. [DOI] [PubMed] [Google Scholar]
- 25. Freire AP, Ramos D, Leite MR, Silva BS, David RM, Uzeloto JS, Pacagnelli FL, Vanderlei LC, Ramos EM. Influence of time and frequency of passive smoking exposure on mucociliary clearance and the autonomic nervous system. Respir Care. 2016;61:453–461. [DOI] [PubMed] [Google Scholar]
- 26. Krzyscin M, Dera‐Szymanowska A, Napierala M, Chuchracki M, Markwitz W, Breborowicz GH, Florek E. [Effects of active and passive smoking during pregnancy on the development of gestational hypertension and fetal hypotrophy]. Przegl Lek. 2015;72:131–135. [PubMed] [Google Scholar]
- 27. Kelishadi R, Noori A, Qorbani M, Rahimzadeh S, Djalalinia S, Shafiee G, Motlagh ME, Ardalan G, Ansari H, Asayesh H, Ahadi Z, Heshmat R. Are active and passive smoking associated with cardiometabolic risk factors in adolescents? The CASPIAN‐III Study. Paediatr Int Child Health. 2016;36:181–188. [DOI] [PubMed] [Google Scholar]
- 28. Huntington‐Moskos L, Turner‐Henson A, Rice M. Tobacco exposure, weight status, and elevated blood pressure in adolescents. J Community Health. 2014;39:653–659. [DOI] [PubMed] [Google Scholar]
- 29. Crispim PA, Peixoto Mdo R, Jardim PC. Risk factors associated with high blood pressure in two‐to five‐year‐old children. Arq Bras Cardiol. 2014;102:39–46. [DOI] [PMC free article] [PubMed] [Google Scholar]
- 30. Zhao J, He F, Hu DY, Ding RJ, Yu XJ, Wang L, Zhang P, Li XB, Guo JH, Liu WL, Li CL, Li L, Gao CY, Zhao LS, Chu YJ, Huang ZW, Wei JH, Hua SH, Liu RY, Zhuang XF. [Population characteristics and impact on heart rate variability, heart rate and blood pressure of passive smoking]. Zhonghua Xin Xue Guan Bing Za Zhi. 2013;41:422–426. [PubMed] [Google Scholar]
- 31. Engel SM, Scher E, Wallenstein S, Savitz DA, Alsaker ER, Trogstad L, Magnus P. Maternal active and passive smoking and hypertensive disorders of pregnancy: risk with trimester‐specific exposures. Epidemiology. 2013;24:379–386. [DOI] [PMC free article] [PubMed] [Google Scholar]
- 32. Seyedzadeh A, Hashemi F, Soleimani A. Relationship between blood pressure and passive smoking in elementary school children. Iran J Pediatr. 2012;22:351–356. [PMC free article] [PubMed] [Google Scholar]
- 33. Yarlioglues M, Kaya MG, Ardic I, Calapkorur B, Dogdu O, Akpek M, Ozdogru M, Kalay N, Dogan A, Ozdogru I, Oguzhan A. Acute effects of passive smoking on blood pressure and heart rate in healthy females. Blood Press Monit. 2010;15:251–256. [DOI] [PubMed] [Google Scholar]
- 34. Makris TK, Thomopoulos C, Papadopoulos DP, Bratsas A, Papazachou O, Massias S, Michalopoulou E, Tsioufis C, Stefanadis C. Association of passive smoking with masked hypertension in clinically normotensive nonsmokers. Am J Hypertens. 2009;22:853–859. [DOI] [PubMed] [Google Scholar]
- 35. Grassi G, Seravalle G, Calhoun DA, Bolla GB, Giannattasio C, Marabini M, Del Bo A, Mancia G. Mechanisms responsible for sympathetic activation by cigarette smoking in humans. Circulation. 1994;90:248–253. [DOI] [PubMed] [Google Scholar]
- 36. Panagiotakos DB, Pitsavos C, Chrysohoou C, Skoumas J, Masoura C, Toutouzas P, Stefanadis C; Study A . Effect of exposure to secondhand smoke on markers of inflammation: the ATTICA study. Am J Med. 2004;116:145–150. [DOI] [PubMed] [Google Scholar]
- 37. Celermajer DS, Adams MR, Clarkson P, Robinson J, McCredie R, Donald A, Deanfield JE. Passive smoking and impaired endothelium‐dependent arterial dilatation in healthy young adults. N Engl J Med. 1996;334:150–154. [DOI] [PubMed] [Google Scholar]
- 38. Matt GE, Quintana PJ, Zakarian JM, Fortmann AL, Chatfield DA, Hoh E, Uribe AM, Hovell MF. When smokers move out and non‐smokers move in: residential thirdhand smoke pollution and exposure. Tob Control. 2011;20:e1. [DOI] [PMC free article] [PubMed] [Google Scholar]