

Abstract
Background
Modifiable lifestyle‐related factors associated with risk of abdominal aortic aneurysm (AAA) are rarely investigated with a prospective design. We aimed to study possible associations among such factors and comorbidities with mean abdominal aortic diameter (AAD) and with risk of AAA among men screened for the disease.
Methods and Results
Self‐reported lifestyle‐related exposures were assessed at baseline (January 1, 1998) among 14 249 men from the population‐based Cohort of Swedish Men, screened for AAA between 65 and 75 years of age (mean 13 years after baseline). Multivariable prediction of mean AAD was estimated with linear regression, and hazard ratios (HRs) of AAA (AAD ≥30 mm) with Cox proportional hazard regression. The AAA prevalence was 1.2% (n=168). Smoking, body mass index, and cardiovascular disease were associated with a larger mean AAD, whereas consumption of alcohol and diabetes mellitus were associated with a smaller mean AAD. The HR of AAA was increased among participants who were current smokers with ≥25 pack‐years smoked compared with never smokers (HR 15.59, 95% CI 8.96–27.15), those with a body mass index ≥25 versus <25 (HR 1.89, 95% CI, 1.22–2.93), and those with cardiovascular disease (HR 1.77, 95% CI, 1.13–2.77), and hypercholesterolemia (HR 1.59, 95% CI 1.08–2.34). Walking or bicycling for >40 minutes/day (versus almost never) was associated with lower AAA hazard (HR 0.59, 95% CI 0.36–0.97) compared with almost never walking or bicycling.
Conclusions
This prospective study confirms that modifiable lifestyle‐related factors are associated with AAD and with AAA disease.
Keywords: abdominal aortic aneurysm, cohort study, epidemiology, lifestyle, risk factor
Subject Categories: Epidemiology, Lifestyle, Risk Factors, Exercise, Obesity
Introduction
Abdominal aortic aneurysm (AAA) is a disease with high mortality rates and presents an important public health problem in most countries.1 Although much of its pathophysiology has yet to be unveiled, the origin of the disease is likely to be explained by an interaction between hereditary and environmental factors, of which male sex, advanced age, and smoking are considered to be of the most importance.2, 3 Furthermore, the disease has been observed to be positively associated with other comorbidities, most commonly those shared with other cardiovascular diseases (CVDs) such as atherosclerosis, hypertension, and hyperlipidemia.4, 5, 6, 7, 8 In contrast, diabetes mellitus seems to have an inverse association with AAA.9, 10
Associations between modifiable lifestyle‐related factors and AAA disease, however, are rarely investigated with a prospective design. Studies investigating associations with lifestyle‐related factors have, in most cases, been cross‐sectional screening studies6 or have relied on a register‐based outcome.11 Although the latter is relevant for prospectively investigating risk of clinically relevant AAA, inferences about early AAA development may be harder to draw, given the potential risk of differential outcome classification (eg, if not all participants have been radiologically examined).
Identification of modifiable factors associated with AAA disease could provide better understanding of AAA epidemiology and etiology and provide new hypotheses for studies of AAA growth rate to try to limit expansion of small screening‐detected AAAs. By identifying all men in a population‐based prospective cohort from central Sweden from 1997 who were subjects of AAA screening between 65 and 75 years of age between 2007 and 2015, we aimed to examine possible associations among modifiable lifestyle‐related factors and abdominal aortic diameter (AAD) and risk of AAA at screening. Lifestyle‐related factors considered for analysis were cigarette smoking, obesity (body mass index [BMI] and waist circumference [WC]), physical activity, diet, alcohol consumption, and history of comorbidities (diabetes mellitus, hypercholesterolemia, hypertension, and CVD).
Methods
Study Population
The Cohort of Swedish Men was established in late autumn 1997 when all men residing in Västmanland and Örebro counties in central Sweden who were born between 1918 and 1952 were invited to complete a 350‐item questionnaire regarding lifestyle‐related factors (available for reading at http://ki.se/en/imm/unit-of-nutritional-epidemiology). Of the 100 303 men invited, 48 850 (49%) responded and constituted the population for this study. The cohort represents the Swedish male population in 1997 well in terms of age distribution, educational level, BMI, and proportion of current smokers (Table S1). The study was approved by the regional ethics review board at Karolinska Institutet, Stockholm, and a completed questionnaire was considered to imply informed consent.
Assessment of Lifestyle‐Related Exposures
Smoking status was reported at baseline (never, past, or current), and daily cigarette consumption was reported at ages 15 to 20, at each decade thereafter, and at baseline. Although smoking status has not been validated specifically in this cohort, self‐reported smoking habits tend to be underreported.12
Measures of obesity (BMI and WC) were based on self‐reported weight and WC at baseline and height at age 20 years. The validity of self‐reported BMI compared with clinical measures in this cohort has been reported as high (r=0.9).13 WC has not been validated in this cohort, but correlations between self‐reported and technician‐measured WC have been reported as high in other population‐based studies (r=0.9).14
Physical activity, namely, time spent walking or bicycling, was reported for everyday transportation purposes during the previous year. The Spearman rank correlation coefficient between the questionnaire and activity records (two 7‐day records performed 6 months apart in 111 men) was 0.4 for walking or bicycling.15
Information on diet and alcohol consumption was assessed by a 96‐item food‐frequency questionnaire. Alcohol consumption was reported as baseline consumption status (never, former, or current drinker), and the average frequency of consumption of foods and alcohol during the previous year was reported by the use of 8 predefined categories ranging from never to ≥3 times per day. Commonly consumed foods, such as dairy products and bread, and amount of beer, wine, and liquor were reported using open‐ended questions. A healthy diet was defined according to a healthy diet score based on guidelines and current knowledge16 and included foods beneficial for cardiovascular health.17 Adding up to a maximal score of 25, a score of 1 was assigned for ≥1 weekly serving of all individual fruits (apples and pears, bananas, citrus fruits, and berries), vegetables (spinach, lettuce and green salad, cabbage, cauliflower, broccoli and brussels sprouts, carrots, beets, tomatoes and tomato juice, sweet peppers, green peas, and mixed vegetables), legumes, nuts, low‐fat dairy products (reduced‐fat milk, reduced‐fat cultured milk or yogurt), oatmeal, whole‐grain bread, crisp or hard bread, and fish (herring or mackerel; salmon, whitefish, or char; and cod, pollack, or fish fingers).
Energy intake was calculated with the help of food composition data from the Swedish National Food Administration.18 The questionnaire was validated for nutrients, and the Spearman correlation coefficients between estimates from the dietary questionnaire and the mean of four 24‐hour recall interviews of 248 men aged 40 to 74 years were 0.65 for macronutrients and 0.62 for micronutrients.19 Alcohol consumption was validated among 248 participants with 14 interviews (each month during 1 year on randomly chosen days) assessing 24‐hour recall of intake, and the Spearman rank correlation coefficient was 0.81.19
Information on comorbidities (ie, diabetes mellitus, hypertension, hypercholesterolemia, and CVDs [angina pectoris, myocardial infarction, ischemic stroke, heart failure, and peripheral artery disease]) were obtained by linkage to the Swedish Inpatient Register and the Swedish National Diabetes Register and supplemented with self‐reported data from the questionnaires. Educational level was self‐reported in the questionnaire.
Ascertainment of AAA
Population based screening programs for AAA were introduced in Sweden in 2006.20 In Västmanland County, screening of all men aged 65 and 75 years, except those under AAA surveillance or with a history of AAA repair, was initiated in 2007. In Örebro County, screening of 2 yearly birth cohorts of men between 65 and 70 years of age was initiated in 2009. Eligible participants were identified through the National Population Register, and examinations were performed either by an ultrasound technician or a registered nurse with specific ultrasound proficiency. Travel expenses were not reimbursed, and the fee for examination in Västmanland County was 200 Swedish krona ($25) until 2011 and 300 Swedish krona ($37.50) after 2011 and 80 Swedish krona ($10) in Örebro County. There was no information on participants in the cohort who declined participation in the screening programs. However, by excluding those from the original cohort who did not live in the study area by the end of 2008, and those aged <65 or >75 years, or with AAA diagnosis or repair prior to when screening hypothetically would have taken place, the participation rate would have been 83.3%. This corresponded to the overall participation rate of 85% that has been reported for Central Sweden.2 In Västmanland County, the maximal infrarenal AAD was measured according to the outer‐to‐outer principle. The same procedural principle was used in Örebro County until 2011, after which the leading edge–to–leading edge principle was adopted. In this study, differences in AAD depending on method used were accounted for by subtracting 2 mm from all diameters registered with the outer‐to‐outer principle prior to data analysis.21 AAA was defined as a maximum infrarenal AAD ≥30 mm. Prevalent AAA at baseline was identified in the Swedish Inpatient Register22 and the Swedish Registry for Vascular Surgery (Swedvasc).23
Statistical Analysis
Of the 48 850 eligible men, 14 350 men were screened for AAA during follow‐up between 65 and 75 years of age, of which those with prevalent AAA at baseline (n=1) and those with implausible energy intake (±3 SD of the mean log‐transformed energy, n=100) were excluded (Figure S1).
Possible predictors of mean AAD at time of screening were investigated in a multivariable linear regression model adjusted for age at screening as a continuous variable after excluding those for whom the AAD was registered only as “<25 mm” (n=5706).
Hazard ratios of AAA among all screened participants were investigated utilizing Cox proportional hazards regression models with attained age as time scale. Follow‐up time could be accrued from January 1, 1998, until date of screening. Scaled Schoenfeld residuals were regressed against survival time to evaluate the assumption of proportional hazards; no violation of such assumption could be observed. We also considered a binomial logistic regression model additionally adjusted for age at screening for this analysis; however, results from such a model were similar with the Cox proportional hazards regression model.
Missing data were accounted for using chained iterations of multiple imputed data sets (n=40).24 The proportion of missing data for each variable of interest is reported in the footnote of Table 1 (6.7% had missing values for >1 variables). Results, however, did not change in complete case analyses or when missing values were added as indicator variables. Variables included for multivariable analyses were education (primary school, high school/university), smoking (never, former with <15 or ≥15 pack‐years smoked, current with <25 or ≥25 pack‐years smoked), BMI (<25 or ≥25), WC (<94 or ≥94 cm), physical activity (walking or bicycling: almost never, <20, 20–40, or >40 minutes/day), healthy diet score (approximate tertiles: ≤8, 9–12, ≥13]), alcohol consumption (never/former drinker or current drinker consuming <1 or ≥1 standard glass per day [12 g of ethanol; ie, 15 cL (5 oz) of wine, 8 cL (2.7 oz) of strong wine, 66 cL (22 oz) of class I beer (<2.25%), 50 cL (17 oz) of class II beer (2.25–3.5%), 33 cL (11 oz) of class III beer (≥3.5%), or 4 cL (1.35 oz) of liquor]), and total daily energy intake (continuous variable). Comorbidities (diabetes mellitus, hypertension, hypercholesterolemia, and CVDs) were modeled as binary variables. In analyses of quantitative covariates (eg, pack‐years smoked), smoking status was added as a categorical covariate (never, former, or current smoker).
Table 1.
Baseline Characteristics
| Aortic Diameter | ||
|---|---|---|
| No AAA (<30 mm) | AAA (≥30 mm) | |
| No. of participants | 14 081 | 168 |
| Age at baseline, y (SD) | 55.3 (4.2) | 56.7 (4.3) |
| High school/university, % | 70.6 | 67.2 |
| Current smokers, % | 21.8 | 64.9 |
| Pack‐years of smoking | 19.2 | 28.3 |
| Body mass index, kg/m2 | 25.9 | 26.9 |
| Waist circumference, cm | 95.5 | 97.3 |
| Walking/bicycling >40 min/day, % | 25.5 | 18.2 |
| Healthy diet score | 10.4 | 9.8 |
| Energy intake, kcal/day | 2779 | 2702 |
| Alcohol consumption, g/day | 16.2 | 14.9 |
| Comorbidities, % | ||
| Diabetes mellitus | 4.6 | 6.3 |
| Cardiovascular disease | 4.7 | 17.0 |
| Hypertension | 17.8 | 26.4 |
| Hypercholesterolemia | 15.0 | 25.6 |
Values are means unless otherwise indicated. All values (except age) were age‐standardized according to the distribution of age at baseline in five 5‐year categories. The proportion of missing data for each variable was education, 0.2%; smoking status and pack‐years smoked, 3.6%; body mass index, 3.3%; waist circumference 18.9%; physical activity, 9.5%; healthy diet score, 2.9%; and alcohol consumption, 1.0% (if not indicated, no data were missing). AAA indicates abdominal aortic aneurysm.
Nonlinearity was tested by modeling quantitative exposures using restricted cubic splines with 3 knots at fixed percentiles (10th, 50th, and 90th) of the distribution in the study population, and P values were obtained by investigating whether the coefficient of the second spline transformation was equal to zero.25
The Wald test was applied to test statistical significance of a possible interaction between lifestyle‐related exposures and diabetes mellitus, CVDs, and hypertension. Because diabetes mellitus and hypertension may serve as intermediary factors, sensitivity analyses were performed by not including diabetes mellitus or hypertension as covariates, by excluding participants with diabetes mellitus or hypertension at baseline, and by censoring follow‐up at time of diagnosis for those who developed these diseases during the study. To account for a potential interobserver variability of AAD measurements, we performed additional analyses using an AAD ≥35 mm as a binary outcome. Data analysis was performed with Stata 13.1 (StataCorp). Two‐sided P<0.05 was considered statistically significant.
Results
Among the 14 249 men included in this study, the sample mean AAD was 17.2 mm (SD 4.3 mm), and 168 men had an AAA (1.18%, 95% CI 1.01–1.37%). Mean age at baseline (January 1, 1998) was 55.3 years, and mean follow‐up to screening was 13.0 years.
Baseline characteristics according to AAD at time of screening are presented in Table 1. Compared with those without AAA, participants with the disease seemed to be more likely to be current smokers, to have higher BMI and larger WC, and to have comorbid diseases and less likely to be physically active and to have healthy dietary consumption and a higher educational level.
Associations Between Lifestyle and AAD
Possible associations between AAD and lifestyle‐related predictors were investigated in a linear regression model (Table 2). Smoking, increased BMI, and CVD were associated with an increase in mean AAD. Consumption of ≥1 glass of alcohol per day (median 1.7), compared with <1 glass per day (median 0.5), and diabetes mellitus were associated with 0.22 and 0.64‐mm smaller mean AADs, respectively. In a continuous model, there was no formal evidence of nonlinearity in the associations between pack‐years smoked (P nonlinearity=0.061) or BMI (P nonlinearity=0.21), and mean AAD. Every 5 pack‐years smoked (Figure 1A) and every 1‐value increment in BMI (Figure 1B) was associated with an increase in mean AAD of 0.21 mm (95% CI 0.16–0.26 mm) and 0.11 mm (95% CI 0.06–0.16 mm), respectively.
Table 2.
Multivariable Linear Regression of AAD
| Mean Difference in AAD, mm | ||
|---|---|---|
| Age‐Adjusted Estimate (95% CI)a | Multivariable Estimate (95% CI)b | |
| Education | ||
| Primary school | 0 (Reference) | 0 (Reference) |
| High school/university | −0.21 (−0.41 to 0.00) | −0.04 (−0.25 to 0.16) |
| Smoking status (pack‐years smoked) | ||
| Never | 0 (Reference) | 0 (Reference) |
| Former (<15) | 0.07 (−0.18 to 0.32) | 0.04 (−0.21 to 0.29) |
| Former (≥15) | 0.63 (0.38–0.89) | 0.47 (0.20–0.73) |
| Current (<25) | 0.94 (0.63–1.25) | 0.93 (0.61–1.24) |
| Current (≥25) | 2.32 (2.01–2.63) | 2.24 (1.93–2.56) |
| Body mass index, kg/m2 | ||
| ≥25 vs <25 | 0.80 (0.61–0.99) | 0.63 (0.39–0.86) |
| Waist circumference, cm | ||
| ≥94 vs <94 | 0.59 (0.38–0.79) | 0.21 (−0.04 to 0.46) |
| Walking/bicycling | ||
| Almost never | 0 (Reference) | 0 (Reference) |
| <20 min/day | −0.17 (−0.49 to 0.16) | −0.03 (−0.35 to 0.30) |
| 20–40 min/day | −0.34 (−0.66 to −0.03) | −0.07 (−0.39 to 0.24) |
| ≥40 min/day | −0.34 (−0.66 to −0.01) | −0.07 (−0.39 to 0.25) |
| Healthy diet score | ||
| <9 | 0 (Reference) | 0 (Reference) |
| 9–12 | −0.32 (−0.55 to −0.10) | −0.19 (−0.41 to 0.03) |
| >12 | −0.24 (−0.48 to −0.00) | −0.08 (−0.32 to 0.17) |
| Alcohol consumption | ||
| Never/former drinkerc | ··· | ··· |
| <1 glass/day | 0 (Reference) | 0 (Reference) |
| ≥1 glass/day | −0.04 (−0.23 to 0.15) | −0.22 (−0.41 to −0.03) |
| Comorbidities, yes vs no | ||
| Diabetes mellitus | −0.38 (−0.82 to 0.06) | −0.64 (−1.08 to −0.20) |
| Cardiovascular disease | 1.05 (0.64–1.46) | 0.83 (0.41–1.25) |
| Hypertension | 0.42 (0.18–0.66) | 0.23 (−0.02 to 0.49) |
| Hypercholesterolemia | 0.36 (0.10–0.62) | 0.12 (−0.15 to 0.38) |
Modeling was based on multiply imputed data sets (n=40). AAD indicates abdominal aortic diameter.
Adjusted for age at screening as a continuous variable.
Additional adjustments for total energy intake (continuously) and with all variables in the table simultaneously included in the model.
Estimate of never/former drinkers not interpreted due to the low number of cases in this group (n=5).
Figure 1.
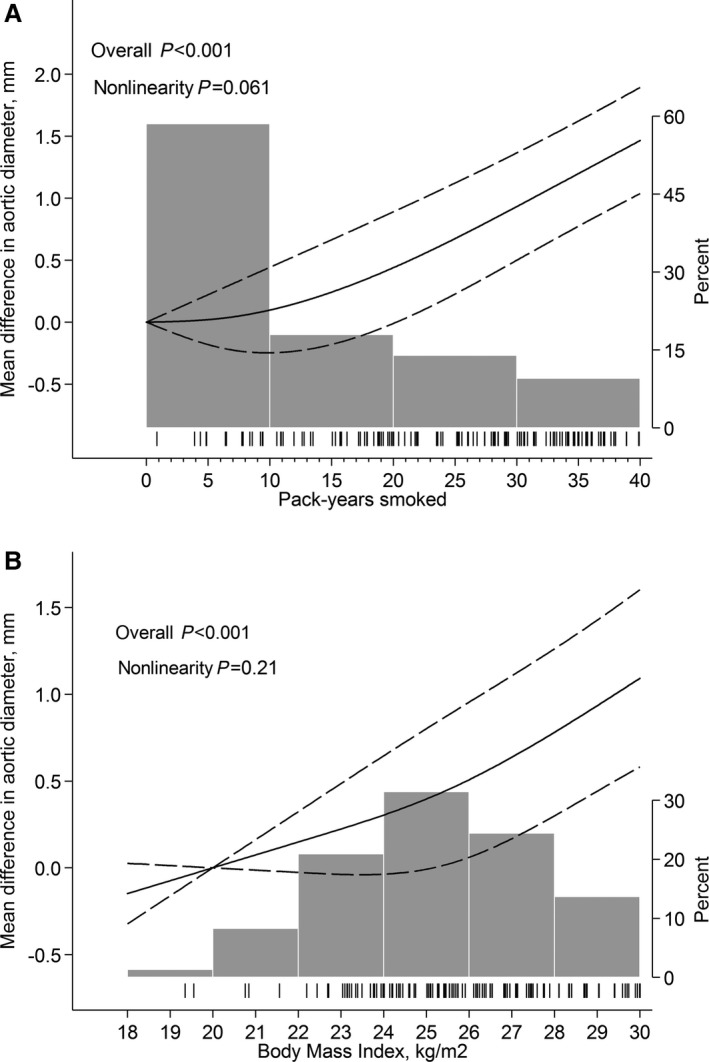
Predicted mean difference in abdominal aortic diameter by (A) pack‐years smoked and (B) body mass index. Fitted with restricted cubic splines with 3 knots of the exposure distribution and modeled with multivariable linear regression according to Table 2. Dashed lines represent 95% confidence limits. Tick marks represent distribution of cases, and histograms represent distribution of exposure.
Associations Between Lifestyle and AAA
Associations between lifestyle‐related factors and AAA hazard are presented in Table 3. The hazard was increased among smokers, those with higher BMI, and those with CVDs or hypercholesterolemia. Walking or bicycling >40 minutes/day was associated with a 41% lower AAA hazard compared with almost never walking or bicycling. There was evidence of a nonlinear association between AAA hazard and pack‐years smoked (P nonlinearity=0.003), whereas no such evidence was observed for BMI (P nonlinearity=0.92). Every 5 pack‐years smoked was associated with a 50% (95% CI 22–85%) increase in AAA hazard up to ≈20 pack‐years smoked, after which no further increase in hazard was observed (Figure 2A). Each increment in BMI value was associated with a 9% (95% CI 2–17%) increase in AAA hazard (Figure 2B). There was no evidence of interaction between diabetes mellitus, CVD, or hypertension and mean AAD or AAA hazard. Exclusion of diabetes mellitus and/or hypertension at baseline or as covariates, and of participants with the diseases and censoring of follow‐up time at date of diagnosis for those who developed those comorbidities during follow‐up, did not change the observed associations. In addition, results did not change appreciably when an AAD ≥35 mm was used as an outcome.
Table 3.
Multivariable Hazard Ratios of AAA
| Hazard Ratios of AAA (≥30 mm) | |||
|---|---|---|---|
| Cases/Person‐Yearsa | Univariable Model (95% CI) | Multivariable Model (95% CI)b | |
| Education | |||
| Primary school | 57/52 966 | 1.00 (Reference) | 1.00 (Reference) |
| High school/university | 111/132 232 | 1.11 (0.80–1.52) | 1.20 (0.87–1.66) |
| Smoking status (pack‐years smoked) | |||
| Never | 16/69 706 | 1.00 (Reference) | 1.00 (Reference) |
| Former (<15) | 15/37 306 | 1.98 (0.98–4.00) | 1.87 (0.92–3.78) |
| Former (≥15) | 39/31 798 | 4.76 (2.66–8.50) | 3.88 (2.15–7.00) |
| Current (<25) | 27/21 045 | 7.25 (3.91–13.44) | 7.13 (3.83–13.26) |
| Current (≥25) | 68/19 080 | 17.24 (10.00–29.71) | 15.59 (8.96–27.15) |
| Body mass index, kg/m2 | |||
| ≥25 vs <25 | 117/103 360 | 1.97 (1.38–2.81) | 1.89 (1.22–2.93) |
| Waist circumference, cm | |||
| ≥94 vs <94 | 79/84 721 | 1.40 (0.98–2.00) | 0.94 (0.61–1.44) |
| Walking/bicycling | |||
| Almost never | 31/21 681 | 1.00 (Reference) | 1.00 (Reference) |
| <20 min/day | 46/46 064 | 0.68 (0.43–1.07) | 0.83 (0.53–1.32) |
| 20–40 min/day | 45/52 674 | 0.53 (0.34–0.84) | 0.72 (0.45–1.16) |
| ≥40 min/day | 34/46 515 | 0.39 (0.24–0.63) | 0.59 (0.36–0.97) |
| Healthy diet score | |||
| <9 | 63/56 931 | 1.00 (Reference) | 1.00 (Reference) |
| 9–12 | 59/70 097 | 0.76 (0.53–1.08) | 0.94 (0.65–1.35) |
| >12 | 43/53 202 | 0.68 (0.46–1.01) | 0.94 (0.62–1.43) |
| Alcohol consumption | |||
| Never/former drinkerc | 5/9874 | ··· | ··· |
| <1 glass/day | 84/87 338 | 1.00 (Reference) | 1.00 (Reference) |
| ≥1 glass/day | 77/86 532 | 1.11 (0.81–1.52) | 0.91 (0.66–1.24) |
| Comorbidities, yes vs no | |||
| Diabetes mellitus | 8/8320 | 0.70 (0.34–1.43) | 0.52 (0.25–1.09) |
| Cardiovascular disease | 30/8591 | 2.46 (1.65–3.66) | 1.77 (1.13–2.77) |
| Hypertension | 45/32 614 | 1.33 (0.94–1.87) | 1.15 (0.79–1.66) |
| Hypercholesterolemia | 46/27 873 | 1.95 (1.39–2.73) | 1.59 (1.08–2.34) |
Modeling was based on multiply imputed data sets (n=40) with attained age as time scale. AAA indicates abdominal aortic aneurysm.
Reported numbers was based on complete set data and do not add up due to missing data.
Additional adjustments for total energy intake (continuously) and with all variables in the table simultaneously included in the model.
Estimate of never/former drinkers not interpreted due to the low number of cases in this group (n=5).
Figure 2.
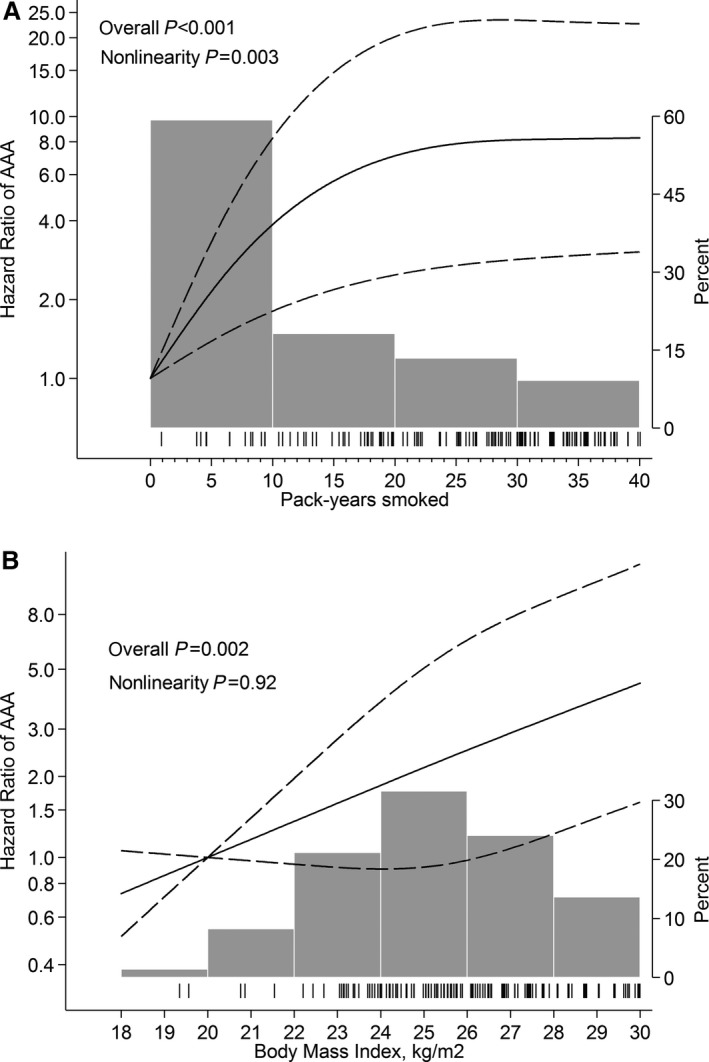
Hazard ratios of abdominal aortic aneurysm (AAA) by (A) pack‐years smoked and (B) body mass index. Fitted with restricted cubic splines with 3 knots of the exposure distribution and modeled with multivariable Cox proportional hazards regression according to Table 3. Dashed lines represent 95% confidence limits. Tick marks represent distribution of cases, and histograms represent distribution of exposure.
Discussion
In this study, we observed that smoking, obesity, and CVD were associated with increased mean AAD and with increased risk of AAA disease. Moderate consumption of alcohol and diabetes mellitus were associated with smaller AAD, whereas increasing levels of physical activity were associated with a decreased risk of AAA disease. A healthy diet in general was not associated with AAD or with risk of AAA. This study is one of a few investigating prospective associations between lifestyle‐related exposures and risk of AAA disease verified with ultrasound screening. It is likely that patients diagnosed with AAA will benefit from lifestyle advice, even though the current study did not assess associations with AAA growth rate. Smoking, obesity, and comorbidity, for example, have been associated with more peri‐ and postoperative complications of AAA repair.26 A moderate consumption of alcohol,27 a healthy diet,17 and physical activity28 have been associated with a decreased risk of other CVDs that increase risk of the most common nontechnical complications after AAA repair.29 Thus, even if a change in lifestyle does not decrease the aneurysm growth rate in small AAAs per se, patients with small AAAs are likely to do better when their AAA eventually needs to be repaired.
Comparison With Previous Studies
Results are consistent with previous prospective studies investigating AAA verified with ultrasound screening as an outcome.7, 8 In the Tromsø study, it was observed that the odds of AAA were almost 14‐fold increased among current smokers who smoked ≥20 cigarettes per day compared with never smokers.8 In the Atherosclerosis Risk in Community study, the odds of AAA were >3‐fold increased among those in the highest tertile of total cholesterol levels compared with the lowest tertile.7 None of those studies prospectively investigated associations with mean AAD or other exposures related to lifestyle. Furthermore, cross‐sectional screening studies have previously reported an increased risk of AAA among those with coronary artery disease and hypercholesterolemia and a decreased risk among physically active participants.5, 6
Whether obesity is associated with AAA is debated, and some studies have tried to differentiate whether a predominant disposition of abdominal fat, rather than general obesity, is of interest regarding risk of AAA development.5, 30 In the current study, BMI, but not WC, was associated with a larger mean AAD and with risk of AAA. In contrast, the opposite was observed for risk of AAA diagnosis and/or repair in a previous study performed by the same investigators.30 A possible explanation for this disparity is that different factors may have different effects depending on the average size of the AAAs studied. Because surgical repair is generally not indicated until the AAA reaches 55 mm,31 it is likely that cases identified in register‐based studies have a larger mean AAD compared with cases identified in screening studies, in which the majority of AAAs are small (in the current study, 70% were <40 mm and only 10% were ≥55 mm).2, 5, 32 In the Aneurysm Detection and Management study, Lederle et al observed that WC was positively associated with large AAAs (≥40 mm),5 whereas BMI, but not WC, was associated with a larger mean AAD overall.33 Unfortunately, insufficient statistical power limited the possibility of performing similar analyses with AAAs ≥40 mm as an outcome in the current study.
It is possible that a register‐based outcome might actually support study of risk of AAA in its later stages, whereas AAAs verified with ultrasound might support study of the disease earlier in its progression. In the current study, the same theory might explain why physical activity and hypercholesterolemia were associated with risk of AAA but not with mean AAD and why a healthy diet was not associated with AAA risk, even though previous studies have observed a nonhealthy diet to be associated with AAA risk.6 An inverse association between fruit consumption and risk of AAA diagnosis and/or repair have also been reported previously, an association that seemed to be more pronounced for ruptured than intact AAAs.11 It is also possible, however, that only certain foods are capable of decreasing AAA risk and that a healthy diet in general has little or no effect, as suggested previously by Jamrozik et al.34
Strengths and Limitations
The strengths of this study involve the large population‐based sample, the detailed information on prospectively collected lifestyle‐related factors (with most of the exposures validated), and verification of AAD with ultrasound in all participants. There was no change of observed results when limiting analyses to participants free from diabetes mellitus or hypertension at baseline and during follow‐up.
Nevertheless, some limitations deserve attention. Self‐administered exposure data are likely to be associated with some degree of misclassification and may have changed during follow‐up. Owing to the prospective design, however, such misclassification is most likely nondifferential with respect to AAA screening participation and AAD at time of screening.
The AAA prevalence of 1.2% in this cohort was lower than the 1.7%2 and 2.4%35 previously estimated among men aged 65 and 70 year, respectively, in nearby areas of Sweden, which could indicate that the cohort was healthier than the general population. The proportion of factors associated with an increased risk of AAA are likely to have been underestimated if healthy participants were more likely to attend screening. However, the proportions of educational level, BMI, and current smoking in the original and the analytical cohorts well represented the entire Swedish population in 1997 (Table S1). Furthermore, even if men in the current study had healthier lifestyles compared with nonparticipants, and thus would have been at lower risk of AAA, it is unlikely that the biological response to exposures investigated would depend on participation in the current cohort and, consequently, should not limit the generalizability of the observed findings.
Moreover, there was no baseline assessment of AAD, and thus the assumption of exposure preceding the outcome may have been ambiguous in some cases. However, not excluding those with an aneurysmatic diameter at time of exposure assessment was unlikely to have any substantial impact on the observed results, given that exposure misclassification was most likely nondifferential with respect to AAD at baseline and that the AAA prevalence at baseline was likely to be very low in this age group.5, 8 In the current study, follow‐up time was censored at age of screening, as the precise date of incident AAA was unknown. Although such misclassification most likely is nondifferential, estimates could still be driven in any direction. Results from the utilized survival analyses, however, were consistent with those obtained from a binomial logistic regression model in which accurate timing of an event was less important. Last, given the potential interobserver variability of AAD measurements,21 we performed additional analyses using ≥35 mm as an outcome, and results did not change.
Conclusions
Results of the present study, which is one of few studying prospective associations between lifestyle‐related factors and AAA detected through population‐based screening, indicate that lifestyle is associated with development of the disease. It confirms that smokers and those with comorbidities are at increased risk of the disease and adds to the evidence suggesting that obesity most likely increases and physical activity decreases risk of the disease. It remains unclear whether more general obesity or predominant abdominal adiposity is of most interest regarding AAA etiology. A healthy dietary consumption pattern was not associated with risk of having the disease at screening.
Sources of Funding
This work was supported by research grants from the Swedish Research Council/Committee for Infrastructure/Medicine (2015‐02302; K2013‐64X‐20406‐07‐3), and the Board of Research at Karolinska Institutet (Distinguished Professor Award; to Dr Wolk). The funders had no role in design and conduct of the study; the collection, management, analysis, and interpretation of the data; or the preparation, review, approval, or submission of the manuscript.
Disclosures
None.
Supporting information
Table S1. Comparison of the Original Cohort of Swedish Men (COSM) and Men in the COSM Screened for Abdominal Aortic Aneurysm Between 65 and 75 Years of Age With the Swedish Population in 1997 of Men Aged 45 to 74 Years Regarding Age Distribution, Educational Level, Body Mass Index, and Current Smoking
Figure S1. Source population, exclusions, and study population.
(J Am Heart Assoc. 2017;6:e004725 DOI: 10.1161/JAHA.116.004725.)28490522
References
- 1. Mani K, Lees T, Beiles B, Jensen LP, Venermo M, Simo G, Palombo D, Halbakken E, Troeng T, Wigger P, Bjorck M. Treatment of abdominal aortic aneurysm in nine countries 2005–2009: a vascunet report. Eur J Vasc Endovasc Surg. 2011;42:598–607. [DOI] [PubMed] [Google Scholar]
- 2. Svensjo S, Bjorck M, Gurtelschmid M, Djavani Gidlund K, Hellberg A, Wanhainen A. Low prevalence of abdominal aortic aneurysm among 65‐year‐old Swedish men indicates a change in the epidemiology of the disease. Circulation. 2011;124:1118–1123. [DOI] [PubMed] [Google Scholar]
- 3. Kuivaniemi H, Elmore JR. Opportunities in abdominal aortic aneurysm research: epidemiology, genetics, and pathophysiology. Ann Vasc Surg. 2012;26:862–870. [DOI] [PubMed] [Google Scholar]
- 4. Golledge J, Norman PE. Atherosclerosis and abdominal aortic aneurysm: cause, response, or common risk factors? Arterioscler Thromb Vasc Biol. 2010;30:1075–1077. [DOI] [PMC free article] [PubMed] [Google Scholar]
- 5. Lederle FA, Johnson GR, Wilson SE, Chute EP, Hye RJ, Makaroun MS, Barone GW, Bandyk D, Moneta GL, Makhoul RG. The aneurysm detection and management study screening program: validation cohort and final results. Aneurysm Detection and Management Veterans Affairs Cooperative Study Investigators. Arch Intern Med. 2000;160:1425–1430. [DOI] [PubMed] [Google Scholar]
- 6. Kent KC, Zwolak RM, Egorova NN, Riles TS, Manganaro A, Moskowitz AJ, Gelijns AC, Greco G. Analysis of risk factors for abdominal aortic aneurysm in a cohort of more than 3 million individuals. J Vasc Surg. 2010;52:539–548. [DOI] [PubMed] [Google Scholar]
- 7. Tang W, Yao L, Roetker NS, Alonso A, Lutsey PL, Steenson CC, Lederle FA, Hunter DW, Bengtson LG, Guan W, Missov E, Folsom AR. Lifetime risk and risk factors for abdominal aortic aneurysm in a 24‐year prospective study: the ARIC Study (Atherosclerosis Risk in Communities). Arterioscler Thromb Vasc Biol. 2016;36:2468–2477. [DOI] [PMC free article] [PubMed] [Google Scholar]
- 8. Forsdahl SH, Singh K, Solberg S, Jacobsen BK. Risk factors for abdominal aortic aneurysms: a 7‐year prospective study: the Tromso Study, 1994–2001. Circulation. 2009;119:2202–2208. [DOI] [PubMed] [Google Scholar]
- 9. Lederle FA. The strange relationship between diabetes and abdominal aortic aneurysm. Eur J Vasc Endovasc Surg. 2012;43:254–256. [DOI] [PubMed] [Google Scholar]
- 10. Sweeting MJ, Thompson SG, Brown LC, Powell JT; Collaborators R . Meta‐analysis of individual patient data to examine factors affecting growth and rupture of small abdominal aortic aneurysms. Br J Surg. 2012;99:655–665. [DOI] [PubMed] [Google Scholar]
- 11. Stackelberg O, Bjorck M, Larsson SC, Orsini N, Wolk A. Fruit and vegetable consumption with risk of abdominal aortic aneurysm. Circulation. 2013;128:795–802. [DOI] [PubMed] [Google Scholar]
- 12. Gorber SC, Schofield‐Hurwitz S, Hardt J, Levasseur G, Tremblay M. The accuracy of self‐reported smoking: a systematic review of the relationship between self‐reported and cotinine‐assessed smoking status. Nicotine Tob Res. 2009;11:12–24. [DOI] [PubMed] [Google Scholar]
- 13. Kuskowska‐Wolk A, Karlsson P, Stolt M, Rossner S. The predictive validity of body mass index based on self‐reported weight and height. Int J Obes. 1989;13:441–453. [PubMed] [Google Scholar]
- 14. Rimm EB, Stampfer MJ, Colditz GA, Chute CG, Litin LB, Willett WC. Validity of self‐reported waist and hip circumferences in men and women. Epidemiology. 1990;1:466–473. [DOI] [PubMed] [Google Scholar]
- 15. Norman A, Bellocco R, Bergstrom A, Wolk A. Validity and reproducibility of self‐reported total physical activity–differences by relative weight. Int J Obes Relat Metab Disord. 2001;25:682–688. [DOI] [PubMed] [Google Scholar]
- 16. Michels KB, Wolk A. A prospective study of variety of healthy foods and mortality in women. Int J Epidemiol. 2002;31:847–854. [DOI] [PubMed] [Google Scholar]
- 17. Lichtenstein AH, Appel LJ, Brands M, Carnethon M, Daniels S, Franch HA, Franklin B, Kris‐Etherton P, Harris WS, Howard B, Karanja N, Lefevre M, Rudel L, Sacks F, Van Horn L, Winston M, Wylie‐Rosett J. Diet and lifestyle recommendations revision 2006: a scientific statement from the American Heart Association Nutrition Committee. Circulation. 2006;114:82–96. [DOI] [PubMed] [Google Scholar]
- 18. Bergstrom L, Kylberg E, Hagman U. The food composition database KOST: the National Administration's information system for nutritive values of food. Vår Föda (Swedish). 1991;43:439–447. [Google Scholar]
- 19. Messerer M, Johansson SE, Wolk A. The validity of questionnaire‐based micronutrient intake estimates is increased by including dietary supplement use in Swedish men. J Nutr. 2004;134:1800–1805. [DOI] [PubMed] [Google Scholar]
- 20. Wanhainen A, Bjorck M. The Swedish experience of screening for abdominal aortic aneurysm. J Vasc Surg. 2011;53:1164–1165. [DOI] [PubMed] [Google Scholar]
- 21. Gurtelschmid M, Bjorck M, Wanhainen A. Comparison of three ultrasound methods of measuring the diameter of the abdominal aorta. Br J Surg. 2014;101:633–636. [DOI] [PubMed] [Google Scholar]
- 22. Ludvigsson JF, Andersson E, Ekbom A, Feychting M, Kim JL, Reuterwall C, Heurgren M, Olausson PO. External review and validation of the Swedish national inpatient register. BMC Public Health. 2011;11:450. [DOI] [PMC free article] [PubMed] [Google Scholar]
- 23. Venermo M, Lees T. International Vascunet Validation of the Swedvasc Registry. Eur J Vasc Endovasc Surg. 2015;50:802–808. [DOI] [PubMed] [Google Scholar]
- 24. White IR, Royston P, Wood AM. Multiple imputation using chained equations: issues and guidance for practice. Stat Med. 2011;30:377–399. [DOI] [PubMed] [Google Scholar]
- 25. Orsini N, Greenland S. A procedure to tabulate and plot results after flexible modeling of a quantitative covariate. Stata J. 2011;11:1–29. [Google Scholar]
- 26. Giles KA, Wyers MC, Pomposelli FB, Hamdan AD, Ching YA, Schermerhorn ML. The impact of body mass index on perioperative outcomes of open and endovascular abdominal aortic aneurysm repair from the National Surgical Quality Improvement Program, 2005–2007. J Vasc Surg. 2010;52:1471–1477. [DOI] [PMC free article] [PubMed] [Google Scholar]
- 27. Mukamal KJ, Jensen MK, Gronbaek M, Stampfer MJ, Manson JE, Pischon T, Rimm EB. Drinking frequency, mediating biomarkers, and risk of myocardial infarction in women and men. Circulation. 2005;112:1406–1413. [DOI] [PubMed] [Google Scholar]
- 28. Sattelmair J, Pertman J, Ding EL, Kohl HW III, Haskell W, Lee IM. Dose response between physical activity and risk of coronary heart disease: a meta‐analysis. Circulation. 2011;124:789–795. [DOI] [PMC free article] [PubMed] [Google Scholar]
- 29. Mitchell M, Rutherford R, Krupski W. Infrarenal aortic aneurysms In: Rutherford RB, ed. Vascular Surgery. Philadelphia: WB Saunders; 1995:1032. [Google Scholar]
- 30. Stackelberg O, Bjorck M, Sadr‐Azodi O, Larsson SC, Orsini N, Wolk A. Obesity and abdominal aortic aneurysm. Br J Surg. 2013;100:360–366. [DOI] [PubMed] [Google Scholar]
- 31. Powell JT, Brown LC, Forbes JF, Fowkes FG, Greenhalgh RM, Ruckley CV, Thompson SG. Final 12‐year follow‐up of surgery versus surveillance in the UK Small Aneurysm Trial. Br J Surg. 2007;94:702–708. [DOI] [PubMed] [Google Scholar]
- 32. McCarthy RJ, Shaw E, Whyman MR, Earnshaw JJ, Poskitt KR, Heather BP. Recommendations for screening intervals for small aortic aneurysms. Br J Surg. 2003;90:821–826. [DOI] [PubMed] [Google Scholar]
- 33. Lederle FA, Johnson GR, Wilson SE, Gordon IL, Chute EP, Littooy FN, Krupski WC, Bandyk D, Barone GW, Graham LM, Hye RJ, Reinke DB. Relationship of age, gender, race, and body size to infrarenal aortic diameter. The Aneurysm Detection and Management (ADAM) Veterans Affairs Cooperative Study Investigators. J Vasc Surg. 1997;26:595–601. [DOI] [PubMed] [Google Scholar]
- 34. Jamrozik K, Spencer CA, Lawrence‐Brown MM, Norman PE. Does the Mediterranean paradox extend to abdominal aortic aneurysm? Int J Epidemiol. 2001;30:1071–1075. [DOI] [PubMed] [Google Scholar]
- 35. Svensjo S, Bjorck M, Wanhainen A. Editor's choice: five‐year outcomes in men screened for abdominal aortic aneurysm at 65 years of age: a population‐based cohort study. Eur J Vasc Endovasc Surg. 2014;47:37–44. [DOI] [PubMed] [Google Scholar]
Associated Data
This section collects any data citations, data availability statements, or supplementary materials included in this article.
Supplementary Materials
Table S1. Comparison of the Original Cohort of Swedish Men (COSM) and Men in the COSM Screened for Abdominal Aortic Aneurysm Between 65 and 75 Years of Age With the Swedish Population in 1997 of Men Aged 45 to 74 Years Regarding Age Distribution, Educational Level, Body Mass Index, and Current Smoking
Figure S1. Source population, exclusions, and study population.