

Abstract
Background
To examine whether objective sleep duration is an effect modifier of the impact of metabolic syndrome (MetS) on all‐cause and cardiovascular disease/cerebrovascular mortality.
Methods and Results
We addressed this question in the Penn State Adult Cohort, a random, general population sample of 1344 men and women (48.8±14.2 years) who were studied in the sleep laboratory and followed up for 16.6±4.2 years. MetS was defined by the presence of 3 or more of obesity (≥30 kg/m2), elevated total cholesterol (≥200 mg/dL), triglycerides (≥150 mg/dL), fasting glucose (≥100 mg/dL), and blood pressure (≥130/85 mm Hg). Polysomnographic sleep duration was classified into clinically meaningful categories. Among the 1344 participants, 22.0% of them died during the follow‐up. We tested the interaction between MetS and polysomnographic sleep duration on mortality using Cox proportional hazard models controlling for multiple potential confounders (P<0.05). The hazard ratios (95% CI) of all‐cause and cardiovascular disease/cerebrovascular mortality associated with MetS were 1.29 (0.89–1.87) and 1.49 (0.75–2.97) for individuals who slept ≥6 hours and 1.99 (1.53–2.59) and 2.10 (1.39–3.16) for individuals who slept <6 hours. Interestingly, this effect modification was primarily driven by the elevated blood pressure and glucose dysregulation components of MetS.
Conclusions
The risk of mortality associated with MetS is increased in those with short sleep duration. Short sleep in individuals with MetS may be linked to greater central autonomic and metabolic dysfunction. Future clinical trials should examine whether lengthening sleep improves the prognosis of individuals with MetS.
Keywords: epidemiology, metabolic syndrome, mortality, polysomnography, sleep, survival
Subject Categories: Metabolic Syndrome, Mortality/Survival, Epidemiology, Lifestyle, Risk Factors
Introduction
Metabolic syndrome (MetS) is the clustering of several inter‐related risk factors for cardiovascular (CVD) and cerebrovascular (CBV) disease, consisting of abdominal obesity, atherogenic dyslipidemia, insulin resistance, and high blood pressure (BP). It is estimated that around 35% to 40% of the US population has MetS.1 Its prevalence has continued to increase because of the rapid increase in obesity rates in the last decades, which promotes insulin resistance.2, 3, 4, 5 In 2006, the American Heart Association and the American Stroke Association identified MetS as the less well‐documented, but most potentially modifiable, risk factor for CVD and CBV.6, 7 For example, Rodriguez‐Colon et al7 not only showed that MetS was associated with an increased risk of incident stroke, but also that this risk increased as the number of MetS components increased and was greatest among those MetS clusters in which insulin resistance and high BP were present.7 Moreover, MetS is associated with great economic healthcare costs and increased risk of all‐cause mortality.8
Although there is a clear association between the MetS and sleep disordered breathing (SDB),9, 10, 11, 12, 13, 14 the association of sleep duration with MetS and its role in predicting mortality is still poorly understood. Sleep duration has been shown to be associated with specific cardiometabolic risk factors3, 4, 5, 15, 16, 17, 18 and mortality6, 19, 20; however, studies examining MetS have reported modest and inconsistent effects.21, 22 An important limitation of previous studies is that they relied typically on subjective measures of sleep, and thus the role of objective sleep duration was not examined and the potential confounder of SDB not controlled for. This has led to the understanding that measures of impaired sleep, such as short sleep duration, may not yet be useful in predicting adverse health outcomes, such as probability of death, in the context of the MetS. Most important, previous studies have focused on the sole, independent association of sleep duration with mortality22 and none conceptualized objective sleep duration as an effect modifier of the association of cardiometabolic risk factors, including MetS, with mortality. Support for a potential role of objective sleep duration as an effect modifier comes from previous studies in insomnia23, 24, 25, 26, 27 and its underlying mechanisms, including increased cortisol, catecholaminergic activity, and impaired heart rate variability,27, 28, 29, 30, 31, 32, 33, 34, 35, 36 which suggested that objective short sleep duration may play a role in increasing cardiometabolic morbidity and mortality. To test this novel hypothesis, we examined the effect modification of objective sleep duration on the increased risk of all‐cause and CVD/CBV mortality associated with MetS in a random, general population sample. We hypothesize that objective short sleep duration increases the impact of MetS, its components, and clusters on all‐cause and CVD/CBV mortality.
Methods
Participants
The data presented here were collected as part of the Penn State Adult Cohort, a population‐based study of sleep disorders, which used a 2‐phase protocol in order to recruit participants from various age groups.37, 38, 39 In the first phase of the study, telephone interviews were conducted with 16 583 age‐eligible men and women with response rates of 73.5% and 74.1%, respectively. In the second phase, 741 men and 1000 women were randomly selected from the first phase and studied in the sleep laboratory, with response rates of 67.8% and 65.8%, respectively. Detailed descriptions of the sampling procedure have been described elsewhere.23, 37, 38, 39 After giving a complete description of the study to the subjects, written informed consent was obtained. The study protocol study complied with the Declaration of Helsinki and was approved by the institutional review board at the Pennsylvania State University College of Medicine (Hershey, PA).
Mortality Follow‐Up
Death certificates for deceased individuals as of December 31, 2013 were retrieved from the US Centers for Disease Control and Prevention. Participants were linked by Centers for Disease Control and Prevention to death records from the National Death Index for the years 1992–2013, and vital status was determined through a rigorous process of probabilistic matching and death certificate review based on participant Social Security number, full name, date and state of birth, sex, race/ethnicity, state of residence, and marital status.40, 41 Raw files retrieved from the Centers for Disease Control and Prevention were abstracted and classified into CVD and CBV mortality data. The primary underlying cause of death was abstracted for case definition, which was classified using International Classification of Disease, Ninth Revision and Tenth Revision for deaths occurring before 1998 and deaths occurring in 1999 and beyond, respectively.42, 43, 44 CVD/CBV mortality was defined as International Classification of Disease, Ninth Revision codes 390 to 459 and International Classification of Disease, Tenth Revision codes I00 to I99.42, 43, 44 Data misclassification was avoided by following standard guidelines and algorithms.45, 46
Of the 1741 participants, a total of 1263 subjects were alive at follow‐up, 478 were deceased, and 195 died of CVD/CBV causes. Duration of follow‐up was calculated from the time of the baseline evaluation to the date of death for those deceased or to December 31, 2013 for those alive. Average follow‐up duration in the entire cohort was 16.7±4.6 years. Our primary outcomes were all‐cause and CVD/CBV mortality.
Metabolic Syndrome
As part of the physical examination during the subject's sleep laboratory visit at baseline, height (cm) and weight (kg) were measured using a calibrated scale and body mass index was calculated [body mass index=mass (kg)/(height(m)2)]. BP was measured in the evening, around 2 hours before the start of the sleep recording, using a pneumoelectric microprocessor‐controlled instrument with the appropriate‐sized cuffs.23, 39 The accuracy of this monitor is reported to be ±3 mm Hg; in addition, internal calibration was performed before each use, and the machine was checked against a mercury sphygmomanometer at least annually. Recorded BP was the average of 3 consecutive readings during a 5‐minute period following 10 minutes of rest in the supine position. Fasting glucose, triglycerides, and total cholesterol levels were assayed from blood drawn after the subjects’ sleep laboratory study. In the present study, MetS was defined using National Heart, Lung, and Blood Institute/American Heart Association modified criteria1, 47, 48 as the presence of 3 or more of the following components: (1) obesity, defined as a body mass index ≥30 kg/m2 8, 49 (2) hypercholesterolemia, defined as fasting total cholesterol levels ≥200 mg/dL50; (3) hypertriglyceridemia, defined as fasting triglycerides levels ≥150 mg/dL1; (4) glucose dysregulation, defined as fasting glucose levels ≥100 mg/dL or receiving treatment for diabetes mellitus1; and (5) elevated BP, defined as a systolic BP ≥130 mm Hg or a diastolic BP ≥85 mm Hg or on antihypertensive medication.1
Our primary exposure was MetS defined by the presence of 3 or more of the cardiometabolic components listed above, as compared to individuals without MetS (ie, 2 or less cardiometabolic components). Our secondary exposures were the MetS clusters resulting from the combination of at least 3 of the cardiometabolic components listed above and each of the components examined individually.
Sleep Laboratory Evaluation
All subjects were evaluated for 1 night in the sleep laboratory in sound‐attenuated, light‐ and temperature‐controlled rooms. During this evaluation, each subject was continuously monitored for 8 hours (fixed‐time period) using 16‐channel polysomnography (PSG), including electroencephalogram, electrooculogram, and electromyogram. Bedtimes were adjusted to conform to subjects’ usual bedtimes, and subjects were recorded between 10:00 pm and 11: 00 pm and 6:00 am and 7:00 am. Sleep recordings were subsequently scored independently, according to standard criteria.51 Respiration was monitored throughout the night by use of thermocouples at the nose and mouth and thoracic strain gauges. All‐night recordings of hemoglobin oxygen saturation were obtained with an oximeter attached to the finger. In this study, the presence of SDB was defined as an apnea/hypopnea index ≥5.37, 38 Of the 8 hours of sleep recording (ie, time in bed), total sleep time was defined as the sum of time spent in stages 1, 2, 3, 4, or rapid eye movement sleep since sleep onset until sleep offset or lights on, whichever occurred first. According to the distribution of PSG‐measured total sleep time, we categorized the entire study sample into 2 groups: ≥50th percentile (ie, ≥6 hours) and <50th percentile (ie, <6 hours). This cutoff of <6 hours of sleep has previously shown to be associated with significant cardiometabolic morbidity and mortality.18, 19, 20, 23, 25, 26, 27
Other Measurements
All subjects completed a standardized questionnaire to assess the presence of sleep disorders, physical health conditions, mental health problems, and substance use. Baseline information regarding the subject's history of sleep difficulty (ie, poor sleep defined as a moderate‐to‐severe complaint of difficulty falling asleep, difficulty staying asleep, early final awakening, or unrefreshing sleep and insomnia defined as a complaint of insomnia with a duration of at least 1 year),23, 27, 39 heart disease, stroke, and depression, including a history of suicidal thoughts or attempts, were also obtained.39 Participants’ daily consumption of caffeine (number of cups/day), tobacco (number of cigarettes/day), and alcohol (number of drinks/day) as well as demographic characteristics, including age, sex, and race/ethnicity, were also obtained.
Statistical Analyses
Among the 1741 participants in this cohort, 397 had missing data on cholesterol and/or triglycerides measures; therefore, the effective sample size of this report was 1344 participants. The original design of this study included oversampling of specific subjects’ characteristics in order to increase precision of the risk estimates.37, 38 Because of this sampling strategy, numeric sampling weights were developed for the analysis so that the estimates could be inferred to the original target population.52, 53, 54 Commensurate with all previous studies in this cohort, we adjusted for the sampling weight in all of our statistical analyses, including those estimating the prevalence of comorbidities and risk factors and the rates of all‐cause and CVD/CBV mortality. All data are reported adjusted for sampling weight, except the observed number of cases (N) across groups.
To assess the association between each cardiometabolic component, their clustering, and the MetS with all‐cause and CVD/CBV mortality and the potential effect modification by objective sleep duration, multivariable Cox proportional hazard models were used given that the proportionality assumption was not violated. In all models, age, race, sex, smoking, alcohol use, depression, insomnia, SDB, heart disease, and stroke were treated as covariates and adjusted for in the Cox multivariable models. When examining the association of each of the MetS components (ie, obesity, hypercholesterolemia, hypertriglyceridemia, glucose dysregulation, and high BP) with mortality, all 5 components were included in the same regression model to adjust for one another as well as for the covariates mentioned above (ie, age, race, sex, smoking, alcohol use, depression, insomnia, SDB, heart disease, and stroke). Objective sleep duration was also adjusted when investigating the overall effect of each cardiometabolic component, their clustering, and the MetS on all‐cause and CVD/CBV mortality in the entire sample. To assess the potential effect modification of objective sleep duration in the association between MetS with all‐cause and CVD/CBV mortality, the significance of the interaction term between MetS and objective sleep duration was examined in Cox models. The association between MetS and mortality was then evaluated in each objective sleep duration stratum (ie, ≥6 and <6 hours). In the process of analyzing the association between MetS and CVD/CBV mortality, we observed a significant interaction between age and sleep duration; therefore, this interaction effect was controlled for in all Cox models in which CVD/CBV mortality was the end point. To further demonstrate the effect modification of objective sleep duration on the risk of all‐cause and CVD/CBV mortality associated with MetS, we projected the estimated survival function across objective sleep duration groups, in which all subgroups had identical demographic and clinical characteristics (except, obviously, sleep duration and MetS status). The projection was based on the aforementioned adjusted Cox model together with the average sample characteristics presented in Table 1. Furthermore, we examined the association of MetS clusters, based on different combinations of cardiometabolic components, with all‐cause and CVD/CBV mortality as well as its potential for effect modification by objective sleep duration. All results derived from Cox models are presented as multivariable‐adjusted hazard ratios (HRs) with their 95% CIs, adjusted for age, race, sex, smoking, alcohol use, depression, insomnia, SDB, heart disease, and stroke. As part of the statistical modeling, we tested for a potential U‐shaped relationship between objective sleep duration and mortality by including its quadratic term in the model, along with its lower ordered term; the quadratic term was not significant, and therefore a U‐shaped relationship for PSG‐measured sleep duration with mortality was not supported. A P≤0.05 was used to determine the significance for all analyses. All analyses were conducted with SAS software (version 9.4; SAS Institute Inc, Cary, NC).
Table 1.
Characteristics of the Sample
| Overall | Metabolic Syndrome | Objective Sleep Duration | |||||
|---|---|---|---|---|---|---|---|
| No | Yes | P Value | ≥6 h | <6 h | P Value | ||
| N | 1344 | 536 | 808 | 649 | 695 | ||
| Male, % | 42.2 | 37.9 | 48.9 | <0.01a | 36.7 | 49.3 | <0.01a |
| Age, y | 48.8 (14.2) | 44.9 (15.6) | 54.6 (11.6) | <0.01a | 45.5 (13.1) | 54.2 (13.5) | <0.01a |
| ≤40, % | 28.4 | 36.3 | 16.2 | <0.01a | 37.1 | 17.2 | <0.01a |
| 41 to 59, % | 57.5 | 55.8 | 60.0 | 56.9 | 58.1 | ||
| ≥60, % | 14.1 | 7.9 | 23.8 | 6.0 | 24.7 | ||
| Black race, % | 9.5 | 9.9 | 8.8 | 0.48 | 11.0 | 7.6 | 0.03a |
| White, % | 88.2 | 87.2 | 89.7 | 0.06 | 86.1 | 90.8 | 0.01a |
| Black, % | 9.5 | 9.9 | 8.8 | 11.0 | 7.6 | ||
| Hispanic, % | 0.7 | 1.0 | 0.4 | 0.9 | 0.5 | ||
| Other, % | 1.6 | 1.9 | 1.1 | 2.0 | 1.1 | ||
| BMI, kg/m2 | 27.3 (5.9) | 25.5 (5.6) | 30.0 (5.4) | <0.01a | 27.1 (6.3) | 27.6 (5.5) | <0.01a |
| Obesity, % | 23.2 | 9.2 | 44.9 | <0.01a | 22.7 | 23.9 | 0.56 |
| Cholesterol, mg/dL | 210.1 (83.8) | 193.4 (58.5) | 236.0 (92.8) | <0.01a | 204.8 (63.4) | 216.8 (98.8) | <0.01a |
| Hypercholesterolemia, % | 53.7 | 32.9 | 86.1 | <0.01a | 50.1 | 58.4 | <0.01a |
| Triglycerides, mg/dL | 153.1 (128.4) | 115.7 (112.9) | 211.2 (122.5) | <0.01a | 147.9 (145.5) | 159.9 (109.9) | 0.07 |
| Hypertriglyceridemia, % | 38.0 | 16.1 | 71.9 | <0.01a | 34.4 | 42.5 | <0.01a |
| Glucose, mg/dL | 100.0 (31.1) | 90.8 (24.1) | 114.3 (31.3) | <0.01a | 95.6 (28.4) | 105.8 (32.5) | <0.01a |
| Glucose dysregulation, % | 35.8 | 25.6 | 72.8 | <0.01a | 28.6 | 45.1 | <0.01a |
| Systolic blood pressure, mm Hg | 127.7 (17.7) | 122.1 (19.2) | 136.3 (13.8) | <0.01a | 124.9 (15.6) | 131.2 (19.0) | <0.01a |
| Diastolic blood pressure, mm Hg | 79.8 (10.0) | 77.3 (10.9) | 83.8 (8.3) | <0.01a | 79.4 (10.0) | 80.3 (9.9) | 0.09 |
| High blood pressure, % | 47.9 | 27.0 | 80.5 | <0.01a | 40.0 | 58.1 | <0.01a |
| Smoker, % | 22.4 | 23.6 | 20.4 | 0.15 | 23.6 | 20.8 | 0.19 |
| Alcohol, drink/day | 1.1 (5.8) | 0.8 (3.4) | 1.5 (6.9) | 0.03a | 1.2 (7.9) | 0.9 (2.7) | 0.35 |
| Heart disease, % | 9.1 | 6.0 | 13.7 | <0.01a | 8.8 | 9.5 | 0.62 |
| Stroke, % | 1.6 | 1.2 | 2.2 | 0.17 | 1.8 | 1.4 | 0.52 |
| Depression, % | 17.0 | 15.2 | 19.9 | 0.02a | 17.2 | 16.8 | 0.85 |
| Insomnia, % | 7.5 | 6.6 | 9.1 | 0.08 | 5.6 | 10.1 | <0.01a |
| Apnea/hypopnea index | 1.9 (6.6) | 1.0 (4.4) | 3.2 (7.6) | <0.01a | 1.1 (4.7) | 2.9 (7.8) | <0.01a |
| SDB, % | 7.6 | 6.4 | 12.1 | <0.01a | 5.3 | 13.0 | <0.01a |
| Objective sleep duration, h | 5.9 (1.3) | 6.1 (1.5) | 5.6 (1.1) | <0.01a | 6.8 (0.5) | 4.8 (0.9) | <0.01a |
| Crude all‐cause mortality, % | 22.0 | 15.1 | 32.7 | <0.01a | 13.0 | 33.6 | <0.01a |
Data are presented as mean (SD) and proportions for continuous and categorical variables, respectively. t test and chi‐square were used, as appropriate, to calculate the P values. All data adjusted by sampling weight, except number of cases (N) across groups. Obesity=body mass index ≥30 m2/kg. Hypercholesterolemia=elevated total cholesterol levels (≥200 mg/dL). Hypertriglyceridemia=elevated triglycerides levels (≥150 mg/dL). Glucose dysregulation=elevated fasting glucose levels (≥100 mg/dL) or treatment for diabetes mellitus. High blood pressure=elevated blood pressure levels (≥130/85 mm Hg) or antihypertensive treatment. BMI indicates body mass index; SDB, sleep disordered breathing (apnea/hypopnea index ≥5 events per hour of sleep).
P<0.05.
Results
The demographic characteristics of the study population are presented in Table 1. The mean (SD) age was 48.8 (14.2) years, 57.8% were women and 9.5% black, with an overall mortality rate of 22.0%. The prevalence of MetS was 39.2%. Overall, those with MetS showed a significantly higher crude mortality rate than those without MetS (32.7% versus 15.1%; P<0.01). Mean (SD) objective sleep duration for the entire sample was 5.9 (1.3) hours. On average, participants with MetS slept half an hour less than those without MetS. Objective short sleep duration was associated with all 5 cardiometabolic components (all P<0.05).
The association of each cardiometabolic component with all‐cause and CVD/CBV mortality, while controlling for confounding variables, is shown in Table 2. The multivariable‐adjusted risk of all‐cause mortality associated with elevated fasting glucose (HR=1.38; 95% CI=1.10–1.76) and elevated BP (HR=1.43, 95% CI=1.12–1.84) were statistically significant. The association of the number of cardiometabolic components with all‐cause mortality reached significance when at least 3 components were present (HR=1.75; 95% CI=1.18–2.61), with graded increase in effect size for subjects with 4 or 5 cardiometabolic components (HR=1.79; 95% CI=1.01–3.20 and HR=2.24; 95% CI=1.32–3.79, respectively). The pattern for these cardiometabolic components and their clustering was similar for CVD/CBV mortality despite decreased statistical power (the HRs [95% CI] for 3, 4, and 5 components were 1.27 [0.66–2.42], 1.51 [0.78–2.94], and 1.78 [0.74–4.29], respectively). In fact, as shown in Table 2, individuals with MetS showed a 2‐fold higher risk of all‐cause (HR=1.73; 95% CI=1.40–2.14) and CVD/CBV (HR=1.92; 95% CI=1.35–2.74) mortality compared with those without MetS after adjusting for all covariates (ie, age, race, sex, smoking, alcohol use, depression, insomnia, SDB, heart disease, and stroke).
Table 2.
Association of Each Cardiometabolic Component, Their Clustering, and MetS With All‐Cause and Cardiovascular/Cerebrovascular Mortality
| All‐Cause | CVD/CBV | |||
|---|---|---|---|---|
| HR (95% CI) | P Value | HR (95% CI) | P Value | |
| No. of deaths | 348 | 147 | ||
| Individual components | ||||
| Obesity | 1.15 (0.91–1.45)a | 0.25 | 1.32 (0.90–1.93)a | 0.16 |
| Hypercholesterolemia | 0.87 (0.69–1.10)a | 0.22 | 1.22 (0.86–1.70)a | 0.26 |
| Hypertriglyceridemia | 1.11 (0.89–1.38)a | 0.37 | 1.12 (0.79–1.52)a | 0.52 |
| Glucose dysregulation | 1.38 (1.10–1.76)a | <0.01b | 1.18 (0.83–1.70)a | 0.34 |
| High blood pressure | 1.43 (1.12–1.84)a | <0.01b | 1.51 (1.01–2.29)a | 0.05b |
| Cumulative no. of components | ||||
| 0 | 1.00 | 1.00 | ||
| 1 | 0.96 (0.62–1.50) | 0.87 | 0.53 (0.25–1.15) | 0.11 |
| 2 | 0.90 (0.59–1.37) | 0.59 | 0.70 (0.36–1.37) | 0.29 |
| 3 | 1.75 (1.18–2.61) | <0.01b | 1.27 (0.66–2.42) | 0.47 |
| 4 | 1.79 (1.01–3.20) | 0.05b | 1.51 (0.78–2.94) | 0.22 |
| 5 | 2.24 (1.32–3.79) | <0.01b | 1.78 (0.74–4.29) | 0.20 |
| MetS | ||||
| No (<3 components) | 1.00 | |||
| Yes (≥3 components) | 1.73 (1.40–2.14)c , d | <0.01b | 1.92 (1.35–2.74)c | <0.01b |
CBV indicates cerebrovascular; CVD, cardiovascular disease; HR, hazard ratio; MetS, metabolic syndrome; SDB, sleep disordered breathing.
Hazard ratios (95% CIs) adjusted for one another as well as for age, race, sex, smoking, alcohol use, depression, insomnia, SDB, heart disease, stroke, and objective sleep duration.
P<0.05.
Hazard ratios (95% CIs) adjusted for age, race, sex, smoking, depression, insomnia, SDB, heart disease, stroke, and objective sleep duration.
P value for MetS×objective sleep duration interaction <0.05. All data adjusted by sampling weight. Obesity=body mass index ≥30 m2/kg. Hypercholesterolemia=elevated total cholesterol levels (≥200 mg/dL). Hypertriglyceridemia=elevated triglycerides levels (≥150 mg/dL). Glucose dysregulation=elevated fasting glucose levels (≥100 mg/dL) or treatment for diabetes mellitus. High blood pressure=elevated blood pressure levels (≥130/85 mm Hg) or antihypertensive treatment.
To test whether objective sleep duration modified the association of MetS with mortality, we examined the interaction between MetS and objective sleep duration and it was statistically significant (P<0.05); therefore, the association between MetS and mortality was evaluated for each objective sleep duration stratum while adjusting for all covariates. When we examined the multivariable‐adjusted risk stratified by objective short sleep duration, we observed that the HRs of all‐cause mortality associated with MetS were 1.29 (95% CI=0.89–1.87) and 1.99 (95% CI=1.53–2.59) for subjects who slept ≥6 and <6 hours, respectively. The risk of CVD/CBV mortality associated with MetS as a function of objective short sleep duration was 1.49 (95% CI=0.75–2.97) and 2.10 (95% CI=1.39–3.16) for subjects who slept ≥6 and <6 hours, respectively. To graphically illustrate this effect modification of the association of MetS with all‐cause and CVD/CBV mortality by objective short sleep duration, we projected the survival curves in those with and without MetS across objective sleep duration groups with identical demographic (ie, 48.8 years old; 42.2% male, 9.5% black) and clinical characteristics (ie, 9.1% with a history of heart disease, 1.6% with a history of stroke, 7.6% SDB, 7.5% insomnia, 22.4% smoker, 1.1 alcoholic drinks/day, and 17.0% depression). As shown in the Figure, the survival functions for participants who slept ≥6 with and without MetS were similar (P=0.19 and 0.25, for all cause and CVD/CBV, respectively), whereas the survival functions were significantly worse in those with MetS among participants who slept <6 hours (both P<0.01).
Figure 1.
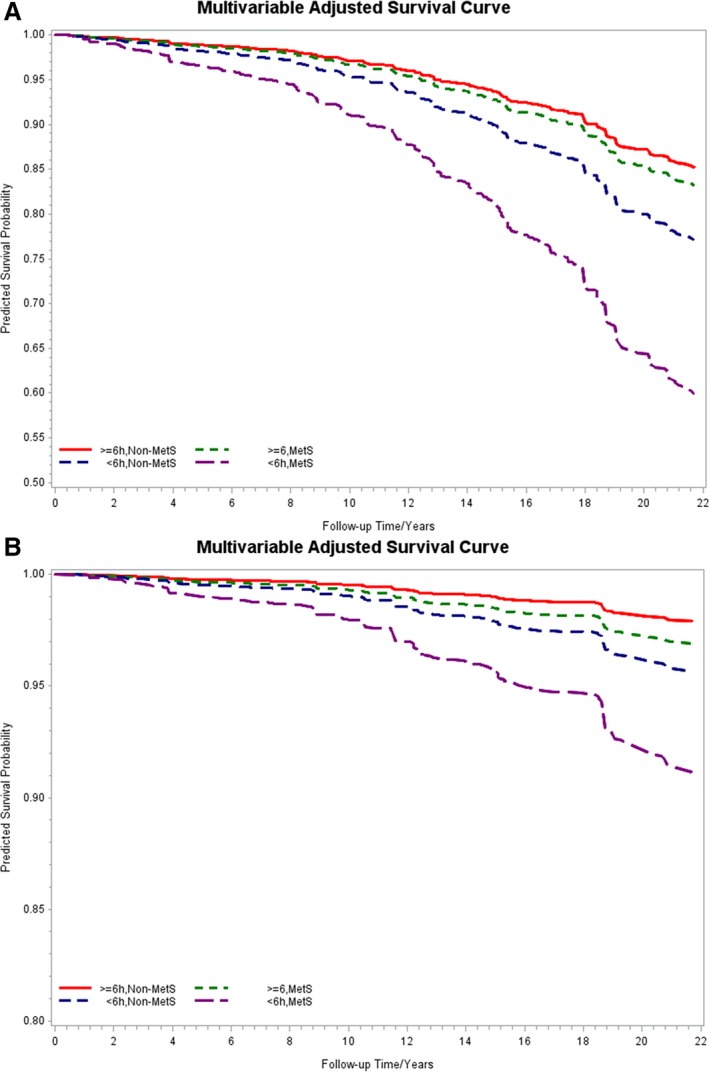
Multivariable‐adjusted survival curves associated with metabolic syndrome and objective short sleep duration. A, Survival function of all‐cause mortality over the study follow‐up period. B, Survival function of cardiovascular/cerebrovascular mortality over the study follow‐up period. Both survival functions adjusted for age, race, sex, smoking, alcohol use, depression, insomnia, SDB, heart disease, and stroke. MetS indicates metabolic syndrome; SDB, sleep disordered breathing.
Furthermore, given that not all individuals with MetS have the same cluster of cardiometabolic components, we examined the association of different MetS clusters with all‐cause and CVD/CBV mortality in the overall sample as well as stratified by objective sleep duration. Participants with MetS who only had obesity, hypercholesterolemia, and hypertriglyceridemia (n=34) were not at significant increased risk of mortality as compared to those without MetS (HR=0.40; 95% CI=0.02–6.19) and thus were merged into 1 reference group also because of the small sample size. As shown in Table 3, compared with the reference group, the risk of all‐cause mortality was significantly increased in those participants with MetS clusters of (1) elevated BP and 2 or 3 other components, but without elevated fasting glucose (HR=1.75; 95% CI=1.16–2.64), (2) elevated fasting glucose and BP with 1 or 2 other components (HR=1.46; 95% CI=0.96–2.32), and (3) with both fasting glucose and BP elevated (HR=1.76; 95% CI=1.40–2.22). We tested the interaction between the MetS clusters and objective sleep duration and it was statistically significant (P=0.01); therefore, the association between each MetS cluster and all‐cause mortality was stratified by objective sleep duration. As shown in Table 3, the strength of the association between each MetS cluster with all‐cause mortality was significantly higher in those who slept <6 hours. For example, the multivariable‐adjusted HRs of all‐cause mortality associated with the MetS cluster of elevated fasting glucose and BP with 1 or more other components were 1.50 (95% CI=0.99–2.38) and 1.93 (95% CI=1.45–2.54) for subjects who slept ≥6 and <6 hours, respectively. Of note, this risk was even stronger for CVD/CBV mortality: The risk of CVD/CBV mortality associated with MetS cluster of elevated fasting glucose and BP with 1 or more other components were 1.93 (95% CI=0.86–4.32) and 2.10 (95% CI=1.36–3.24) for subjects who slept ≥6 and <6 hours, respectively.
Table 3.
Association of MetS Clusters With All‐Cause Mortality in the Overall Sample as Well as Stratified by Objective Short Sleep Duration
| N | All‐Cause Deaths | CVD/CBV Deaths | Overall HR (95% CI) | ≥6 h HR (95% CI) | <6 h HR (95% CI) | |
|---|---|---|---|---|---|---|
| Reference | 570 | 107 | 43 | 1.00 | 1.00 | 1.00 |
| Glucose dysregulation+2 or 3 other (no high blood pressure) | 78 | 21 | 11 | 1.48 (0.96–2.31) | 0.86 (0.38–1.93) | 2.22 (1.30–3.80) |
| High blood pressure+2 or 3 other (no glucose dysregulation) | 231 | 60 | 21 | 1.75 (1.16–2.64) | 1.22 (0.63–2.38) | 2.51 (1.63–3.89) |
| Glucose dysregulation+high blood pressure+1 or more component | 465 | 160 | 72 | 1.76 (1.40–2.22) | 1.50 (0.99–2.38) | 1.93 (1.45–2.54) |
Hazard ratios (95% CIs) of all‐cause mortality adjusted for age, black race, sex, smoking, depression, alcohol use, insomnia, SDB, heart disease, and stroke; P value for MetS clusters×objective sleep duration interaction <0.05. All data adjusted by sampling weight, except number of cases (N) and deaths across groups. The reference group includes individuals without MetS and with the obesity, hypercholesterolemia, and hypertriglyceridemia cluster (please see text). Obesity=body mass index ≥30 m2/kg. Hypercholesterolemia=elevated total cholesterol levels (≥200 mg/dL). Hypertriglyceridemia=elevated triglycerides levels (≥150 mg/dL). Glucose dysregulation=elevated fasting glucose levels (≥100 mg/dL) or treatment for diabetes mellitus. High blood pressure=elevated blood pressure levels (≥130/85 mm Hg) or antihypertensive treatment. CBV indicates cerebrovascular bed; CVD, cardiovascular disease; HR, hazard ratio; MetS, metabolic syndrome; SDB, sleep disordered breathing.
Of note, the main effects of MetS on all‐cause and CVD/CBV mortality were statistically significant in the overall sample and among participants who slept <6 hours even after Bonferroni correction for multiple testing (P<0.0125), as evidenced by the P values in Table 2, the survival functions in the Figure, and 95% CI in Table 3.
Discussion
This is the first study to demonstrate that objectively measured short sleep duration modifies the increased risk of all‐cause and CVD/CBV mortality associated with MetS. This increased risk is independent of other factors frequently associated with MetS, mortality, or objective sleep duration such as age, sex, smoking, or SDB. Important, this effect modification was primarily driven by the high BP and glucose dysregulation components of MetS, which indicates that objective short sleep duration in persons with MetS may be related to the degree of central autonomic and metabolic dysfunction. Future studies should examine the pathophysiology of MetS with objective short sleep duration, whereas future clinical trials should examine whether lengthening sleep improves the prognosis of individuals with MetS.
Most previous studies have focused on examining the independent association of sleep duration, typically measured by self‐report, with cardiometabolic morbidity and mortality, and the results have been inconsistent and modest.15, 16, 17, 18, 19, 20, 55, 56, 57 In the vast majority of those studies, no PSG measures were obtained, and therefore the potential confounder of SDB was not controlled for and the role of objective short sleep duration not examined. Most important, none of the previous studies conceptualized sleep duration as an effect modifier, so that the added cardiovascular risk that it comprises and its potential mechanistic role can be ascertained. All these issues were addressed in the present study.
As expected, individuals with MetS were associated with a significant increased risk of all‐cause and CVD/CBV mortality in the present study.58 When we stratified this risk by objectively measured short sleep duration, we showed a strong and significant association of MetS with mortality. Among individuals who slept <6 hours, those with MetS were associated with an increased 2.0‐fold risk of all‐cause and CVD/CBV mortality. In contrast, among individuals who slept ≥6 hours, those with MetS were not at a significant increased risk of all‐cause and CVD/CBV mortality (1.3‐ and 1.5‐fold, respectively) compared to those without MetS. The survival functions presented in Figure pinpoint this effect modification in terms of the expected mortality rate across individuals with similar demographic (eg, age, sex, and race) and clinical characteristics (eg, prevalence of smoking, SDB, diabetes mellitus, and depression) and reveal that the survival curves for participants with and without MetS who slept ≥6 hours were not significantly different, whereas for participants who slept <6 hours there was a strong significant difference. Together, these findings indicate that (1) the impact of MetS on mortality among those who sleep ≥6 hours is negligible or, at best, modest and (2) objective short sleep duration should be considered when estimating the risk of mortality associated with MetS.
Although the MetS is a meaningful combination of individual cardiometabolic risk factors, there is heterogeneity in such combination and, thus, different MetS clusters exist. Accumulating evidence from previous studies shows that specific MetS clusters or triads confer the greatest risk of incident CVD, CVB, and mortality.7, 59, 60, 61 For example, in the Framingham Heart Study, individuals who developed MetS by first having a cluster of central obesity, high BP, and glucose dysregulation had the greatest risk of incident CVD and mortality compared with other MetS triads,61 whereas in the ARIC (Atherosclerosis Risk in Communities) study, the greatest risk of incident atherosclerotic coronary artery disease59 and ischemic stroke7 was observed in individuals with MetS clusters in which high BP or glucose dysregulation were present.7, 59 Consistently, we found in the present study that MetS clusters with increased risk of all‐cause and CVD/CBV mortality, approximately 2‐fold, were those in which high BP or glucose dysregulation combined with high BP were present. Of outmost importance, we found that this increased risk of all‐cause and CVD/CBV mortality associated with MetS clusters was significantly modified by objective short sleep duration; specifically, 2.2‐ and 2.5‐fold among those who slept <6 hours and had glucose dysregulation or high BP, respectively. In fact, when examined individually each of the cardiometabolic components, those of obesity, hypercholesterolemia, or hypertriglyceridemia did not show a significant effect modification by objective sleep duration on mortality. These novel findings have important pathophysiological and clinical implications.
That objective short sleep duration modified the risk of all‐cause and CVD/CBV mortality primarily in persons with MetS who had high BP or glucose dysregulation, but not solely central obesity or atherogenic dyslipidemia suggests that objective short sleep may be related to the degree of central autonomic and metabolic dysfunction. It is well‐known that multiple hypothalamic and brainstem nuclei and networks are shared by the autonomic and sleep/arousal‐regulating systems62; in fact, there is a tight link between sympathetic and parasympathetic activity and rapid eye movement and non–rapid eye movement sleep, respectively.62 Also, hypothalamic and brainstem networks involved in sleep/arousal regulation are also an integral part of the central regulation of short‐ and long‐term energy balance and metabolism.63 This hypothesis is consistent with recent studies showing that objective short sleep duration modifies in a similar manner not only the association of insomnia with subclinical markers,27, 28, 29, 30, 31, 32, 33, 34, 35, 36 but also cardiometabolic risk factors and mortality,23, 24, 25, 26, 27 suggesting that objective short sleep duration, rather than subjective sleep complaints, is a key factor in CVD/CBV risk.27 Thus, the results of the present study further expand the proposal that objective short sleep duration in the context of conditions associated with sympathetic activation and glucose dysregulation is a modifiable risk factor for CVD/CBV morbidity and mortality.
Overall, our findings further indicate that clinical efforts to reduce the burden of MetS in the general and clinical population should continue to target primarily the 2 MetS components of high BP and glucose dysregulation7, 59, 60 and, additionally, objective short sleep duration. Future experimental studies should examine the central and peripheral mechanisms that may differentiate patients with the MetS who sleep ≥6 hours versus those who sleep <6 hours, given the strong effect modification on mortality found in this study. Furthermore, future clinical trials should examine whether lengthening sleep improves the prognosis of individuals with the MetS.
Some limitations should be taken into account when interpreting our results. First, we had to rely on modified criteria for the definition of the MetS given that measures of waist circumference and high‐density lipoprotein‐cholesterol were not available in the Penn State Adult Cohort; however, we used body mass index ≥30 as a surrogate marker of central obesity, which is consistent with World Health Organization criteria and other previous studies,8, 49 and we used total cholesterol levels ≥200 mg/dL as a surrogate marker of atherogenic dyslipidemia based on clinical criteria.50 The validity of our definition is supported by the fact that the risk of all‐cause mortality was significantly increased when 3 or more cardiometabolic components were present, and that the prevalence of MetS in the present study (37.4%) was very similar (35–40%) to that reported in other previous large, population‐based studies in the United States,1, 7, 47 including the prevalence of its clusters, such as the one of obesity, hypercholesterolemia, and hypertriglyceridemia, which was around 2% and consistent with that reported in the ARIC study.7 Second, there were substantial missing data in cholesterol and triglycerides measures; however, the results did not significantly change in our sensitivity analyses (data not shown), in which we imputed the missing data by using a predictive mean matching method. Third, the objective sleep duration in this study was based on 1 night of PSG, which may be affected by the “first night effect”; however, we and others have recently shown that measures of sleep continuity, such as objective sleep duration based on 3 consecutive nights or 2 single‐night recordings separated by several years, are stable and reflect a person's habitual sleep under lab conditions and that a single night in the laboratory is useful for reliably classifying individuals as short sleepers.64, 65 Nevertheless, future studies should explore the association between MetS, sleep duration, and mortality using multiple night recordings. Fourth, we did not have the ability to assess the potential effect of circadian dysregulation to the associations found either by self‐reported (ie, circadian preference), objective (ie, actigraphy‐measured sleep midpoint), or physiological (ie, dim light melatonin onset) methods. Given the known circadian regulation of cardiovascular functions and metabolism,62 future studies should examine whether the increased risk of mortality associated with MetS is increased under circadian misalignment. Fifth, we examined both all‐cause and CVD/CBV mortality; however, some of the associations found for CVD/CBV mortality were compromised by the relatively small sample size (n=195) and decreased statistical power when stratifying the risk by objective short sleep duration. Nevertheless, the associations found had the expected effect sizes, which provide confidence regarding the reliability and validity of our findings. Sixth, we did not have physical activity data available in this cohort, which did not allow controlling for the potential effect of sedentary behavior in the associations found. Future studies should overcome this limitation. Finally, although the Penn State Adult Cohort is a representative random sample of central Pennsylvania, it was predominantly white (88.2%) with 9.5% blacks, 0.7% Hispanics, and 1.6% “other” ethnicities; such over‐representation as compared with the US population54 limits the generalizability of our results and did not allow us to examine how the associations found vary by race/ethnicity.
In summary, the risk of mortality associated with the MetS is significantly higher in those with objective short sleep duration. Given the high prevalence of the MetS in the general population and the need to more accurately predict its prognosis, the introduction of novel, modifiable factors should become the target of public health policy. Individuals with MetS who demonstrate objective short sleep duration may suffer from greater central autonomic and metabolic dysregulation and be at greater risk of mortality. Finally, our findings indicate that individuals with the MetS, particularly those reporting symptoms of SDB in order to rule out the condition, and those reporting symptoms of insomnia in order to quantify the degree of objective sleep duration, should undergo a sleep study.
Sources of Funding
This work was supported by the American Heart Association (14SDG19830018, PI: Fernandez‐Mendoza) and National Institutes of Health (R01 HL51931 and R01 HL40916, PI: Bixler).
Disclosures
None.
Acknowledgments
The work was performed at the Sleep Research & Treatment Center at the Penn State University Milton S. Hershey Medical Center, and the staff is especially commended for their efforts.
(J Am Heart Assoc. 2017;6:e005479 DOI: 10.1161/JAHA.117.005479.)28515112
Preliminary data from this work were presented at the American Heart Association EPI/Lifestyle Scientific Sessions, March 9, 2017, in Portland, OR.
References
- 1. Alberti KG, Eckel RH, Grundy SM, Zimmet PZ, Cleeman JI, Donato KA, Fruchart JC, James WP, Loria CM, Smith SC Jr; International Diabetes Federation Task Force on Epidemiology and Prevention; National Heart, Lung, and Blood Institute; American Heart Association; World Heart Federation; International Atherosclerosis Society; International Association for the Study of Obesity . Harmonizing the metabolic syndrome: a joint interim statement of the International Diabetes Federation Task Force on Epidemiology and Prevention; National Heart, Lung, and Blood Institute; American Heart Association; World Heart Federation; International Atherosclerosis Society; and International Association for the Study of Obesity. Circulation. 2009;120:1640–1645. [DOI] [PubMed] [Google Scholar]
- 2. Flegal KM, Carroll MD, Kuczmarski RJ, Johnson CL. Overweight and obesity in the United States: prevalence and trends, 1960–1994. Int J Obes. 1998;22:39–47. [DOI] [PubMed] [Google Scholar]
- 3. Ogden CL, Carroll MD, Kit BK, Flegal KM. Prevalence of childhood and adult obesity in the United States, 2011–2012. JAMA. 2014;311:806–814. [DOI] [PMC free article] [PubMed] [Google Scholar]
- 4. Lloyd‐Jones D, Adams RJ, Brown TM, Carnethon M, Dai S, De Simone G, Ferguson TB, Ford E, Furie K, Gillespie C, Go A, Greenlund K, Haase N, Hailpern S, Ho PM, Howard V, Kissela B, Kittner S, Lackland D, Lisabeth L, Marelli A, McDermott MM, Meigs J, Mozaffarian D, Mussolino M, Nichol G, Roger VL, Rosamond W, Sacco R, Sorlie P, Roger VL, Thom T, Wasserthiel‐Smoller S, Wong ND, Wylie‐Rosett J; American Heart Association Statistics Committee and Stroke Statistics Subcommittee . Heart disease and stroke statistics—2010 update: a report from the American Heart Association. Circulation. 2010;121:e46–e215. [DOI] [PubMed] [Google Scholar]
- 5. Silventoinen K, Sans S, Tolonen H, Monterde D, Kuulasmaa K, Kesteloot H, Tuomilehto J; WHO, MONICA Project . Trends in obesity and energy supply in the WHO MONICA Project. Int J Obes. 2004;28:710–718. [DOI] [PubMed] [Google Scholar]
- 6. Cappuccio FP, D'Elia L, Strazzullo P, Miller MA. Sleep duration and all‐cause mortality: a systematic review and meta‐analysis of prospective studies. Sleep. 2010;33:585–592. [DOI] [PMC free article] [PubMed] [Google Scholar]
- 7. Rodriguez‐Colon SM, Mo J, Duan Y, Liu J, Caulfield JE, Jin X, Liao D. Metabolic syndrome clusters and the risk of incident stroke: the Atherosclerosis Risk in Communities (ARIC) study. Stroke. 2009;40:200–205. [DOI] [PubMed] [Google Scholar]
- 8. Malik S, Wong ND, Franklin SS, Kamath TV, L'Italien GJ, Pio JR, Williams GR. Impact of the metabolic syndrome on mortality from coronary heart disease, cardiovascular disease, and all causes in United States adults. Circulation. 2004;110:1245–1250. [DOI] [PubMed] [Google Scholar]
- 9. Vgontzas AN, Bixler EO, Chrousos GP. Sleep apnea is a manifestation of the metabolic syndrome. Sleep Med Rev. 2005;9:211–224. [DOI] [PubMed] [Google Scholar]
- 10. Somers VK, White DP, Amin R, Abraham WT, Costa F, Culebras A, Daniels S, Floras JS, Hunt CE, Olson LJ, Pickering TG, Russell R, Woo M, Young T; American Heart Association Council for High Blood Pressure Research Professional Education Committee, Council on Clinical Cardiology; American Heart Association Stroke Council; American Heart Association Council on Cardiovascular Nursing; American College of Cardiology Foundation . Sleep apnea and cardiovascular disease: an American Heart Association/American College of Cardiology Foundation Scientific Statement from the American Heart Association Council for High Blood Pressure Research Professional Education Committee, Council on Clinical Cardiology, Stroke Council, and Council on Cardiovascular Nursing. In collaboration with the National Heart, Lung, and Blood Institute National Center on Sleep Disorders Research (National Institutes of Health). Circulation. 2008;118:1080–1111. [DOI] [PubMed] [Google Scholar]
- 11. Meng L, Zheng Y, Hui R. The relationship of sleep duration and insomnia to risk of hypertension incidence: a meta‐analysis of prospective cohort studies. Hypertens Res. 2013;36:985–995. [DOI] [PMC free article] [PubMed] [Google Scholar]
- 12. Pepin JL, Borel AL, Tamisier R, Baguet JP, Levy P, Dauvilliers Y. Hypertension and sleep: overview of a tight relationship. Sleep Med Rev. 2014;18:509–519. [DOI] [PubMed] [Google Scholar]
- 13. Ge X, Han F, Huang Y, Zhang Y, Yang T, Bai C, Guo X. Is obstructive sleep apnea associated with cardiovascular and all‐cause mortality? PLoS One. 2013;8:e69432. [DOI] [PMC free article] [PubMed] [Google Scholar]
- 14. Wang X, Ouyang Y, Wang Z, Zhao G, Liu L, Bi Y. Obstructive sleep apnea and risk of cardiovascular disease and all‐cause mortality: a meta‐analysis of prospective cohort studies. Int J Cardiol. 2013;169:207–214. [DOI] [PubMed] [Google Scholar]
- 15. Shan Z, Ma H, Xie M, Yan P, Guo Y, Bao W, Rong Y, Jackson CL, Hu FB, Liu L. Sleep duration and risk of type 2 diabetes: a meta‐analysis of prospective studies. Diabetes Care. 2015;38:529–537. [DOI] [PubMed] [Google Scholar]
- 16. Magee L, Hale L. Longitudinal associations between sleep duration and subsequent weight gain: a systematic review. Sleep Med Rev. 2012;16:231–241. [DOI] [PMC free article] [PubMed] [Google Scholar]
- 17. Wu Y, Zhai L, Zhang D. Sleep duration and obesity among adults: a meta‐analysis of prospective studies. Sleep Med. 2014;15:1456–1462. [DOI] [PubMed] [Google Scholar]
- 18. Cappuccio FP, Cooper D, D'Elia L, Strazzullo P, Miller MA. Sleep duration predicts cardiovascular outcomes: a systematic review and meta‐analysis of prospective studies. Eur Heart J. 2011;32:1484–1492. [DOI] [PubMed] [Google Scholar]
- 19. Gallicchio L, Kalesan B. Sleep duration and mortality: a systematic review and meta‐analysis. J Sleep Res. 2009;18:148–158. [DOI] [PubMed] [Google Scholar]
- 20. Kurina LM, McClintock MK, Chen JH, Waite LJ, Thisted RA, Lauderdale DS. Sleep duration and all‐cause mortality: a critical review of measurement and associations. Ann Epidemiol. 2013;23:361–370. [DOI] [PMC free article] [PubMed] [Google Scholar]
- 21. Hall MH, Fernandez‐Mendoza J, Kline CH, Vgontzas AN. Insomnia and health In: Kryger MH, Roth T, Dement WC, eds. Principles and Practice of Sleep Medicine. 6th ed New York: Elsevier Academic Press; 2016:794–803. [Google Scholar]
- 22. Grandner MA, Patel NP, Gehrman PR, Perlis ML, Pack AI. Problems associated with short sleep: bridging the gap between laboratory and epidemiological studies. Sleep Med Rev. 2010;14:239–247. [DOI] [PMC free article] [PubMed] [Google Scholar]
- 23. Fernandez‐Mendoza J, Vgontzas AN, Liao D, Shaffer ML, Vela‐Bueno A, Basta M, Bixler EO. Insomnia with objective short sleep duration and incident hypertension: the Penn State Cohort. Hypertension. 2012;60:929–935. [DOI] [PMC free article] [PubMed] [Google Scholar]
- 24. Knutson KL, Van Cauter E, Zee P, Liu K, Lauderdale DS. Cross‐sectional associations between measures of sleep and markers of glucose metabolism among subjects with and without diabetes: the Coronary Artery Risk Development in Young Adults (CARDIA) Sleep Study. Diabetes Care. 2011;34:1171–1176. [DOI] [PMC free article] [PubMed] [Google Scholar]
- 25. Vasisht KP, Kessler LE, Booth JN III, Imperial JG, Penev PD. Differences in insulin secretion and sensitivity in short‐sleep insomnia. Sleep. 2013;36:955–957. [DOI] [PMC free article] [PubMed] [Google Scholar]
- 26. Bathgate CJ, Edinger JD, Wyatt JK, Krystal AD. Objective but not subjective short sleep duration associated with increased risk for hypertension in individuals with insomnia. Sleep. 2016;39:1037–1045. [DOI] [PMC free article] [PubMed] [Google Scholar]
- 27. Vgontzas AN, Fernandez‐Mendoza J, Liao D, Bixler EO. Insomnia with objective short sleep duration: the most biologically severe phenotype of the disorder. Sleep Med Rev. 2013;17:241–254. [DOI] [PMC free article] [PubMed] [Google Scholar]
- 28. Rodenbeck A, Huether G, Ruether E, Hajak G. Interactions between evening and nocturnal cortisol secretion and sleep parameters in patients with severe chronic primary insomnia. Neurosci Lett. 2002;324:159–163. [DOI] [PubMed] [Google Scholar]
- 29. Shaver JL, Johnston SK, Lentz MJ, Landis CA. Stress exposure, psychological distress, and physiological stress activation in midlife women with insomnia. Psychosom Med. 2002;64:793–802. [DOI] [PubMed] [Google Scholar]
- 30. Riemann D, Klein T, Rodenbeck A, Feige B, Horney A, Hummel R, Weske G, Al‐Shajlawi A, Voderholzer U. Nocturnal cortisol and melatonin secretion in primary insomnia. Psychiatry Res. 2002;113:17–27. [DOI] [PubMed] [Google Scholar]
- 31. Irwin M, Clark C, Kennedy B, Christian Gillin J, Ziegler M. Nocturnal catecholamines and immune function in insomniacs, depressed patients, and controls subjects. Brain Behav Immun. 2003;17:365–372. [DOI] [PubMed] [Google Scholar]
- 32. Bonnet MH, Arand DL. 24‐hour metabolic rate in insomniacs and matched normal sleepers. Sleep. 1995;18:581–588. [DOI] [PubMed] [Google Scholar]
- 33. Stepanski E, Glinn M, Zorick F, Roehrs T, Roth T. Heart rate changes in chronic insomnia. Stress Med. 1994;10:261–266. [Google Scholar]
- 34. Bonnet MH, Arand DL. Heart rate variability in insomniacs and matched normal sleepers. Psychosom Med. 1998;60:610–615. [DOI] [PubMed] [Google Scholar]
- 35. Spiegelhalder K, Fuchs L, Ladwig J, Kyle SD, Nissen C, Voderholzer U, Feige B, Riemann D. Heart rate and heart rate variability in subjectively reported insomnia. J Sleep Res. 2011;20:137–145. [DOI] [PubMed] [Google Scholar]
- 36. de Zambotti M, Covassin N, Sarlo M, De Min Tona G, Trinder J, Stegagno L. Nighttime cardiac sympathetic hyper‐activation in young primary insomniacs. Clin Auton Res. 2013;23:49–56. [DOI] [PubMed] [Google Scholar]
- 37. Bixler EO, Vgontzas AN, Ten Have T, Tyson K, Kales A. Effects of age on sleep apnea in men: I. Prevalence and severity. Am J Respir Crit Care Med. 1998;157:144–148. [DOI] [PubMed] [Google Scholar]
- 38. Bixler EO, Vgontzas AN, Lin HM, Ten Have T, Rein J, Vela‐Bueno A, Kales A. Prevalence of sleep‐disordered breathing in women: effects of gender. Am J Respir Crit Care Med. 2001;163:608–613. [DOI] [PubMed] [Google Scholar]
- 39. Bixler EO, Vgontzas AN, Lin HM, Vela‐Bueno A, Kales A. Insomnia in central Pennsylvania. J Psychosom Res. 2002;53:589–592. [DOI] [PubMed] [Google Scholar]
- 40. National Center for Health Statistics . 2003 revision of the U.S. Standard Certificate of Death. 2003. Available at: http://www.cdc.gov/nchs/data/dvs/DEATH11-03final-acc.pdf. Accessed September 1, 2016.
- 41. National Center for Health Statistics . Report of the panel to evaluate the U.S. standard certificates. 2000. Available at: http://www.cdc.gov/nchs/data/dvs/panelreport_acc.pdf. Accessed September 1, 2016.
- 42. World Health Organization . Manual of the International Classification of Diseases, Injuries, and Causes of Death, Ninth Revision. Geneva: World Health Organization; 1977. [Google Scholar]
- 43. World Health Organization . International Statistical Classification of Diseases and Related Health Problems, Tenth Revision. Geneva: World Health Organization; 1992. [PubMed] [Google Scholar]
- 44. World Health Organization . International Statistical Classification of Diseases and Related Health Problems, Tenth Revision. 2008 ed Geneva: World Health Organization; 2009. [Google Scholar]
- 45. Vital statistics, instructions for classifying the underlying cause of death. NCHS instruction manual, part 2a. Hyattsville, MD: Public Health Service; 2016. [Google Scholar]
- 46. National Center for Health Statistics . ICD‐10 cause‐of‐death lists for tabulating mortality statistics, updated March 2011. NCHS instruction manual, part 9. Hyattsville, MD: Public Health Service; 2011. Available at: http://www.cdc.gov/nchs/nvss/instruction_manuals.htm. Accessed September 1, 2016. [Google Scholar]
- 47. Grundy SM, Brewer HB Jr, Cleeman JI, Smith SC Jr, Lenfant C; National Heart, Lung, and Blood Institute; American Heart Association . Definition of metabolic syndrome: report of the National Heart, Lung, and Blood Institute/American Heart Association conference on scientific issues related to definition. Arterioscler Thromb Vasc Biol. 2004;24:e13–e18. [DOI] [PubMed] [Google Scholar]
- 48. Grundy SM, Hansen B, Smith SC Jr, Cleeman JI, Kahn RA; American Heart Association; National Heart, Lung, and Blood Institute; American Diabetes Association . Clinical management of metabolic syndrome: report of the American Heart Association/National Heart, Lung, and Blood Institute/American Diabetes Association conference on scientific issues related to management. Circulation. 2004;109:551–556. [DOI] [PubMed] [Google Scholar]
- 49. Alberti KG, Zimmet PZ. Definition, diagnosis and classification of diabetes mellitus and its complications, part 1: diagnosis and classification of diabetes mellitus provisional report of a WHO consultation. Diabet Med. 1998;15:539–553. [DOI] [PubMed] [Google Scholar]
- 50. Lloyd‐Jones DM, Hong Y, Labarthe D, Mozaffarian D, Appel LJ, Van Horn L, Greenlund K, Daniels S, Nichol G, Tomaselli GF, Arnett DK, Fonarow GC, Ho PM, Lauer MS, Masoudi FA, Robertson RM, Roger V, Schwamm LH, Sorlie P, Yancy CW, Rosamond WD; American Heart Association Strategic Planning Task Force and Statistics Committee . Defining and setting national goals for cardiovascular health promotion and disease reduction: the American Heart Association's strategic Impact Goal through 2020 and beyond. Circulation. 2010;121:586–613. [DOI] [PubMed] [Google Scholar]
- 51. Rechtschaffen A, Kales A. A Manual of Standardized Terminology, Techniques and Scoring System for Sleep Stages of Human Subjects. Bethesda, MD: National Institutes of Health; 1968. [Google Scholar]
- 52. Waksberg J. Sampling methods for random digit dialing. J Am Stat Assoc. 1978;73:40–46. [Google Scholar]
- 53. Kish L. Survey Sampling. New York: John Wiley & Sons Inc; 1965. [Google Scholar]
- 54. U.S. Department of Health and Human Services (DHHS), National Center for Health Statistics . Third National Health and Nutrition Examination Survey, 1988–1994. NHANES III Laboratory Data File. Hyattsville, MD: Centers for Disease Control and Prevention; 1996. [Google Scholar]
- 55. Wang Q, Xi B, Liu M, Zhang Y, Fu M. Short sleep duration is associated with hypertension risk among adults: a systematic review and meta‐analysis. Hypertens Res. 2012;35:1012–1018. [DOI] [PubMed] [Google Scholar]
- 56. Guo X, Zheng L, Wang J, Zhang X, Zhang X, Li J, Sun Y. Epidemiological evidence for the link between sleep duration and high blood pressure: a systematic review and meta‐analysis. Sleep Med. 2013;14:324–332. [DOI] [PubMed] [Google Scholar]
- 57. Holliday EG, Magee CA, Kritharides L, Banks E, Attia J. Short sleep duration is associated with risk of future diabetes but not cardiovascular disease: a prospective study and meta‐analysis. PLoS One. 2013;8:e82305. [DOI] [PMC free article] [PubMed] [Google Scholar]
- 58. Writing Group Members , Roger VL, Go AS, Lloyd‐Jones DM, Benjamin EJ, Berry JD, Borden WB, Bravata DM, Dai S, Ford ES, Fox CS, Fullerton HJ, Gillespie C, Hailpern SM, Heit JA, Howard VJ, Kissela BM, Kittner SJ, Lackland DT, Lichtman JH, Lisabeth LD, Makuc DM, Marcus GM, Marelli A, Matchar DB, Moy CS, Mozaffarian D, Mussolino ME, Nichol G, Paynter NP, Soliman EZ, Sorlie PD, Sotoodehnia N, Turan TN, Virani SS, Wong ND, Woo D, Turner MB; on behalf of the American Heart Association Statistics Committee and Stroke Statistics Subcommittee . Heart disease and stroke statistics–2012 update: a report from the American Heart Association. Circulation. 2012;125:e2–e220. [DOI] [PMC free article] [PubMed] [Google Scholar]
- 59. Hong Y, Jin X, Mo J, Lin H‐M, Duan Y, Pu M, Wolbrette DL, Liao D. Metabolic syndrome, its preeminent clusters, incident coronary heart disease and all‐cause mortality—results of prospective analysis for the Atherosclerosis Risk in Communities study. J Intern Med. 2007;262:113–122. [DOI] [PubMed] [Google Scholar]
- 60. Hanefeld M, Koehler C, Gallo S, Benke I, Ott P. Impact of the individual components of the metabolic syndrome and their different combinations on the prevalence of atherosclerotic vascular disease in type 2 diabetes: the Diabetes in Germany (DIG) study. Cardiovasc Diabetol. 2007;6:13. [DOI] [PMC free article] [PubMed] [Google Scholar]
- 61. Franco OH, Massaro JM, Civil J, Cobain MR, O'Malley B, D'Agostino RB Sr. Trajectories of entering the metabolic syndrome: the Framingham Heart Study. Circulation. 2009;120:1943–1950. [DOI] [PubMed] [Google Scholar]
- 62. Saper CB, Scammell TE, Lu J. Hypothalamic regulation of sleep and circadian rhythms. Nature. 2005;437:1257–1263. [DOI] [PubMed] [Google Scholar]
- 63. Schneeberger M, Gomis R, Claret M. Hypothalamic and brainstem neuronal circuits controlling homeostatic energy balance. J Endocrinol. 2014;220:T25–T46. [DOI] [PubMed] [Google Scholar]
- 64. Wohlgemuth WK, Edinger JD, Fins AI, Sullivan RJ. How many nights are enough? The short‐term stability of sleep parameters in elderly insomniacs and normal sleepers. Psychophysiology. 1999;36:233–244. [PubMed] [Google Scholar]
- 65. Gaines J, Vgontzas AN, Fernandez‐Mendoza J, Basta M, Pejovic S, He F, Bixler EO. Short‐ and long‐term sleep stability in insomniacs and healthy controls. Sleep. 2015;38:1727–1734. [DOI] [PMC free article] [PubMed] [Google Scholar]