

Abstract
Background
Diffusion tensor imaging measures of white matter (WM) microstructural integrity appear to provide earlier indication of WM injury than WM hyperintensities; however, risk factors for poor WM microstructural integrity have not been established. Our study quantifies the association between vascular risk factors in midlife and late life with measures of late‐life WM microstructural integrity.
Methods and Results
We used data from 1851 participants in ARIC (Atherosclerosis Risk in Communities Study) who completed 3‐T magnetic resonance imaging, including diffusion tensor imaging, as part of the ARIC Neurocognitive Study (ARIC‐NCS). We quantified the association among lipids, glucose, and blood pressure from the baseline ARIC visit (1987–1989, ages 44–65, midlife) and visit 5 of ARIC (2011–2013, ages 67–90, late life, concurrent with ARIC‐NCS) with regional and overall WM mean diffusivity and fractional anisotropy obtained at ARIC visit 5 for ARIC participants. We also considered whether these associations were independent of or modified by WM hyperintensity volumes. We found that elevated blood pressure in midlife and late life and elevated glucose in midlife, but not late life, were associated with worse late‐life WM microstructural integrity. These associations were independent of the degree of WM hyperintensity, and the association between glucose and WM microstructural integrity appeared stronger for those with the least WM hyperintensity. There was little support for an adverse association between lipids and WM microstructural integrity.
Conclusions
Hypertension in both midlife and late life and elevated glucose in midlife are related to worse WM microstructural integrity in late life.
Keywords: blood pressure, epidemiology, leukoencephalopathy, risk factor, type 2 diabetes mellitus
Subject Categories: Epidemiology; Risk Factors; Diabetes, Type 2; Lipids and Cholesterol; High Blood Pressure
Clinical Perspective
What Is New?
Diffusion tensor imaging quantifies the microstructural integrity of white matter in the brain.
Changes to brain white matter microstructural integrity provide an early indication of who is at risk of cerebral white matter injury and subsequent cognitive impairment.
We found elevated glucose in midlife and elevated blood pressure at both midlife and late life were associated with worse brain white matter microstructural integrity. These associations were largely independent of the severity of white matter hyperintensities, a marker of cerebral white matter injury.
Lipid levels at midlife or late life were not associated with brain white matter microstructural integrity.
What Are the Clinical Implications?
Avoiding elevated glucose in midlife and hypertension at any point may prevent later damage to brain white matter microstructural integrity and its downstream effects.
Diffusion tensor imaging–based measures may be appropriate risk‐stratification tools or surrogate outcomes in clinical trials intervening with regard to vascular risk factors.
Additional work is required to confirm these findings and to better establish the utility of these markers.
Introduction
Vascular risk factors may increase the risk of subsequent cognitive decline and dementia, with the strongest evidence supporting a link between midlife vascular risk‐factor levels and late life cognition.1, 2, 3 In the absence of stroke, subclinical brain injury likely mediates these associations. Diffusion tensor imaging (DTI) quantifies the microstructural integrity of white matter (WM),4 which almost certainly plays a role in later life cognitive impairment,5, 6 and so can be used to assess subclinical brain injury. DTI also complements other neuroimaging measures, namely measures of WM hyperintensities (WMHs) or WM volumes, because it provides an assessment of pathologic changes that precede and predict the development of WMH or WM loss.7, 8, 9, 10, 11, 12 Consequently, changes to WM microstructural integrity provide an early indication of who is at risk of cerebral WM injury, including both WMH and WM loss, and subsequent cognitive impairment. Identifying risk factors for poor WM microstructural integrity will help us understand the extent to which DTI‐based measures are appropriate risk‐stratification tools or surrogate outcomes in clinical trials. As such, understanding risk factors for poor WM microstructural integrity will be critical in efforts to prevent or mitigate these adverse outcomes.
Given the link between measures of WM microstructural integrity and subsequent development of WMHs, we hypothesized that risk factors for poor WM microstructural integrity and WMHs would be similar. Elevated blood pressure is consistently associated with the presence, severity, and progression of WMH, regardless of the timing of measurement.13, 14, 15, 16, 17, 18 Although diabetes mellitus and fasting glucose are not typically associated with WMH in cross‐sectional analyses,19, 20 previous diabetes mellitus and fasting glucose are related to WMH progression and later WMH severity in longitudinal analyses.16, 18 Conversely, lipids do not appear to be associated with severity or progression of WMH.16, 19 In comparison, existing studies evaluating the association between these risk factors and WM microstructural integrity are typically small and cross‐sectional, and despite evidence of a link between WM microstructural integrity and WMH, most have not investigated whether the association is independent of or modified by WMH. The goal of this study was to quantify the association of midlife and late‐life measures of vascular risk factors with late‐life WM microstructural integrity in a relatively large sample of persons drawn from ARIC‐NCS (Atherosclerosis Risk in Communities Neurocognitive Study) and to consider whether the association is independent of or modified by WMH.
Methods
Study Population
The ARIC study is a longitudinal cohort study of 15 792 persons recruited between 1987 and 1989 (visit 1) from 4 US communities: suburbs of Minneapolis, Minnesota; Forsyth County, North Carolina; Washington County, Maryland; and Jackson, Mississippi. In 2011–2013 (visit 5), all persons with evidence of cognitive impairment and a stratified random sample of other participants were invited to complete brain magnetic resonance imaging (MRI) as part of ARIC‐NCS.21 As such, although the MRI subsample is enriched with persons with cognitive impairment, use of derived sampling weights allows estimation of what the effects would be had we obtained MRI on all ARIC visit 5 participants. Our eligible sample included those ARIC‐NCS participants with valid DTI data, excluding nonblack and nonwhite persons (n=6), black participants from Maryland or Minnesota (n=9), persons disallowing the use of genetic data (n=10), and persons with prior stroke (n=66). Primary analyses also excluded persons missing exposure or covariate data; we considered associations in the full eligible sample after multiply imputing missing data in sensitivity analyses. The institutional review boards of all participating institutions approved this study, and participants provided written informed consent before participation.
Brain Imaging
At ARIC‐NCS, each study site followed identical protocols for 3‐T brain MRI. All scans included sagittal T1‐weighted MPRAGE (magnetization‐prepared rapid gradient‐echo imaging), axial T2 FLAIR (fluid attenuation inversion recovery), and axial DTI pulse sequences. Data were processed by the ARIC MRI Reading Center at the Mayo Clinic (Rochester, MN). We provide an overview below (see Supplementary Methods for details).
Fractional anisotropy (FA) measures the directional constraint of water diffusion and ranges from 0 to 1 (unitless). Mean diffusivity (MD) is a scalar measure of how quickly water molecules diffuse overall (mm2/s). Lower FA and higher MD indicate worse WM microstructural integrity. WM FA and MD were calculated for brain regions defined by an in‐house atlas of lobar and deep WM regions based on the STAND400 template.22 The WM regions were intersected with tissue segmentations from each participant's T1‐weighted and FLAIR images; WM FA and MD were calculated using voxels with a >50% probability of being WM. The segmentation takes care to include WMHs as WM. To account for imperfect registration between the DTI and T1‐weighted images, an upper cutoff of MD <0.002 mm2/s was applied to exclude edge voxels that were primarily cerebrospinal fluid. We averaged left and right WM FA and MD across atlas regions and then took a weighted average, with weights based on the number of voxels in each WM region, to create WM FA and MD measures for 7 regions of interest (ROIs): frontal, temporal, occipital, and parietal lobes; anterior and posterior corpus callosum; and an overall measure—the weighted average of these 6 ROIs (capsular WM was not included). WMH and intracranial volumes were quantified via in‐house algorithms.23, 24
Vascular Risk Factors
We considered vascular risk factors at ARIC visit 1 (1987–1989, midlife, ages 44–65) and ARIC visit 5 (2011–2013, late life, ages 67–90). Plasma total cholesterol and triglycerides were measured using enzymatic methods,25, 26 high‐density lipoprotein cholesterol (HDL‐C) concentrations were determined after precipitation of non‐HDL lipoproteins,27, 28 and low‐density lipoprotein cholesterol (LDL‐C) levels were calculated using the Friedewald equation.29 Serum glucose was measured using the hexokinase method.30 Systolic blood pressure (SBP) and diastolic blood pressure (DBP) were measured 3 times according to a standard protocol; we consider the mean of the 2 final measurements.
Covariates
All covariates are based on data collected at ARIC visit 1 or at ARIC visit 5 and include age (years), sex (male, female), race and center (black–Mississippi, black–North Carolina, white–North Carolina, white–Maryland, white–Minnesota), education (less than high school/high school, General Educational Development test, vocational school, some college/college, graduate or professional school), APOE*E4 allele status (present, absent), body mass index (kg/m2), smoking status (current, former, never), antihypertensive medication use (yes, no), lipid‐lowering medication use (yes, no), and diabetes mellitus medication use (yes, no). Medication use was determined through direct visual inspection and linkage to Medi‐Span therapeutic classification codes.
Statistical Methods
We standardized ROI WM FA and MD by subtracting the sample mean and dividing by the sample standard deviation. For our primary analyses, we used separate weighted linear regression models to quantify the association between each vascular risk factor and WM FA and MD in each ROI. The weights account for the approach used to select ARIC participants for MRI. Given slight deviations from a linear dose‐response pattern for some exposures in exploratory analyses, we considered associations with both categorical and linear exposure parameterizations. All analyses were adjusted for the covariates described above and the other vascular risk factors (eg, SBP, DBP, and glucose in models estimating associations with lipids). Time‐varying covariates were updated to reflect the status at the time of exposure assessment (eg, visit 1 age when considering visit 1 SBP, visit 5 age for visit 5 SBP). We then adjusted these primary models for total WMH volumes and intracranial volume to determine whether our associations were independent of WMH severity.
We conducted several sensitivity analyses. We repeated analyses considering glucose and lipids after restricting those who were fasting ≥8 hours at blood draw (98% at visit 1, 96% at visit 5). We repeated analyses for glucose and blood pressure adjusting for total cholesterol, HDL‐C, and triglycerides rather than LDL‐C. We restricted analyses of triglycerides to those with <500 mg/dL triglycerides to exclude potentially influential outliers. We considered analyses after multiply imputing missing exposure and covariate data31 to understand the influence and missing data. Finally, we considered unweighted analyses to understand the influence of the selection process by which we selected visit 5 participants for MRI and analyses additionally weighted with inverse probability of attrition weights32, 33 to better understand the potential influence of potentially informative attrition from visit 1 to visit 5 on our results.
We used multiplicative interaction terms to evaluate effect modification by age (<75 or ≥75 years), race (black or white), sex (male or female), APOE*E4 (present or absent), cognitive status (normal/mild cognitive impairment or dementia), and WMH severity (deciles of intracranial volume‐standardized WMH volumes). We considered P<0.05 to be statistically significant and reported 95% confidence intervals. We did not adjust for multiple comparisons, given that the association between a vascular risk factor at a given time point and 1 measure of WM microstructural integrity is likely correlated with associations considering other time points or ROIs. All analyses were completed using SAS version 9.4, STATA version 14.0, or R version 3.1.2.
Results
Weighted characteristics of the 1851 eligible persons are provided in Table. Mean SBP and glucose were higher at visit 5 than at visit 1, whereas mean DBP, total cholesterol, and LDL‐C were lower. Tables S1 and S2 provide unweighted summary statistics and information on missingness.
Table 1.
Weighted Characteristics of Eligible ARIC‐NCS Participants at Visits 1 and 5 (n=1851)
| Visit 1 (1987–1989) | Visit 5 (2011–2013) | P Valueb | |
|---|---|---|---|
| Mean (25th, 75th Percentile) or %a | |||
| Time to MRI, y | 23.6 (23.0, 24.2) | 0 (0, 0) | ··· |
| Age, y | 51.7 (46.8, 55.1) | 75.3 (70.4, 78.7) | <0.0001 |
| Cognitively normal | ··· | 74.1% | ··· |
| APOE*E4 allele | 27.4% | ··· | |
| Male | 38.5% | ··· | |
| Race‐center | ··· | ||
| White‐Minnesota | 29.9% | ||
| White‐Maryland | 27.6% | ||
| White‐North Carolina | 21.2% | ||
| Black‐North Carolina | 1.7% | ||
| Black‐Mississippi | 19.6% | ||
| Education | ··· | ||
| <12 y | 11.8% | ||
| 12–16 y | 40.3% | ||
| >16 y | 47.9% | ||
| Smoking status | <0.0001 | ||
| Current | 16.6% | 5.2% | |
| Former | 33.2% | 51.6% | |
| Never | 50.2% | 43.1% | |
| Body mass index, kg/m2 | 26.8 (23.3, 29.3) | 28.4 (24.7, 31.2) | <0.0001 |
| Systolic blood pressure, mm Hg | 114.8 (103.7, 122.9) | 129.8 (117.1, 140.1) | <0.0001 |
| Diastolic blood pressure, mm Hg | 72.2 (64.7, 78.0) | 66.0 (58.6, 72.3) | <0.0001 |
| Fasting glucose, mg/dL | 99.4 (90.9, 102.8) | 112.0 (96.9, 117.2) | <0.0001 |
| Total cholesterol, mg/dL | 209.6 (182.0, 231.2) | 185.9 (155.2, 212.4) | <0.0001 |
| HDL‐C, mg/dL | 54.2 (42.0, 63.1) | 53.4 (43.0, 61.6) | 0.007 |
| LDL‐C, mg/dL | 132.2 (107.5, 154.5) | 107.4 (81.3, 128.3) | <0.0001 |
| Triglycerides, mg/dL | 117.3 (71.3, 139.8) | 125.7 (85.2, 147.9) | <0.0001 |
| Antihypertensive medication use | 20.2% | 72.6% | <0.0001 |
| Medication use for diabetes mellitus | 1.7% | 18.5% | <0.0001 |
| Lipid‐lowering medication use | 1.6% | 51.9% | <0.0001 |
| Hypercholesterolemia | 57.3% | 34.9% | <0.0001 |
| Fractional anisotropy, by region | |||
| Frontal | ··· | 0.28 (0.27, 0.30) | ··· |
| Temporal | ··· | 0.28 (0.27, 0.30) | ··· |
| Parietal | ··· | 0.30 (0.29, 0.31) | ··· |
| Occipital | ··· | 0.22 (0.20, 0.24) | ··· |
| Anterior corpus callosum | ··· | 0.43 (0.39, 0.47) | ··· |
| Posterior corpus callosum | ··· | 0.58 (0.54, 0.62) | ··· |
| Overall | ··· | 0.28 (0.27, 0.30) | ··· |
| Mean diffusivity, by region, 10−4 mm2/s | |||
| Frontal | ··· | 8.5 (8.2, 8.9) | ··· |
| Temporal | ··· | 8.8 (8.4, 9.2) | ··· |
| Parietal | ··· | 8.8 (8.3, 9.1) | ··· |
| Occipital | ··· | 8.7 (8.2, 9.1) | ··· |
| Anterior corpus callosum | ··· | 11.5 (10.7, 12.2) | ··· |
| Posterior corpus callosum | ··· | 11.2 (10.4, 11.8) | ··· |
| Overall | ··· | 8.7 (8.3, 9.1) | ··· |
ARIC‐NCS indicates Atherosclerosis Risk in Communities Neurocognitive Study; HDL‐C, high‐density lipoprotein cholesterol; LDL‐C, low‐density lipoprotein cholesterol; MRI, magnetic resonance imaging.
Summary measures among those with data for a given variable.
Comparing visits 1 and 5 using a weighted paired t test or McNemar test, as appropriate.
Findings were generally consistent across ROIs, sensitivity analyses, and categorical and linear versions of the exposures (Figures S1 through S28; Tables S3 through S5). We reported the linear association between our vascular risk factors and overall WM MD or FA in the next sections and discussed other analyses only when they differed substantially from these analyses. Likewise, we discussed effect measure modification by age, sex, or race only when there was evidence supporting its presence.
Plasma Lipids
Although there was little support for an adverse association between elevated lipids at visit 1 and overall WM FA, elevated total cholesterol, LDL‐C, and HDL‐C at visit 5 appeared to be associated with better overall WM FA (Figure 1). However, these protective associations were limited to those who remained cognitively normal at visit 5 (interaction P<0.05, with the exception of P=0.08 for visit 5 HDL‐C) and were attenuated in sensitivity analyses omitting sampling weights or weighting for attrition, which upweight persons with cognitive impairment (Figures S6, S10, and S14). Findings were materially unchanged after adjustment for WMH (Figure 1), and there was little support for effect modification by WMH volumes (Figures S29 through S32). Analyses considering effect modification suggested an association between higher visit 5 triglycerides and worse overall FA in women but not men (interaction P=0.004).
Figure 1.

Comparison of primary and WMH‐adjusted analyses of the association of mid‐ or late‐life cardiovascular risk factors with overall WM FA. CI indicates confidence interval; DBP, diastolic blood pressure; FA, fractional anisotropy; HDL‐c, high‐density lipoprotein cholesterol; LDL‐c, low‐density lipoprotein cholesterol; SBP, systolic blood pressure; WM, white matter; WMH, white matter hyperintensity.
Visit 1 and 5 plasma lipids were not associated with overall WM MD, with the exception of an adverse association with elevated triglycerides at visit 5 (Figure 2); however, this result was not robust to sensitivity analyses omitting sampling weights or imputing missing data (Figure S4). Adjustment for WMH did not alter these findings (Figure 2). Some evidence suggested an association between elevated LDL‐C and worse overall WM FA and MD only in those in the highest decile of standardized WMH volumes (Figure S30). Analyses considering effect modification also suggested a protective association between visit 1 HDL‐C and overall WM MD in black but not white participants (interaction P=0.01).
Figure 2.

Comparison of primary and WMH‐adjusted analyses of the association of mid‐ or late‐life cardiovascular risk factors with overall WM MD. CI indicates confidence interval; DBP, diastolic blood pressure; HDL‐c, high‐density lipoprotein cholesterol; LDL‐c, low‐density lipoprotein cholesterol; MD, mean diffusivity; SBP, systolic blood pressure; WM, white matter; WMH, white matter hyperintensity.
Serum Glucose
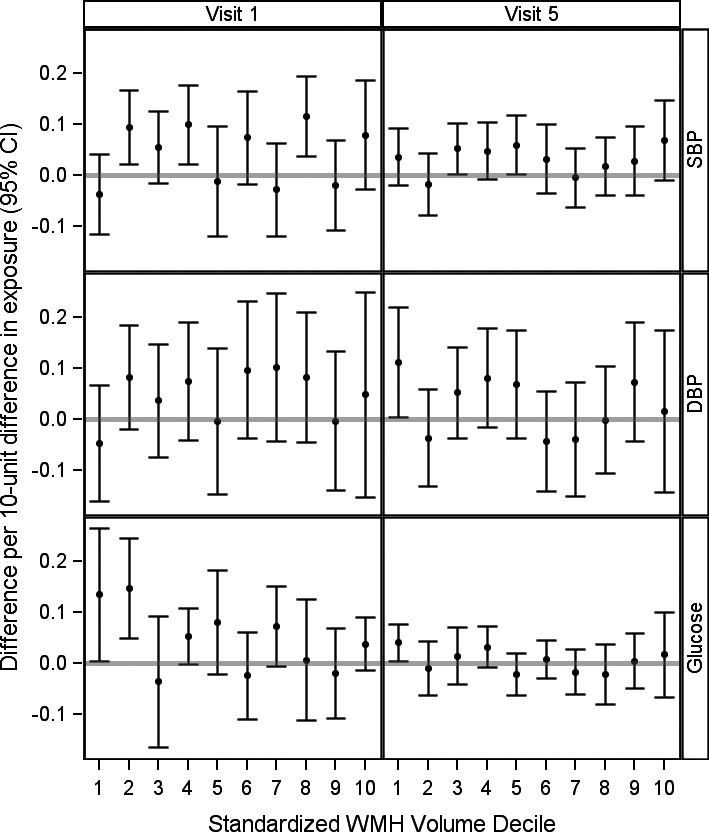
Elevated serum glucose at visit 1 was strongly associated with worse overall WM MD (Figure 2). Although elevated glucose at visit 1 was marginally associated with worse overall WM FA (Figure 1), analyses considering categories of glucose did not support an association (Table S4). Visit 5 glucose was not associated with overall WM FA or MD, except in sensitivity analyses implementing inverse probability of attrition weighting, where higher visit 5 glucose was associated with worse overall WM MD. Results were similar after additional adjustment for WMH (Figures 1 and 2), and the adverse association between elevated visit 1 glucose and worse MD or FA was stronger in those with the least WMH (Figures 3 and 4).
Figure 3.

The adjusted association between cardiovascular risk factors at visit 1 or 5 and measures of overall white matter fractional anisotropy by decile of intracranial‐volume standardized WMH volumes. CI indicates confidence interval; DBP, diastolic blood pressure; SBP, systolic blood pressure; WMH, white matter hyperintensity.
Figure 4.
The adjusted association between cardiovascular risk factors at visit 1 or 5 and measures of overall white matter mean diffusivity by decile of intracranial‐volume standardized WMH volumes. CI indicates confidence interval; DBP, diastolic blood pressure; SBP, systolic blood pressure; WMH, white matter hyperintensity.
Blood Pressure
Elevated SBP and DBP at either visit were strongly associated with worse overall WM FA and MD. Additional adjustment for WMH slightly attenuated, but did not eliminate, these associations (Figures 1 and 2). There was little support for effect modification by WMH volumes (Figures 3 and 4). Of note, in ROI‐specific analyses, associations with MD or FA in the anterior or posterior corpus callosum were often weaker or null, and the association between visit 1 DBP and MD was attenuated slightly in inverse probability of attrition weighting sensitivity analyses (Figures S21 through S28).
Discussion
To our knowledge, this study of the relation of vascular risk factors and WM microstructural integrity is the largest and most comprehensive to date. Consistent with our own findings that elevated blood pressure at both midlife and late life was associated with worse WM microstructural integrity, several small cross‐sectional studies also previously reported an association between elevated blood pressure and worse WM microstructural integrity.7, 34, 35, 36, 37, 38, 39, 40, 41, 42 Our finding of an association between midlife glucose and late‐life WM microstructural integrity is also consistent with 1 prior report of stronger associations between diabetes mellitus and WM microstructural integrity with increasing duration of diabetes mellitus.43 Although we did not observe a cross‐sectional association between glucose and WM microstructural integrity, prior cross‐sectional studies generally reported worse microstructural integrity in participants with diabetes mellitus compared with controls.43, 44, 45, 46, 47, 48 Given that these studies were modest in size (n<250), focused on diabetes mellitus rather than glucose, and often reported effects only in localized brain regions, further work will be needed to reconcile these findings with our own. Finally, although we found little support for an adverse association between elevated lipids and late‐life WM microstructural integrity, prior reports are mixed, with studies reporting both null and adverse associations between lipids and WM microstructural integrity.47, 49, 50, 51 As with the literature on diabetes mellitus and WM microstructural integrity, however, these studies frequently report localized effects, which may not be reflected in our analyses, given our focus on large ROIs, and are limited by their size (n<250). Our finding that associations between vascular risk factors and WM microstructural integrity were largely independent of WMH volumes is also consistent with some prior reports,43, 45, 47 reinforcing the notion that WM microstructural integrity damage likely precedes WMH.
Our findings underscore the importance of moving to longitudinal designs that can answer questions about when exposures are relevant. Strengths of this study include the large number participants, the use of data on midlife and late‐life vascular risk factors, and a community‐based sample. Compared with a voxelwise comparison‐based approach, our ROI‐based approach has a reduced chance of type I error and greater reproducibility but is unlikely to identify localized effects. Because we based our study on an MRI subsample, selection bias is a potential concern; however, we do not believe that this is a significant source of bias in this study because our sensitivity analyses designed to address and quantify this source of bias were generally consistent with our primary analyses. Other limitations include the lack of serial MRIs, precluding assessment change in FA or MD, and the potential for chance findings or residual bias.
Changes to WM microstructural integrity provide an early indication of who is at risk of cerebral WM injury, including both WMH and WM loss, and subsequent cognitive impairment. Our study confirmed that the risk factors for WM microstructural integrity and WMH are similar, and that, perhaps most important, these associations were independent of WMH presence and severity. Although our study provides early evidence to suggest that DTI‐based measures may be appropriate outcomes risk‐stratification tools or surrogate outcomes in clinical trials intervening with regard to vascular risk factors, additional work is required to confirm these findings and to better establish the utility of these markers. Regardless, our study suggests that avoiding elevated glucose in midlife and hypertension at any point may prevent later damage to WM microstructural integrity and its downstream effects.
Sources of Funding
Dr Power was supported by the NIA (T32 AG027668). The ARIC is carried out as a collaborative study supported by NHLBI contracts (HHSN268201100005C, HHSN268201100006C, HHSN268201100007C, HHSN268201100008C, HHSN268201100009C, HHSN268201100010C, HHSN268201100011C, and HHSN268201100012C). Neurocognitive data are collected by NIH U01 HL096812, HL096814, HL096899, HL096902, HL096917 with previous brain MRI examinations funded by NIH R01‐HL70825. The sponsors had no role in the design and conduct of the study; collection management, analysis and interpretation of the data; or preparation review, or approval of the manuscript.
Disclosures
Mr Tingle and Drs Coresh, Griswold, Huang, Mosley, Power, Reid, and Sharrett have no disclosures. Dr Jack Jr serves on a scientific advisory board for Eli Lilly & Company and receives research support from NIH and the Alexander Family Alzheimer's Disease Research Professorship of the Mayo Foundation. Dr Gottesman is an Associate Editor for Neurology ® and receives research support from NIH. Dr Knopman serves on a Data Safety Monitoring Board (DSMB) for Lundbeck Pharmaceuticals and the DIAN study; is an investigator in clinical trials sponsored by Biogen, TauRX Pharmaceuticals, Lilly Pharmaceuticals and the Alzheimer's Disease Cooperative Study; and receives research support from NIH. Dr Kantarci serves on the DSMB for Takeda Pharmaceuticals Inc. and receives research support from NIH.
Supporting information
Data S1. Supplemental methods: Magnetic resonance imaging scan parameters and processing.
Table S1. Unweighted Characteristics Eligible ARIC‐NCS Sample Participants at Visits 1 and 5 (n=1851)
Table S2. Number of Eligible ARIC‐NCS Sample Participants Missing Covariate or Exposure Data at Visit 1 or 5
Table S3. Adjusted Associations Between a 10‐U Increase in the Level of Each Vascular Risk Factor ≈24 Years Prior to or Concurrent With Magnetic Resonance Imaging (MRI) and Standardized Measures of Overall White Matter Microstructural Integrity on Diffusion MRI in ARIC‐NCS
Table S4. Adjusted Difference in Total Fractional Anisotropy by Category of Vascular Risk Factors Measured at Visit 1 or 5
Table S5. Adjusted Difference in Total Mean Diffusivity by Category of Vascular Risk Factors Measured at Visit 1 or 5
Figure S1. Comparison of the primary analyses of the association of triglycerides with regional and total fractional anisotropy with sensitivity analysis considering different adjustment sets.
Figure S2. Comparison of the primary analyses of the association of trigylcerides with regional and total fractional anisotropy with sensitivity analyses considering the influence of weighting, attrition, or missing covariate or exposure data.
Figure S3. Comparison of the primary analyses of the association of trigylcerides with regional and total mean diffusivity with sensitivity analyses considering different adjustment sets.
Figure S4. Comparison of the primary analyses of the association of trigylcerides with regional and total mean diffusivity with sensitivity analyses considering the influence of weighting, attrition, or missing covariate or exposure data.
Figure S5. Comparison of the primary analyses of the association of low‐density lipoprotein cholesterol with regional and total fractional anisotropy with sensitivity analyses considering different adjustment sets.
Figure S6. Comparison of the primary analyses of the association of low‐density lipoprotein cholesterol with regional and total fractional anisotropy with sensitivity analyses considering the influence of weighting, attrition, or missing covariate or exposure data.
Figure S7. Comparison of the primary analyses of the association of low‐density lipoprotein cholesterol with regional and total mean diffusivity with sensitivity analyses considering different adjustment sets.
Figure S8. Comparison of the primary analyses of the association of low‐density lipoprotein cholesterol with regional and total mean diffusivity with sensitivity analyses considering the influence of weighting, attrition, or missing covariate or exposure data.
Figure S9. Comparison of the primary analyses of the association of high‐density lipoprotein cholesterol with regional and total fractional anisotropy with sensitivity analyses considering different adjustment sets.
Figure S10. Comparison of the primary analyses of the association of high‐density lipoprotein cholesterol with regional and total fractional anisotropy with sensitivity analyses considering the influence of weighting, attrition, or missing covariate or exposure data.
Figure S11. Comparison of the primary analyses of the association of high‐density lipoprotein cholesterol with regional and total mean diffusivity with sensitivity analyses considering different adjustment sets.
Figure S12. Comparison of the primary analyses of the association of high‐density lipoprotein cholesterol with regional and total mean diffusivity with sensitivity analyses considering the influence of weighting, attrition, or missing covariate or exposure data.
Figure S13. Comparison of the primary analyses of the association of total cholesterol with regional and total fractional anisotropy with sensitivity analyses considering different adjustment sets.
Figure S14. Comparison of the primary analyses of the association of total cholesterol with regional and total fractional anisotropy with sensitivity analyses considering the influence of weighting, attrition, or missing covariate or exposure data.
Figure S15. Comparison of the primary analyses of the association of total cholesterol with regional and total mean diffusivity with sensitivity analyses considering different adjustment sets.
Figure S16. Comparison of the primary analyses of the association of total cholesterol with regional and total mean diffusivity with sensitivity analyses considering the influence of weighting, attrition, or missing covariate or exposure data.
Figure S17. Comparison of the primary analyses of the association of glucose with regional and total fractional anisotropy with sensitivity analyses considering different adjustment sets.
Figure S18. Comparison of the primary analyses of the association of glucose with regional and total fractional anisotropy with sensitivity analyses considering the influence of weighting, attrition, or missing covariate or exposure data.
Figure S19. Comparison of the primary analyses of the association of glucose with regional and total mean diffusivity with sensitivity analyses considering different adjustment sets.
Figure S20. Comparison of the primary analyses of the association of glucose with regional and total mean diffusivity with sensitivity analyses considering the influence of weighting, attrition, or missing covariate or exposure data.
Figure S21. Comparison of the primary analyses of the association of diastolic blood pressure with regional and total fractional anisotropy with sensitivity analyses considering different adjustment sets.
Figure S22. Comparison of the primary analyses of the association of diastolic blood pressure with regional and total fractional anisotropy with sensitivity analyses considering the influence of weighting, attrition, or missing covariate or exposure data.
Figure S23. Comparison of the primary analyses of the association of diastolic blood pressure with regional and total mean diffusivity with sensitivity analyses considering different adjustment sets.
Figure S24. Comparison of the primary analyses of the association of diastolic blood pressure with regional and total mean diffusivity with sensitivity analyses considering the influence of weighting, attrition, or missing covariate or exposure data.
Figure S25. Comparison of the primary analyses of the association of systolic blood pressure with regional and total fractional anisotropy with sensitivity analyses considering different adjustment sets.
Figure S26. Comparison of the primary analyses of the association of systolic blood pressure with regional and total fractional anisotropy with sensitivity analyses considering the influence of weighting, attrition, or missing covariate or exposure data.
Figure S27. Comparison of the primary analyses of the association of systolic blood pressure with regional and total mean diffusivity with sensitivity analyses considering different adjustment sets.
Figure S28. Comparison of the primary analyses of the association of systolic blood pressure with regional and total mean diffusivity with sensitivity analyses considering the influence of weighting, attrition, or missing covariate or exposure data.
Figure S29. The adjusted association between triglycerides at visit 1 or 5 and measures of total white matter integrity by decile of intracranial‐volume standardized white matter hyperintensity volumes.
Figure S30. The adjusted association between low‐density lipoprotein cholesterol at visit 1 or 5 and measures of white matter integrity by decile of intracranial‐volume standardized white matter hyperintensity volumes.
Figure S31. The adjusted association between high‐density lipoprotein cholesterol at visit 1 or 5 and measures of white matter integrity by decile of intracranial‐volume standardized white matter hyperintensity volumes.
Figure S32. The adjusted association between total cholesterol at visit 1 or 5 and measures of white matter integrity by decile of intracranial‐volume standardized white matter hyperintensity volumes.
Acknowledgments
The authors thank the staff and participants of the ARIC study for their important contributions.
(J Am Heart Assoc. 2017;6:e005608 DOI: 10.1161/JAHA.117.005608.)28522676
This work was presented as an oral presentation at the Alzheimer's Association International Conference, July 22—27, 2016, in Toronto, Canada.
References
- 1. Anstey KJ, Lipnicki DM, Low LF. Cholesterol as a risk factor for dementia and cognitive decline: a systematic review of prospective studies with meta‐analysis. Am J Geriatr Psychiatry. 2008;16:343–354. [DOI] [PubMed] [Google Scholar]
- 2. Qiu C, Winblad B, Fratiglioni L. The age‐dependent relation of blood pressure to cognitive function and dementia. Lancet Neurol. 2005;4:487–499. [DOI] [PubMed] [Google Scholar]
- 3. Biessels GJ, Staekenborg S, Brunner E, Brayne C, Scheltens P. Risk of dementia in diabetes mellitus: a systematic review. Lancet Neurol. 2006;5:64–74. [DOI] [PubMed] [Google Scholar]
- 4. Alexander AL, Lee JE, Lazar M, Field AS. Diffusion tensor imaging of the brain. Neurotherapeutics. 2007;4:316–329. [DOI] [PMC free article] [PubMed] [Google Scholar]
- 5. Madden DJ, Bennett IJ, Song AW. Cerebral white matter integrity and cognitive aging: contributions from diffusion tensor imaging. Neuropsychol Rev. 2009;19:415–435. [DOI] [PMC free article] [PubMed] [Google Scholar]
- 6. Vernooij MW, Ikram MA, Vrooman HA, Wielopolski PA, Krestin GP, Hofman A, Niessen WJ, Van der Lugt A, Breteler MM. White matter microstructural integrity and cognitive function in a general elderly population. Arch Gen Psychiatry. 2009;66:545–553. [DOI] [PubMed] [Google Scholar]
- 7. Maillard P, Seshadri S, Beiser A, Himali JJ, Au R, Fletcher E, Carmichael O, Wolf PA, DeCarli C. Effects of systolic blood pressure on white‐matter integrity in young adults in the Framingham Heart Study: a cross‐sectional study. Lancet Neurol. 2012;11:1039–1047. [DOI] [PMC free article] [PubMed] [Google Scholar]
- 8. Salat DH, Tuch DS, Hevelone ND, Fischl B, Corkin S, Rosas HD, Dale AM. Age‐related changes in prefrontal white matter measured by diffusion tensor imaging. Ann N Y Acad Sci. 2005;1064:37–49. [DOI] [PubMed] [Google Scholar]
- 9. Ly M, Canu E, Xu G, Oh J, McLaren DG, Dowling NM, Alexander AL, Sager MA, Johnson SC, Bendlin BB. Midlife measurements of white matter microstructure predict subsequent regional white matter atrophy in healthy adults. Hum Brain Mapp. 2014;35:2044–2054. [DOI] [PMC free article] [PubMed] [Google Scholar]
- 10. Maillard P, Fletcher E, Lockhart SN, Roach AE, Reed B, Mungas D, DeCarli C, Carmichael OT. White matter hyperintensities and their penumbra lie along a continuum of injury in the aging brain. Stroke. 2014;45:1721–1726. [DOI] [PMC free article] [PubMed] [Google Scholar]
- 11. Maillard P, Carmichael O, Harvey D, Fletcher E, Reed B, Mungas D, DeCarli C. FLAIR and diffusion MRI signals are independent predictors of white matter hyperintensities. AJNR Am J Neuroradiol. 2013;34:54–61. [DOI] [PMC free article] [PubMed] [Google Scholar]
- 12. Maillard P, Fletcher E, Harvey D, Carmichael O, Reed B, Mungas D, DeCarli C. White matter hyperintensity penumbra. Stroke. 2011;42:1917–1922. [DOI] [PMC free article] [PubMed] [Google Scholar]
- 13. Swan GE, DeCarli C, Miller BL, Reed T, Wolf PA, Jack LM, Carmelli D. Association of midlife blood pressure to late‐life cognitive decline and brain morphology. Neurology. 1998;51:986–993. [DOI] [PubMed] [Google Scholar]
- 14. van Dijk EJ, Breteler MM, Schmidt R, Berger K, Nilsson LG, Oudkerk M, Pajak A, Sans S, de Ridder M, Dufouil C, Fuhrer R, Giampaoli S, Launer LJ, Hofman A. The association between blood pressure, hypertension, and cerebral white matter lesions: cardiovascular determinants of dementia study. Hypertension. 2004;44:625–630. [DOI] [PubMed] [Google Scholar]
- 15. van Dijk EJ, Prins ND, Vrooman HA, Hofman A, Koudstaal PJ, Breteler MM. Progression of cerebral small vessel disease in relation to risk factors and cognitive consequences: Rotterdam Scan study. Stroke. 2008;39:2712–2719. [DOI] [PubMed] [Google Scholar]
- 16. Debette S, Seshadri S, Beiser A, Au R, Himali JJ, Palumbo C, Wolf PA, DeCarli C. Midlife vascular risk factor exposure accelerates structural brain aging and cognitive decline. Neurology. 2011;77:461–468. [DOI] [PMC free article] [PubMed] [Google Scholar]
- 17. Gottesman RF, Coresh J, Catellier DJ, Sharrett AR, Rose KM, Coker LH, Shibata DK, Knopman DS, Jack CR, Mosley TH. Blood pressure and white‐matter disease progression in a biethnic cohort: Atherosclerosis Risk in Communities (ARIC) study. Stroke. 2010;41:3–8. [DOI] [PMC free article] [PubMed] [Google Scholar]
- 18. Knopman DS, Penman AD, Catellier DJ, Coker LH, Shibata DK, Sharrett AR, Mosley TH Jr. Vascular risk factors and longitudinal changes on brain MRI: the ARIC study. Neurology. 2011;76:1879–1885. [DOI] [PMC free article] [PubMed] [Google Scholar]
- 19. Knopman DS, Mosley TH, Catellier DJ, Sharrett AR. Cardiovascular risk factors and cerebral atrophy in a middle‐aged cohort. Neurology. 2005;65:876–881. [DOI] [PubMed] [Google Scholar]
- 20. Launer LJ, Lewis CE, Schreiner PJ, Sidney S, Battapady H, Jacobs DR, Lim KO, D'Esposito M, Zhang Q, Reis J, Davatzikos C, Bryan RN. Vascular factors and multiple measures of early brain health: CARDIA brain MRI study. PLoS One. 2015;10:e0122138. [DOI] [PMC free article] [PubMed] [Google Scholar]
- 21. Knopman DS, Griswold ME, Lirette ST, Gottesman RF, Kantarci K, Sharrett AR, Jack CR Jr, Graff‐Radford J, Schneider AL, Windham BG, Coker LH, Albert MS, Mosley TH Jr. Vascular imaging abnormalities and cognition: mediation by cortical volume in nondemented individuals: Atherosclerosis Risk in Communities‐neurocognitive study. Stroke. 2015;46:433–440. [DOI] [PMC free article] [PubMed] [Google Scholar]
- 22. Vemuri P, Gunter JL, Senjem ML, Whitwell JL, Kantarci K, Knopman DS, Boeve BF, Petersen RC, Jack CR Jr. Alzheimer's disease diagnosis in individual subjects using structural MR images: validation studies. Neuroimage. 2008;39:1186–1197. [DOI] [PMC free article] [PubMed] [Google Scholar]
- 23. Raz L, Jayachandran M, Tosakulwong N, Lesnick TG, Wille SM, Murphy MC, Senjem ML, Gunter JL, Vemuri P, Jack CR Jr, Miller VM, Kantarci K. Thrombogenic microvesicles and white matter hyperintensities in postmenopausal women. Neurology. 2013;80:911–918. [DOI] [PMC free article] [PubMed] [Google Scholar]
- 24. Jack CR Jr, Wiste HJ, Weigand SD, Rocca WA, Knopman DS, Mielke MM, Lowe VJ, Senjem ML, Gunter JL, Preboske GM, Pankratz VS, Vemuri P, Petersen RC. Age‐specific population frequencies of cerebral beta‐amyloidosis and neurodegeneration among people with normal cognitive function aged 50–89 years: a cross‐sectional study. Lancet Neurol. 2014;13:997–1005. [DOI] [PMC free article] [PubMed] [Google Scholar]
- 25. Siedel J, Hagele EO, Ziegenhorn J, Wahlefeld AW. Reagent for the enzymatic determination of serum total cholesterol with improved lipolytic efficiency. Clin Chem. 1983;29:1075–1080. [PubMed] [Google Scholar]
- 26. Nagele U, Hagele EO, Sauer G, Wiedemann E, Lehmann P, Wahlefeld AW, Gruber W. Reagent for the enzymatic determination of serum total triglycerides with improved lipolytic efficiency. J Clin Chem Clin Biochem. 1984;22:165–174. [DOI] [PubMed] [Google Scholar]
- 27. Patsch W, Brown SA, Morrisett JD, Gotto AM Jr, Patsch JR. A dual‐precipitation method evaluated for measurement of cholesterol in high‐density lipoprotein subfractions HDL2 and HDL3 in human plasma. Clin Chem. 1989;35:265–270. [PubMed] [Google Scholar]
- 28. Warnick GR, Benderson J, Albers JJ. Dextran sulfate‐Mg2+ precipitation procedure for quantitation of high‐density‐lipoprotein cholesterol. Clin Chem. 1982;28:1379–1388. [PubMed] [Google Scholar]
- 29. McNamara JR, Cohn JS, Wilson PW, Schaefer EJ. Calculated values for low‐density lipoprotein cholesterol in the assessment of lipid abnormalities and coronary disease risk. Clin Chem. 1990;36:36–42. [PubMed] [Google Scholar]
- 30. Stein MW. Clinical Methods of Enzymatic Analysis. New York: Academic Press; 1965. [Google Scholar]
- 31. White IR, Royston P, Wood AM. Multiple imputation using chained equations: issues and guidance for practice. Stat Med. 2011;30:377–399. [DOI] [PubMed] [Google Scholar]
- 32. Power MC, Schneider AL, Wruck L, Griswold M, Coker LH, Alonso A, Jack CR Jr, Knopman D, Mosley TH, Gottesman RF. Life‐course blood pressure in relation to brain volumes. Alzheimers Dement. 2016;12:890–899. [DOI] [PMC free article] [PubMed] [Google Scholar]
- 33. Hernan MA, Brumback B, Robins JM. Marginal structural models to estimate the causal effect of zidovudine on the survival of HIV‐positive men. Epidemiology. 2000;11:561–570. [DOI] [PubMed] [Google Scholar]
- 34. Gons RA, van Oudheusden LJ, de Laat KF, van Norden AG, van Uden IW, Norris DG, Zwiers MP, van Dijk E, de Leeuw FE. Hypertension is related to the microstructure of the corpus callosum: the RUN DMC study. J Alzheimers Dis. 2012;32:623–631. [DOI] [PubMed] [Google Scholar]
- 35. Kennedy KM, Raz N. Pattern of normal age‐related regional differences in white matter microstructure is modified by vascular risk. Brain Res. 2009;1297:41–56. [DOI] [PMC free article] [PubMed] [Google Scholar]
- 36. Burgmans S, van Boxtel MP, Gronenschild EH, Vuurman EF, Hofman P, Uylings HB, Jolles J, Raz N. Multiple indicators of age‐related differences in cerebral white matter and the modifying effects of hypertension. Neuroimage. 2010;49:2083–2093. [DOI] [PMC free article] [PubMed] [Google Scholar]
- 37. Salat DH, Williams VJ, Leritz EC, Schnyer DM, Rudolph JL, Lipsitz LA, McGlinchey RE, Milberg WP. Inter‐individual variation in blood pressure is associated with regional white matter integrity in generally healthy older adults. Neuroimage. 2012;59:181–192. [DOI] [PMC free article] [PubMed] [Google Scholar]
- 38. Jacobs HI, Leritz EC, Williams VJ, Van Boxtel MP, van der Elst W, Jolles J, Verhey FR, McGlinchey RE, Milberg WP, Salat DH. Association between white matter microstructure, executive functions, and processing speed in older adults: the impact of vascular health. Hum Brain Mapp. 2013;34:77–95. [DOI] [PMC free article] [PubMed] [Google Scholar]
- 39. Leritz EC, Salat DH, Milberg WP, Williams VJ, Chapman CE, Grande LJ, Rudolph JL, Schnyer DM, Barber CE, Lipsitz LA, McGlinchey RE. Variation in blood pressure is associated with white matter microstructure but not cognition in African Americans. Neuropsychology. 2010;24:199–208. [DOI] [PMC free article] [PubMed] [Google Scholar]
- 40. Hannesdottir K, Nitkunan A, Charlton RA, Barrick TR, MacGregor GA, Markus HS. Cognitive impairment and white matter damage in hypertension: a pilot study. Acta Neurol Scand. 2009;119:261–268. [DOI] [PubMed] [Google Scholar]
- 41. Nitkunan A, Charlton RA, McIntyre DJ, Barrick TR, Howe FA, Markus HS. Diffusion tensor imaging and MR spectroscopy in hypertension and presumed cerebral small vessel disease. Magn Reson Med. 2008;59:528–534. [DOI] [PubMed] [Google Scholar]
- 42. Maclullich AM, Ferguson KJ, Reid LM, Deary IJ, Starr JM, Seckl JR, Bastin ME, Wardlaw JM. Higher systolic blood pressure is associated with increased water diffusivity in normal‐appearing white matter. Stroke. 2009;40:3869–3871. [DOI] [PubMed] [Google Scholar]
- 43. Hsu J‐L, Chen Y‐L, Leu J‐G, Jaw F‐S, Lee C‐H, Tsai Y‐F, Hsu C‐Y, Bai C‐H, Leemans A. Microstructural white matter abnormalities in type 2 diabetes mellitus: a diffusion tensor imaging study. Neuroimage. 2012;59:1098–1105. [DOI] [PubMed] [Google Scholar]
- 44. Yau PL, Javier DC, Ryan CM, Tsui WH, Ardekani BA, Ten S, Convit A. Preliminary evidence for brain complications in obese adolescents with type 2 diabetes mellitus. Diabetologia. 2010;53:2298–2306. [DOI] [PMC free article] [PubMed] [Google Scholar]
- 45. Yau PL, Kluger A, Borod JC, Convit A. Neural substrates of verbal memory impairments in adults with type 2 diabetes mellitus. J Clin Exp Neuropsychol. 2014;36:74–87. [DOI] [PMC free article] [PubMed] [Google Scholar]
- 46. Hoogenboom WS, Marder TJ, Flores VL, Huisman S, Eaton HP, Schneiderman JS, Bolo NR, Simonson DC, Jacobson AM, Kubicki M, Shenton ME, Musen G. Cerebral white matter integrity and resting‐state functional connectivity in middle‐aged patients with type 2 diabetes. Diabetes. 2014;63:728–738. [DOI] [PMC free article] [PubMed] [Google Scholar]
- 47. Wang R, Fratiglioni L, Laukka EJ, Lovden M, Kalpouzos G, Keller L, Graff C, Salami A, Backman L, Qiu C. Effects of vascular risk factors and APOE epsilon4 on white matter integrity and cognitive decline. Neurology. 2015;84:1128–1135. [DOI] [PMC free article] [PubMed] [Google Scholar]
- 48. Falvey CM, Rosano C, Simonsick EM, Harris T, Strotmeyer ES, Satterfield S, Yaffe K; Study ftHA . Macro‐ and microstructural magnetic resonance imaging indices associated with diabetes among community‐dwelling older adults. Diabetes Care. 2013;36:677–682. [DOI] [PMC free article] [PubMed] [Google Scholar]
- 49. Lou B, Chen M, Luo X, Dai Y. Reduced right frontal fractional anisotropy correlated with early elevated plasma LDL levels in obese young adults. PLoS One. 2014;9:e108180. [DOI] [PMC free article] [PubMed] [Google Scholar]
- 50. Cohen JI, Cazettes F, Convit A. Abnormal cholesterol is associated with prefrontal white matter abnormalities among obese adults: a diffusion tensor imaging study. Neuroradiol J. 2011;24:854–861. [DOI] [PubMed] [Google Scholar]
- 51. Williams VJ, Leritz EC, Shepel J, McGlinchey RE, Milberg WP, Rudolph JL, Lipsitz LA, Salat DH. Interindividual variation in serum cholesterol is associated with regional white matter tissue integrity in older adults. Hum Brain Mapp. 2013;34:1826–1841. [DOI] [PMC free article] [PubMed] [Google Scholar]
Associated Data
This section collects any data citations, data availability statements, or supplementary materials included in this article.
Supplementary Materials
Data S1. Supplemental methods: Magnetic resonance imaging scan parameters and processing.
Table S1. Unweighted Characteristics Eligible ARIC‐NCS Sample Participants at Visits 1 and 5 (n=1851)
Table S2. Number of Eligible ARIC‐NCS Sample Participants Missing Covariate or Exposure Data at Visit 1 or 5
Table S3. Adjusted Associations Between a 10‐U Increase in the Level of Each Vascular Risk Factor ≈24 Years Prior to or Concurrent With Magnetic Resonance Imaging (MRI) and Standardized Measures of Overall White Matter Microstructural Integrity on Diffusion MRI in ARIC‐NCS
Table S4. Adjusted Difference in Total Fractional Anisotropy by Category of Vascular Risk Factors Measured at Visit 1 or 5
Table S5. Adjusted Difference in Total Mean Diffusivity by Category of Vascular Risk Factors Measured at Visit 1 or 5
Figure S1. Comparison of the primary analyses of the association of triglycerides with regional and total fractional anisotropy with sensitivity analysis considering different adjustment sets.
Figure S2. Comparison of the primary analyses of the association of trigylcerides with regional and total fractional anisotropy with sensitivity analyses considering the influence of weighting, attrition, or missing covariate or exposure data.
Figure S3. Comparison of the primary analyses of the association of trigylcerides with regional and total mean diffusivity with sensitivity analyses considering different adjustment sets.
Figure S4. Comparison of the primary analyses of the association of trigylcerides with regional and total mean diffusivity with sensitivity analyses considering the influence of weighting, attrition, or missing covariate or exposure data.
Figure S5. Comparison of the primary analyses of the association of low‐density lipoprotein cholesterol with regional and total fractional anisotropy with sensitivity analyses considering different adjustment sets.
Figure S6. Comparison of the primary analyses of the association of low‐density lipoprotein cholesterol with regional and total fractional anisotropy with sensitivity analyses considering the influence of weighting, attrition, or missing covariate or exposure data.
Figure S7. Comparison of the primary analyses of the association of low‐density lipoprotein cholesterol with regional and total mean diffusivity with sensitivity analyses considering different adjustment sets.
Figure S8. Comparison of the primary analyses of the association of low‐density lipoprotein cholesterol with regional and total mean diffusivity with sensitivity analyses considering the influence of weighting, attrition, or missing covariate or exposure data.
Figure S9. Comparison of the primary analyses of the association of high‐density lipoprotein cholesterol with regional and total fractional anisotropy with sensitivity analyses considering different adjustment sets.
Figure S10. Comparison of the primary analyses of the association of high‐density lipoprotein cholesterol with regional and total fractional anisotropy with sensitivity analyses considering the influence of weighting, attrition, or missing covariate or exposure data.
Figure S11. Comparison of the primary analyses of the association of high‐density lipoprotein cholesterol with regional and total mean diffusivity with sensitivity analyses considering different adjustment sets.
Figure S12. Comparison of the primary analyses of the association of high‐density lipoprotein cholesterol with regional and total mean diffusivity with sensitivity analyses considering the influence of weighting, attrition, or missing covariate or exposure data.
Figure S13. Comparison of the primary analyses of the association of total cholesterol with regional and total fractional anisotropy with sensitivity analyses considering different adjustment sets.
Figure S14. Comparison of the primary analyses of the association of total cholesterol with regional and total fractional anisotropy with sensitivity analyses considering the influence of weighting, attrition, or missing covariate or exposure data.
Figure S15. Comparison of the primary analyses of the association of total cholesterol with regional and total mean diffusivity with sensitivity analyses considering different adjustment sets.
Figure S16. Comparison of the primary analyses of the association of total cholesterol with regional and total mean diffusivity with sensitivity analyses considering the influence of weighting, attrition, or missing covariate or exposure data.
Figure S17. Comparison of the primary analyses of the association of glucose with regional and total fractional anisotropy with sensitivity analyses considering different adjustment sets.
Figure S18. Comparison of the primary analyses of the association of glucose with regional and total fractional anisotropy with sensitivity analyses considering the influence of weighting, attrition, or missing covariate or exposure data.
Figure S19. Comparison of the primary analyses of the association of glucose with regional and total mean diffusivity with sensitivity analyses considering different adjustment sets.
Figure S20. Comparison of the primary analyses of the association of glucose with regional and total mean diffusivity with sensitivity analyses considering the influence of weighting, attrition, or missing covariate or exposure data.
Figure S21. Comparison of the primary analyses of the association of diastolic blood pressure with regional and total fractional anisotropy with sensitivity analyses considering different adjustment sets.
Figure S22. Comparison of the primary analyses of the association of diastolic blood pressure with regional and total fractional anisotropy with sensitivity analyses considering the influence of weighting, attrition, or missing covariate or exposure data.
Figure S23. Comparison of the primary analyses of the association of diastolic blood pressure with regional and total mean diffusivity with sensitivity analyses considering different adjustment sets.
Figure S24. Comparison of the primary analyses of the association of diastolic blood pressure with regional and total mean diffusivity with sensitivity analyses considering the influence of weighting, attrition, or missing covariate or exposure data.
Figure S25. Comparison of the primary analyses of the association of systolic blood pressure with regional and total fractional anisotropy with sensitivity analyses considering different adjustment sets.
Figure S26. Comparison of the primary analyses of the association of systolic blood pressure with regional and total fractional anisotropy with sensitivity analyses considering the influence of weighting, attrition, or missing covariate or exposure data.
Figure S27. Comparison of the primary analyses of the association of systolic blood pressure with regional and total mean diffusivity with sensitivity analyses considering different adjustment sets.
Figure S28. Comparison of the primary analyses of the association of systolic blood pressure with regional and total mean diffusivity with sensitivity analyses considering the influence of weighting, attrition, or missing covariate or exposure data.
Figure S29. The adjusted association between triglycerides at visit 1 or 5 and measures of total white matter integrity by decile of intracranial‐volume standardized white matter hyperintensity volumes.
Figure S30. The adjusted association between low‐density lipoprotein cholesterol at visit 1 or 5 and measures of white matter integrity by decile of intracranial‐volume standardized white matter hyperintensity volumes.
Figure S31. The adjusted association between high‐density lipoprotein cholesterol at visit 1 or 5 and measures of white matter integrity by decile of intracranial‐volume standardized white matter hyperintensity volumes.
Figure S32. The adjusted association between total cholesterol at visit 1 or 5 and measures of white matter integrity by decile of intracranial‐volume standardized white matter hyperintensity volumes.