

Abstract
Background
Plaque erosion causes 30% of ST‐segment elevation myocardial infarctions, but the underlying cause is unknown. Inflammatory infiltrates are less abundant in erosion compared with rupture in autopsy studies. We hypothesized that erosion and rupture are associated with significant differences in intracoronary cytokines in vivo.
Methods and Results
Forty ST‐segment elevation myocardial infarction patients with <6 hours of chest pain were classified as ruptured fibrous cap (RFC) or intact fibrous cap (IFC) using optical coherence tomography. Plasma samples from the infarct‐related artery and a peripheral artery were analyzed for expression of 102 cytokines using arrays; results were confirmed with ELISA. Thrombectomy samples were analyzed for differential mRNA expression using quantitative real‐time polymerase chain reaction. Twenty‐three lesions were classified as RFC (58%), 15 as IFC (38%), and 2 were undefined (4%). In addition, 12% (12 of 102) of cytokines were differentially expressed in both coronary and peripheral plasma. I‐TAC was preferentially expressed in RFC (significance analysis of microarrays adjusted P<0.001; ELISA IFC 10.2 versus RFC 10.8 log2 pg/mL; P=0.042). IFC was associated with preferential expression of epidermal growth factor (significance analysis of microarrays adjusted P<0.001; ELISA IFC 7.42 versus RFC 6.63 log2 pg/mL, P=0.036) and thrombospondin 1 (significance analysis of microarrays adjusted P=0.03; ELISA IFC 10.4 versus RFC 8.65 log2 ng/mL, P=0.0041). Thrombectomy mRNA showed elevated I‐TAC in RFC (P=0.0007) epidermal growth factor expression in IFC (P=0.0264) but no differences in expression of thrombospondin 1.
Conclusions
These results demonstrate differential intracoronary cytokine expression in RFC and IFC. Elevated thrombospondin 1 and epidermal growth factor may play an etiological role in erosion.
Keywords: coronary artery disease, erosion, inflammation, myocardial infarction, optical coherence tomography, thrombospondin 1
Subject Categories: Inflammation, Optical Coherence Tomography (OCT), Percutaneous Coronary Intervention, Myocardial Infarction, Biomarkers
Introduction
Plaque erosion is a major cause of ST‐segment elevation myocardial infarction (STEMI), accounting for ≈30% to 40% of cases,1, 2, 3 yet little is known about the triggers for this pathological process, in contrast to a more detailed understanding of the complex inflammatory processes leading to atherosclerotic plaque rupture.4 There is increasing interest in plaque erosion, and tailored treatments for this pathology are being tested.5
Autopsy studies suggest that markers of inflammation are significantly lower in plaque erosion compared with plaque rupture, with sparse infiltration of macrophages and T lymphocytes within the vessel wall.6, 7 Other studies, however, have suggested an important role for neutrophil infiltrates at sites of plaque erosion.8 Demonstrating inflammatory profiles of patients that are concordant with autopsy data is important to validate clinical research aiming to identify the triggers of plaque erosion. Nevertheless, evidence that inflammatory differences between erosion and rupture are detectable in patients at the time of myocardial infarction is contradictory.9, 10, 11 We designed a study to optimize the assessment of intracoronary inflammation in patients with STEMI by using multiplex arrays to screen a wide range of inflammatory mediators in plasma samples taken from the culprit vessel. We hypothesized that differential cytokine expression would provide insights into the underlying cause of plaque erosion and could validate our methodology as an approach to studying the etiology of plaque erosion.
Methods
Study Design and Population
We prospectively enrolled consecutive patients undergoing primary percutaneous coronary intervention for STEMI at the Norfolk and Norwich University Hospital. All patients provided written informed consent, and the study was approved by the local ethics committee. Eligible patients included those presenting within 6 hours of the onset of pain, with ST‐segment elevation of >1 mm in at least 2 contiguous leads, new left bundle‐branch block, or true posterior myocardial infarction on the 12‐lead ECG. Exclusion criteria were mechanical ventilation, cardiogenic shock, stent thrombosis, failed thrombectomy, renal insufficiency (estimated glomerular filtration rate <30 mL/min per 1.73 m2) and failed optical coherence tomography (OCT) imaging of the culprit lesion. All patients received prehospital aspirin 300 mg and clopidogrel 600 mg. All aspects of the primary percutaneous coronary intervention procedure were at the discretion of the interventionalist responsible for the patient's procedure. Gentle predilatation (≤2.0 mm) was permitted to facilitate passage of the OCT catheter.
Blood and Thrombectomy Samples
Thrombectomy was performed in all patients (Pronto catheter; Aquilant International), and aspirates were filtered to separate particulate matter (thrombus with or without plaque fragments) and blood. Particulate matter was stored in Allprotect tissue reagent (Qiagen GmbH) at −70°C. Coronary and peripheral plasma were stored at −70°C.
Clinical and Angiographic Data
Baseline demographics, patient characteristics, angiographic data, procedural details, and clinical outcomes up to 12 months were recorded for each patient. Quantitative coronary angiography was performed using the Quantitative Vascular Analysis package (Siemens) by 2 independent operators.
Optical Coherence Tomography
OCT of the culprit lesion was performed after thrombectomy using a Frequency Domain OCT System (C7‐XRTM OCT Intravascular Imaging System; St Jude Medical). OCT images were anonymized and analyzed on a St Jude OCT Offline Review Workstation by 3 independent observers (S.C., P.C., and A.R.) blinded to other data. Established definitions of plaque pathology (ruptured fibrous cap [RFC] and intact fibrous cap [IFC]), plaque constituents and thrombus types were used.11, 12 Discordant results were resolved by consensus or categorized as undefined. Measurements were performed with dedicated OCT system software (B.0.1; Light Lab Imaging). Minimum fibrous cap thickness was measured at the thinnest point of the cap, whereas mean cap thickness was computed as the mean of 3 evenly distributed measurements along the fibrous cap.
Cytokine Arrays
Coronary and peripheral arterial plasma samples were analyzed using the Proteome Profiler Human XL Cytokine Array Kit (ARY022; R&D Systems), according to the manufacturer's instructions. Quantification of cytokine optical densities were obtained with the HLImage++ software (Western Vision).
ELISA
ELISAs for epidermal growth factor (EGF; DEG00; R&D Systems), interferon‐inducible T‐cell alpha chemoattractant (I‐TAC; DCX110; R&D Systems), monokine induced by γ‐interferon (DCX900; R&D Systems), myeloperoxidase (DMYE00B; R&D Systems), and thrombospondin 1 (TSP‐1; DTSP10; R&D Systems) were performed according to the manufacturer's instructions.
Thrombectomy Analysis
Total RNA was extracted from homogenized thrombectomy specimens using the ReliaPrep RNA extraction kit (Promega). Reverse transcription was performed using a cDNA synthesis Kit (PCR Biosystems). Relative quantitative real‐time polymerase chain reaction used SYBR green technology (PCR Biosystems) on cDNA reverse transcribed from purified RNA. After preamplification (95°C for 2 minutes), the PCRs were amplified for 45 cycles (95°C for 15 seconds, 60°C for 10 seconds, and 72°C for 10 seconds) on a 384‐well LightCycler 480 (Roche). mRNA was analyzed for EGF, myeloperoxidase, I‐TAC, and TSP1 expression and normalized to GAPDH or β‐actin mRNA expression using the comparative cycle threshold method. Primer sequences were designed using KicqStart (Sigma‐Aldrich).
Primer sequences for quantitative real‐time polymerase chain reaction were as follows (forward/reverse): β‐actin, gacgacatggagaaaatctg/atgatctgggtcatcttctc; EGF, ggtggtgaagttgatctaaag/tagcatgtgttgagattctg; GAPDH, ctccttgttcgacagtcagcc/gactccgaccttcaccttcc; I‐TAC, ctacagttgttcaaggcttc/cactttcactgcttttaccc; myeloperoxidase, ccatggaactcctatcctac/ttgacttggacaacacattc; TSP‐1, gtgactgaagagaacaaagag/cagctatcaacagtccattc.
Cytokine Array Analysis
Intensities of the negative control of each sample were subtracted from the intensity of each cytokine‐sample pair,13 and relative intensity values were quantile‐normalized.14 To allow for direct comparisons to be made between cytokines, values were log2 transformed. Differential expression was assessed using the significance analysis of microarrays method,15 with P values corrected for multiple testing using the Benjamini–Hochberg procedure.16 The output of this included assignment to either a group comprising cytokines with an average expression higher in patients with IFC or a group comprising cytokines with an average expression higher in patients with RFC. Significance analysis of microarrays was conducted for coronary and peripheral blood samples separately. A differential expression score (D‐score) and average log2 fold change in expression were captured for each cytokine in addition to the adjusted P value. Analyses were performed in the R statistical language environment, version 3.1.2, using several Bioconductor packages.17
Statistical Analysis
Continuous variables were reported as median and first to third quartiles. Categorical data were reported as numbers and relative percentages. Overall comparisons across groups were based on the nonparametric Wilcoxon rank sum test for continuous variables and the Fisher exact test for categorical variables. All P values are 2‐sided. P values were corrected for multiple testing using the Benjamini–Hochberg procedure.16 Adjusted P values <0.05 were considered significant unless otherwise stated.
Results
Baseline and Angiographic Characteristics
Between February 2, 2015, and October 14, 2015, 40 STEMI patients were recruited into the Plaque Erosion Pilot Study (Figure 1), representing ≈30% of all potentially eligible patients. An additional 5 patients were not enrolled in the study because of unsuitable anatomy and inability to obtain adequate OCT images. A fully identifiable culprit plaque was adjudicated in 38 patients, with RFC identified in 23 (57.5%) and IFC in 15 (37.5%); 2 (5%) were undefined (Figure 2).
Figure 1.
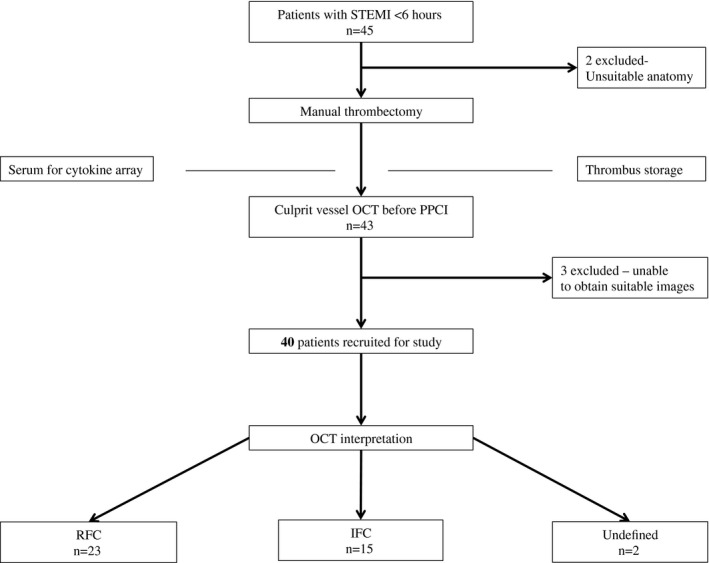
Study enrollment. IFC indicates intact fibrous cap; OCT, optical coherence tomography; PPCI, primary percutaneous coronary intervention; RFC, ruptured fibrous cap; STEMI, ST‐segment elevation myocardial infarction.
Figure 2.
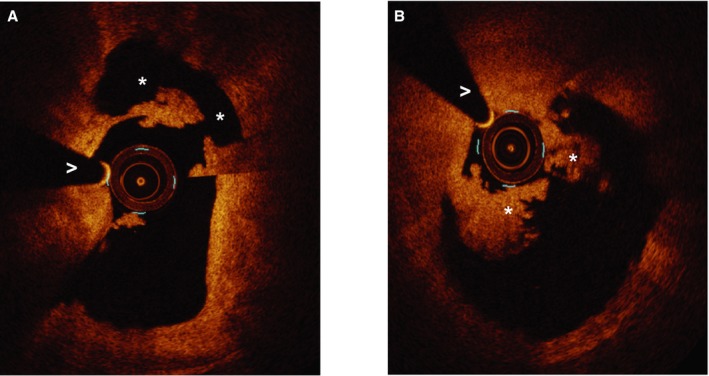
Ruptured and intact fibrous cap appearance using optical coherence tomography. A, Ruptured fibrous cap. *Rupture cavity. >Wire artifact. B, Intact fibrous cap.*Thrombus. >Wire artifact.
There were no differences in baseline characteristics between patients with RFC and IFC (Table 1). Both groups had very similar ischemic times and angiographic findings. Although there was lower use of stents in the IFC group, this result was nonsignificant (78.3% RFC versus 53.3% IFC, adjusted P=0.88) (Table 2).
Table 1.
Baseline Characteristics
| RFC (n=23) | IFC (n=15) | P Value | Adjusted P Value | |
|---|---|---|---|---|
| Age, y | 65 (59.5–75) | 60 (52–64.5) | 0.03 | 0.36 |
| Sex (male) | 16 (69.6) | 10 (66.7%) | 1.00 | 1.00 |
| Hypertension | 8 (34.8%) | 3 (20%) | 0.47 | 0.71 |
| Hyperlipidemia | 8 (34.8%) | 4 (26.7%) | 0.44 | 0.71 |
| Smoker | 12 (52.2%) | 8 (53.3%0 | 1.00 | 1.00 |
| Diabetes mellitus | 0 (0%) | 2 (13.3%) | 0.15 | 0.60 |
| Previous MI | 0 (0%) | 0 (0%) | … | … |
| Previous PCI | 0 (0%) | 0 (0%) | … | … |
| Symptom onset to lab, minutes | 160 (125–207.5) | 190 (145–247.5) | 0.24 | 0.71 |
| Door to balloon time, minutes | 37 (29–61) | 44 (29–46) | 0.47 | 0.71 |
| Call to balloon time, minutes | 125 (95–147) | 134 (99–142) | 0.71 | 0.95 |
| Killip class | 0.15 | 0.60 | ||
| Class 1 | 23 (100%) | 13 (86.7%) | ||
| Class 2 | 0 (0%) | 2 (13.3%) | ||
| TIMI risk score | 2 (1–4) | 2 (1–2) | 0.46 | 0.71 |
| Anemia | 0 (0%) | 0 (0%) | 1.00 | 1.00 |
Values are median (first to third quartile) or n (%). Both unadjusted and Benjamini–Hochberg‐adjusted P values are shown. IFC indicates intact fibrous cap; MI, myocardial infarction; PCI, percutaneous coronary intervention; RFC, ruptured fibrous cap; TIMI, Thrombolysis in Myocardial Infarction.
Table 2.
Angiographic and Procedural Characteristics
| RFC (n=23) | IFC (n=15) | P Value | Adjusted P Value | |
|---|---|---|---|---|
| Number of lesions treated | 1.00 | 1.00 | ||
| 1 | 22 (95.7%) | 15 (100%) | ||
| 2 | 1 (4.3%) | 0 (0%) | ||
| Infarct related artery | 0.64 | 0.94 | ||
| LAD | 7 (30.4%) | 9 (60%) | ||
| LCX | 4 (17.4%) | 2 (13.3%) | ||
| RCA | 12 (52.2%) | 4 (26.7%) | ||
| Multivessel disease | 9 (39.1%) | 4 (26.7%) | 0.5 | 0.88 |
| Thrombectomy | 23 (100%) | 15 (100%) | 1.00 | 1.00 |
| Gp2b3a use | 9 (39.1%) | 8 (53.3%) | 0.51 | 0.88 |
| Radial access | 23 (100%) | 14 (93.3%) | 0.39 | 0.88 |
| Stent used | 18 (78.3%) | 8 (53.3%) | 0.16 | 0.88 |
| Total stent length, mm | 27 (22–38) | 23 (17–28) | 0.06 | 0.88 |
| Drug coated balloon angioplasty | 5 (21.7%) | 6 (40%) | 0.28 | 0.88 |
| Direct stenting | 11 (47.8%) | 5 (33.3%) | 0.51 | 0.88 |
| Maximum balloon/stent diameter, mm | 4 (3.375–4) | 3.5 (3.125–3.875) | 0.20 | 0.88 |
| Base TIMI flow | 0.63 | 0.94 | ||
| 0 | 14 (60.9%) | 10 (66.7%) | ||
| 1 | 0 (0%) | 0 (0%) | ||
| 2 | 3 (13.3%) | 3 (20%) | ||
| 3 | 6 (26.8%) | 2 (13.3%) | ||
| Final TIMI flow | 0.82 | 1.00 | ||
| 0 | 0 (0%) | 0 (0%) | ||
| 1 | 1 (4.3%) | 0 (0%) | ||
| 2 | 0 (0%) | 0 (0%) | ||
| 3 | 22 (95.6%) | 15 (100%) | ||
| Procedural success | 22 (95.6%) | 15 (100%) | ||
| QCA at baseline | ||||
| Reference vessel diameter, mm | 3.28 (2.81–3.62) | 3.17 (2.73–3.33) | 0.44 | 0.88 |
| Minimal luminal diameter, mm | 0 (0–0.97) | 0 (0–0.84) | 0.96 | 1.00 |
| Diameter stenosis (%) | 100 (75.6–100) | 100 (75.2–100) | 0.88 | 1.00 |
| QCA after thrombectomy | ||||
| Reference vessel diameter, mm | 3.38 (2.85–3.76) | 3.22 (2.58–3.49) | 0.39 | 0.88 |
| Minimal luminal diameter | 1.1 (0.88–1.45) | 0.94 (0.7–1.2) | 0.40 | 0.88 |
| Diameter stenosis | 66.5 (46.4–77.3) | 68.8 (62.3–73.6) | 0.75 | 1.00 |
Values are median (first to third quartile) or n (%). Both unadjusted and Benjamini–Hochberg‐adjusted P values are shown. Gp2b3a indicates glycoproteinIIbIIIa; IFC, intact fibrous cap; LAD, left anterior descending; LCX, left circumflex; QCA, quantitative coronary angiography; RCA, right coronary artery; RFC, ruptured fibrous cap; TIMI, Thrombolysis in Myocardial Infarction.
Optical Coherence Tomography Data
Cap thickness was significantly lower in the RFC group (minimum cap thickness: RFC 40 μm [range 30–40 μm] versus IFC 80 μm [range 70–95 μm], adjusted P=0.006: mean cap thickness RFC 52 μm [range 40–59 μm] versus IFC 100 μm [range 99–134 μm], adjusted P=0.006) (Table 3). There were no significant differences in other plaque parameters, although there was a trend toward a more fibrous phenotype in IFC. The residual thrombus burden after thrombectomy and thrombus types were similar between groups, with white thrombus and mixed thrombus predominating (Table 3).
Table 3.
OCT Analysis
| RFC (n=23) | IFC (n=15) | P Value | Adjusted P Value | |
|---|---|---|---|---|
| Minimum cap thickness, μm | 40 (30–40) | 80 (70–95) | <0.001 | 0.006 |
| Mean cap thickness, μm | 52 (40–59) | 100 (99–134) | <0.001 | 0.006 |
| Length of lesion, mm | 11.3 (9.75–12.55) | 11.4 (9.9–15.1) | 0.82 | 1 |
| Plaque characteristics | 0.93 | 1 | ||
| Fibrocalcific | 1 (4.34%) | 1 (4.34%) | ||
| Fibrous | 2 (8.7%) | 6 (40%) | ||
| Lipid‐rich | 20 (86.7%) | 8 (53.3%) | ||
| Area stenosis (%) | 79.0 (52.5–83.1) | 74.3 (70.4–77.1) | 0.16 | 0.64 |
| Residual thrombus characteristics | 0.54 | 1 | ||
| Red | 1 (4) | 1 (7) | ||
| White | 12 (52) | 5 (33) | ||
| Mixed | 9 (39) | 5 (33) | ||
| None | 1 (4) | 4 (27) |
Values are median (first to third quartile) or n (%). Both unadjusted and Benjamini–Hochberg‐adjusted P values are shown. IFC indicates intact fibrous cap; RFC, ruptured fibrous cap.
Clinical Outcomes
At 12 months, 1 death occurred in the RFC group and 1 transient ischemic attack in the IFC group, with no statistical differences between the 2 groups.
Cytokine Analysis
Just under 40.2% (41 of 102) of cytokines were more highly expressed on average in patients with IFC than RFC for both coronary and peripheral samples. By contrast, 47.1% (48 of 102) were more highly expressed on average in RFC patients than in IFC patients for both coronary and peripheral samples (Figure 3A and 3B). For the remaining cytokines (12.7%, 13 of 102), preferential expression was discordant between coronary and peripheral samples (Figure 3A and 3B). Despite this, the preferential expressions of cytokines (higher in either RFC or IFC) were, for the most part, consistent between coronary and peripheral samples (odds ratio 46.03, 95% CI 13.33–198.59, P<0.001) (Figure 3B).
Figure 3.
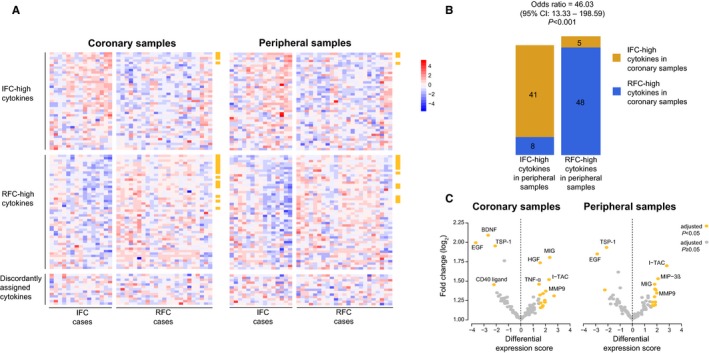
Differential expression analysis of cytokines. A, Heat maps of the cytokines differentially expressed between the 2 plaque pathologies. The coronary samples are shown in the left heat map and peripheral samples on the right heat map. Samples (columns) are sorted from left to right in ascending order within the IFC (left‐hand panels) and RFC (right‐hand panels) groups. The cytokines (rows) are ordered from top to bottom by descending average fold change within the IFC‐assigned cytokine group (top panels), the RFC‐assigned group (middle panels), and discordantly assigned group (bottom panels). Heat map colors represent log2 expression values standardized across the data set. A legend that maps color to standardized expression value is shown to the side of the heat maps. The golden bars on the side of each heat map indicate significant hits. B, Bar plots of concordance between preferential expression assignments for coronary samples and peripheral samples. For peripheral samples, cytokines are stratified by bar: IFC‐high cytokines in the left bar and RFC‐high cytokines in the right bar. For coronary samples, cytokines are stratified by color: IFC‐high cytokines in orange and RFC‐high cytokines in blue. Odds ratio, 95% CI, and P value are reported for Fisher exact test. C, Volcano plots of the log2 fold change of expression for all cytokines against the significance analysis of microarrays differential expression score for the coronary (left plot) and peripheral (right plot) samples. Positive differential expression scores indicate an association to the group more highly expressed in RFC cases than in IFC cases, whereas negative D‐scores represent an association to the group more highly expressed in IFC cases. Cytokines that were significantly associated with either plaque type (adjusted P<0.05; significance analysis of microarrays) are colored in gold, whereas nonsignificant associations are in grey. BDNF indicates brain‐derived neurotrophic factor; EGF, epidermal growth factor; HGF, hepatocyte growth factor; IFC, intact fibrous cap; I‐TAC, interferon‐inducible T cell alpha chemoattractant; MIG, monokine induced by γ‐interferon; MIP‐3α, macrophage inflammatory protein 3α; MMP‐9, matrix metalloprotein 9; MPO, myeloperoxidase; RFC, ruptured fibrous cap; TNFα, tumor necrosis factor α; TSP‐1, thrombospondin 1.
EGF and TSP‐1 were the only molecules with significantly higher expression in IFC patients than in RFC patients in both coronary and peripheral samples (adjusted P<0.05) (Figure 3C). The average log2 fold change in expression was >1.75 for both (Figure 3C). By contrast, 10 molecules demonstrated significant preferential expression in patients with RFC for both coronary and peripheral samples, including monokine induced by γ‐interferon, I‐TAC, matrix metalloproteinase‐9 (MMP‐9), aggrecan, lipocalin 2, interleukin 18 binding protein, trefoil factor 3, complement factor D, RANTES, and adiponectin (adjusted P<0.05) (Figure 3C).
ELISA Validation
For each lesion group, we selected 2 cytokines with significant differential expression in both coronary and peripheral data sets and an average log2 fold change of at least 1.5 (Figure 3C). Therefore, we sought to orthogonally validate higher expressions of EGF and TSP‐1 among IFC cases and monokine induced by γ‐interferon and I‐TAC among rupture cases using ELISA. ELISA for myeloperoxidase was also undertaken, given the potential relevance to plaque erosion.
EGF expression was significantly higher in both coronary and peripheral IFC samples compared with RFC samples (P<0.05) (Figure 4). By contrast, TSP‐1 was significantly higher only in IFC coronary samples (P=0.0041), and I‐TAC was significantly higher only in RFC coronary samples (P=0.042) (Figure 4). No significant differences were observed for monokine induced by γ‐interferon or myeloperoxidase expression between IFC and RFC cases for coronary or peripheral samples (P>0.05).
Figure 4.
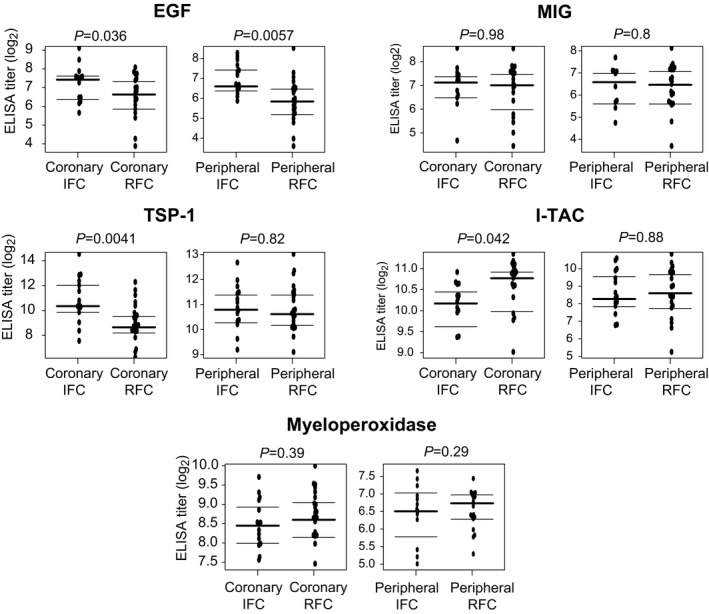
Plasma ELISA analysis. Plasma titers according to plaque pathology and sample site. Horizontal lines indicate median log2 values and interquartile ranges. EGF indicates epidermal growth factor; IFC, intact fibrous cap; I‐TAC, interferon‐inducible T cell alpha chemoattractant; MIG, monokine induced by γ‐interferon; TSP‐1, thrombospondin 1; RFC, ruptured fibrous cap.
Thrombectomy Quantitative Real‐Time Polymerase Chain Reaction Analysis
Thrombectomy yielded an analyzable sample in 18 RFC and 13 IFC cases. Expression of I‐TAC mRNA was significantly increased in RFC samples compared with IFC (P=0.0007), whereas the opposite was true of EGF expression (P=0.0264). There were no differences in the expression of TSP‐1 or myeloperoxidase between groups (P>0.05) (Figure 5).
Figure 5.
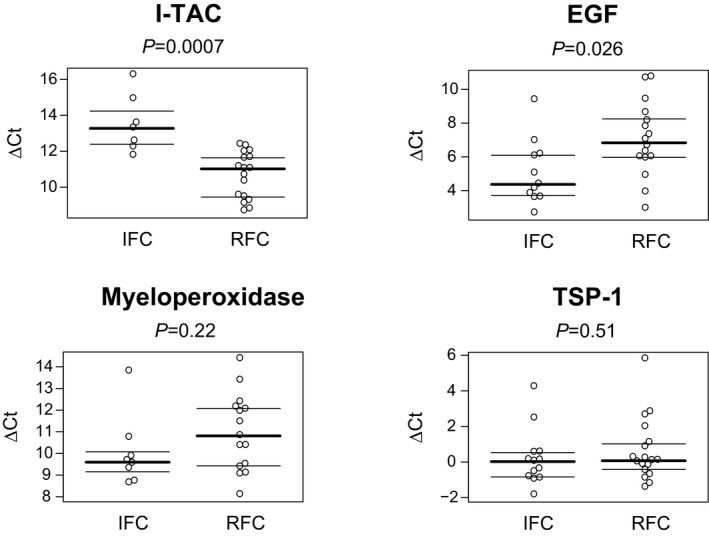
Quantitative real‐time polymerase chain reaction analysis of thrombectomy specimens. Relative mRNA expression in coronary thrombectomy specimens. Lower ΔCt values indicate higher expression. EGF, epidermal growth factor; IFC, intact fibrous cap; I‐TAC, interferon‐inducible T cell alpha chemoattractant; TSP‐1, thrombospondin 1; RFC, ruptured fibrous cap.
Discussion
We detected multiple differences in the inflammatory profiles of IFC and RFC in patients with STEMI, using cytokine arrays. We confirmed elevated EGF and TSP‐1 in IFC and elevated I‐TAC in RFC using ELISAs. Most of these differences were demonstrable only in coronary plasma samples. In addition, we demonstrated that these findings were replicated, with the exception of TSP‐1, in analysis of mRNA in thrombectomy samples. These observations are new and support the concept that different atherosclerotic pathologies may be associated with distinct intracoronary inflammatory profiles.
Previous comparative studies of inflammation in plaque erosion and rupture have yielded conflicting results. Some reports suggest significant elevation of myeloperoxidase in erosion,9, 10 and elevated high‐sensitivity C‐reactive protein and matrix metalloproteinase 9 in rupture.10 In contrast other studies have not found any difference in the levels of myeloperoxidase, thromboxane B2, eosinophilic cationic protein,11 or high‐sensitivity C‐reactive protein.2, 11, 18 Our study is unique in that we sampled both coronary and peripheral arterial plasma, screened a much larger range of inflammatory molecules, and enrolled only patients with short ischemic times presenting with STEMI.
To put our results in context, the levels of EGF, TSP‐1, and I‐TAC in IFC are ≈14‐, 4.8‐, and 1.6‐fold higher, respectively, compared with median values in healthy volunteers reported in other studies.19, 20, 21 The respective values for RFC are ≈8‐, 1.4‐ and 2.4‐fold higher.
The significance of elevated EGF and TSP‐1 in IFC compared with RFC is unclear. Both EGF and TSP‐1 are stored in platelet granules,22 and elevated plasma levels may simply reflect differences in thrombus composition and platelet activation.3, 10, 23 This possibility is supported by the concordance of EGF expression in plasma and thrombectomy samples. It is also possible that differences in thrombus type are not responsible for these findings. We did not observe significant differences in thrombus type on OCT, nor did the array analysis identify differences in other platelet‐related molecules such as platelet factor 4 or platelet‐derived growth factor (unpublished data). The discordance between TSP‐1 expression in plasma and thrombectomy samples may reflect local expression of TSP‐1 within the coronary artery.
TSP‐1 has complex biological effects that may be relevant to plaque erosion. It is a matricellular glycoprotein that is expressed in platelets, vascular smooth muscle cells, endothelial cells, and vascular fibroblasts and is present in the extracellular matrix of vessels.24 It impairs endothelial cell adhesion, motility, growth, and survival25, 26, 27 and stabilizes thrombi.28 Interestingly a polymorphism of the gene encoding TSP‐2 has been associated with plaque erosion in a cohort of patients with sudden death.29 Studies of TSP‐1 and TSP‐2 expression in autopsy specimens might clarify whether TSPs are relevant to plaque erosion.
Array analysis confirmed that multiple molecules thought to be important in plaque rupture were preferentially expressed in the RFC group, including matrix metalloproteinase 9, lipocalin 2, and RANTES.30, 31, 32 We also confirmed significantly increased I‐TAC/CXCL11 in coronary plasma samples in RFC, which is a new finding. I‐TAC plays a key role in the recruitment and retention of activated T lymphocytes at sites of inflammation during atherogenesis and is known to be expressed by neovascular endothelial cells and macrophages in the shoulder regions of advanced atherosclerotic lesions.33 We do not know whether increased I‐TAC mRNA in thrombectomy specimens reflects expression by inflammatory cells trapped in thrombus or aspirated atherosclerotic material.
Implications
We demonstrated the feasibility of studying different plaque pathologies using intracoronary blood sampling, OCT, and multiplex arrays to screen for molecular differences. The cytokines identified have been shown to be involved in mechanisms that make them plausible candidates for driving or facilitating plaque destabilization. This supports the validity of our approach to studying potential triggers of plaque erosion and rupture. Larger studies might refine the identification of novel biomarkers for such lesions and facilitate the customization of treatment according to the underlying pathology.5
Study Limitations
This is a single‐center study, and larger studies are required to confirm our findings. To minimize disruption to the normal primary percutaneous coronary intervention procedure, peripheral and coronary arterial blood samples were not taken simultaneously. We were able to validate only a small number of the array findings with ELISAs because of limited plasma samples. In common with other studies,3, 10, 34 predilatation was permitted before OCT and could have led to misclassification of pathology. We have used IFC as an OCT surrogate for plaque erosion, but direct histological confirmation is not possible.12
Conclusions
We demonstrated significant differences in the inflammatory profiles of RFC and IFC in patients with STEMI, using cytokine arrays. Novel findings include elevated intracoronary EGF and TSP‐1 with IFC and elevated intracoronary I‐TAC with RFC. Some of the differences are also reflected in mRNA analysis of thrombectomy samples. These results may help to further understand the pathophysiology of plaque erosion and to potentially tailor future treatment strategies.
Sources of Funding
The study was supported by the Norwich Research Park (Science Link Seed Fund) and the Norfolk Heart Trust.
Disclosures
None.
Acknowledgments
OCT catheters were donated by St Jude Medical. St Jude, Norwich Research Park, and the Norfolk Heart Trust were not involved with any of the study processes. We are grateful to Professor Roger Hall, Professor Andreas Baumbach, and Dr Thomas Johnson for their oversight of the study.
(J Am Heart Assoc. 2017;6:e005868 DOI: 10.1161/JAHA.117.005868.)28468787
References
- 1. Guagliumi G, Capodanno D, Saia F, Musumeci G, Tarantini G, Garbo R, Tumminello G, Sirbu V, Coccato M, Fineschi M, Trani C, De Benedictis M, Limbruno U, De Luca L, Niccoli G, Bezerra H, Ladich E, Costa M, Biondi Zoccai G, Virmani R. Mechanisms of atherothrombosis and vascular response to primary percutaneous coronary intervention in women versus men with acute myocardial infarction: results of the OCTAVIA study. JACC Cardiovasc Interv. 2014;7:958–968. [DOI] [PubMed] [Google Scholar]
- 2. Jia H, Abtahian F, Aguirre AD, Lee S, Chia S, Lowe H, Kato K, Yonetsu T, Vergallo R, Hu S, Tian J, Lee H, Park SJ, Jang YS, Raffel OC, Mizuno K, Uemura S, Itoh T, Kakuta T, Choi SY, Dauerman HL, Prasad A, Toma C, McNulty I, Zhang S, Yu B, Fuster V, Narula J, Virmani R, Jang IK. In vivo diagnosis of plaque erosion and calcified nodule in patients with acute coronary syndrome by intravascular optical coherence tomography. J Am Coll Cardiol. 2013;62:1748–1758. [DOI] [PMC free article] [PubMed] [Google Scholar]
- 3. Niccoli G, Montone RA, Di Vito L, Gramegna M, Refaat H, Scalone G, Leone AM, Trani C, Burzotta F, Porto I, Aurigemma C, Prati F, Crea F. Plaque rupture and intact fibrous cap assessed by optical coherence tomography portend different outcomes in patients with acute coronary syndrome. Eur Heart J. 2015;36:1377–1384. [DOI] [PubMed] [Google Scholar]
- 4. Libby P. Mechanisms of acute coronary syndromes and their implications for therapy. N Engl J Med. 2013;368:2004–2013. [DOI] [PubMed] [Google Scholar]
- 5. Jia H, Dai J, Hou J, Xing L, Ma L, Liu H, Xu M, Yao Y, Hu S, Yamamoto E, Lee H, Zhang S, Yu B, Jang I. Effective anti‐thrombotic therapy without stenting: intravascular optical coherence tomography‐based management in plaque erosion (the EROSION study). Eur Heart J. 2016;38:1–9. [DOI] [PubMed] [Google Scholar]
- 6. Campbell IC, Suever JD, Timmins LH, Veneziani A, Vito RP, Virmani R, Oshinski JN, Taylor WR. Biomechanics and inflammation in atherosclerotic plaque erosion and plaque rupture: implications for cardiovascular events in women. PLoS One. 2014;9:e111785. [DOI] [PMC free article] [PubMed] [Google Scholar]
- 7. Falk E, Nakano M, Bentzon JF, Finn AV, Virmani R. Update on acute coronary syndromes: the pathologists' view. Eur Heart J. 2013;34:719–728. [DOI] [PubMed] [Google Scholar]
- 8. Quillard T, Araújo HA, Franck G, Shvartz E, Sukhova G, Libby P. TLR2 and neutrophils potentiate endothelial stress, apoptosis and detachment: implications for superficial erosion. Eur Heart J. 2015;36:1394–1404. [DOI] [PMC free article] [PubMed] [Google Scholar]
- 9. Ferrante G, Nakano M, Prati F, Niccoli G, Mallus MT, Ramazzotti V, Montone RA , Kolodgie FD, Virmani R, Crea F. High levels of systemic myeloperoxidase are associated with coronary plaque erosion in patients with acute coronary syndromes: a clinicopathological study. Circulation. 2010;122:2505–2513. [DOI] [PubMed] [Google Scholar]
- 10. Niccoli G, Montone RA, Cataneo L, Cosentino N, Gramegna M, Refaat H, Porto I, Burzotta F, Trani C, Leone AM, Severino A, Crea F. Morphological‐biohumoral correlations in acute coronary syndromes: pathogenetic implications. Int J Cardiol. 2014;171:463–466. [DOI] [PubMed] [Google Scholar]
- 11. Saia F, Komukai K, Capodanno D, Sirbu V, Musumeci G, Boccuzzi G, Tarantini G, Fineschi M, Tumminello G, Bernelli C, Niccoli G, Coccato M, Bordoni B, Bezerra H, Biondi‐Zoccai G, Virmani R, Guagliumi G. Eroded versus ruptured plaques at the culprit site of STEMI: in vivo pathophysiological features and response to primary PCI. JACC Cardiovasc Imaging. 2015;8:566–575. [DOI] [PubMed] [Google Scholar]
- 12. Tearney GJ, Regar E, Akasaka T, Adriaenssens T, Barlis P, Bezerra HG, Bouma B, Bruining N, Cho JM, Chowdhary S, Costa MA, De Silva R, Dijkstra J, Di Mario C, Dudeck D, Falk E, Feldman MD, Fitzgerald P, Garcia H, Gonzalo N, Granada JF, Guagliumi G, Holm NR, Honda Y, Ikeno F, Kawasaki M, Kochman J, Koltowski L, Kubo T, Kume T, Kyono H, Lam CCS, Lamouche G, Lee DP, Leon MB, Maehara A, Manfrini O, Mintz GS, Mizuno K, Morel MA, Nadkarni S, Okura H, Otake H, Pietrasik A, Prati F, Rber L, Radu MD, Rieber J, Riga M, Rollins A, Rosenberg M, Sirbu V, Serruys PWJC, Shimada K, Shinke T, Shite J, Siegel E, Sonada S, Suter M, Takarada S, Tanaka A, Terashima M, Troels T, Uemura S, Ughi GJ, Van Beusekom HMM, Van Der Steen AFW, Van Es GA, Van Soest G, Virmani R, Waxman S, Weissman NJ, Weisz G. Consensus standards for acquisition, measurement, and reporting of intravascular optical coherence tomography studies: a report from the International Working Group for Intravascular Optical Coherence Tomography Standardization and Validation. J Am Coll Cardiol. 2012;59:1058–1072. [DOI] [PubMed] [Google Scholar]
- 13. R&D Systems . Proteome ProfilerTM Array: human XL cytokine array kit. 2014.
- 14. Bolstad BM, Irizarry R, Astrand M, Speed TP. A comparison of normalization methods for high density oligonucleotide array data based on variance and bias. Bioinformatics. 2003;19:185–193. [DOI] [PubMed] [Google Scholar]
- 15. Tibshirani R, Chu G, Narasimhan B, Li J. samr: SAM: significance analysis of microarrays. 2011.
- 16. Benjamini Y, Hochberg Y. Controlling the false discovery rate: a practical and powerful approach to multiple testing. J R Stat Soc B. 1995;57:289–300. [Google Scholar]
- 17. R Core Team . R: A Language and Environment for Statistical Computing. Vienna, Austria: R Found. Stat. Comput.; 2014. {ISBN} 3‐900051‐07‐0. [Google Scholar]
- 18. Vergallo R, Ren X, Yonetsu T, Kato K, Uemura S, Yu B, Jia H, Abtahian F, Aguirre AD, Tian J, Hu S, Soeda T, Lee H, McNulty I, Park SJ, Jang Y, Prasad A, Lee S, Zhang S, Porto I, Biasucci LM, Crea F, Jang IK. Pancoronary plaque vulnerability in patients with acute coronary syndrome and ruptured culprit plaque: a 3‐vessel optical coherence tomography study. Am Heart J. 2014;167:59–67. [DOI] [PubMed] [Google Scholar]
- 19. Berrahmoune H, Lamont JV, Herbeth B, FitzGerald PS, Visvikis‐Siest S. Biological determinants of and reference values for plasma interleukin‐8, monocyte chemoattractant protein‐1, epidermal growth factor, and vascular endothelial growth factor: results from the STANISLAS cohort. Clin Chem. 2006;52:504–510. [DOI] [PubMed] [Google Scholar]
- 20. Barclay JL, Keshvari S, Whitehead JP, Inder WJ. Development of an enzyme‐linked immunosorbent assay for thrombospondin‐1 and comparison of human plasma and serum concentrations. Ann Clin Biochem. 2016;53:606–610. [DOI] [PubMed] [Google Scholar]
- 21. Kao J, Kobashigawa J, Fishbein MC, Robb MacLellan W, Burdick MD, Belperio JA, Strieter RM. Elevated serum levels of the CXCR3 chemokine ITAC are associated with the development of transplant coronary artery disease. Circulation. 2003;107:1958–1961. [DOI] [PubMed] [Google Scholar]
- 22. Burkhart JM, Gambaryan S, Watson SP, Jurk K, Walter U, Sickmann A, Heemskerk JWM, Zahedi RP. What can proteomics tell us about platelets? Circ Res. 2014;114:1204–1219. [DOI] [PubMed] [Google Scholar]
- 23. Sato Y, Hatakeyama K, Yamashita A, Marutsuka K, Sumiyoshi A, Asada Y. Proportion of fibrin and platelets differs in thrombi on ruptured and eroded coronary atherosclerotic plaques in humans. Heart. 2005;91:526–530. [DOI] [PMC free article] [PubMed] [Google Scholar]
- 24. Roberts DD, Miller TW, Rogers NM, Yao M, Isenberg JS. The matricellular protein thrombospondin‐1 globally regulates cardiovascular function and responses to stress via CD47. Matrix Biol. 2012;31:162–169. [DOI] [PMC free article] [PubMed] [Google Scholar]
- 25. Murphy‐Ullrich JE, Hook M. Thrombospondin modulates focal adhesions in endothelial cells. J Cell Biol. 1989;109:1309–1319. [DOI] [PMC free article] [PubMed] [Google Scholar]
- 26. Bagavandoss P, Wilks JW. Specific inhibition of endothelial cell proliferation by thrombospondin. Biochem Biophys Res Commun. 1990;170:867–872. [DOI] [PubMed] [Google Scholar]
- 27. Jiménez B, Volpert OV, Crawford SE, Febbraio M, Silverstein RL, Bouck N. Signals leading to apoptosis‐dependent inhibition of neovascularization by thrombospondin‐1. Nat Med. 2000;6:41–48. [DOI] [PubMed] [Google Scholar]
- 28. Bonnefoy A, Daenens K, Feys HB, De Vos R, Vandervoort P, Vermylen J, Lawler J, Hoylaerts MF. Thrombospondin‐1 controls vascular platelet recruitment and thrombus adherence in mice by protecting (sub)endothelial VWF from cleavage by ADAMTS13. Blood. 2006;107:955–964. [DOI] [PMC free article] [PubMed] [Google Scholar]
- 29. Burke A, Creighton W, Tavora F, Li L, Fowler D. Decreased frequency of the 3′UTR T>G single nucleotide polymorphism of thrombospondin‐2 gene in sudden death due to plaque erosion. Cardiovasc Pathol. 2010;19:e45–e49. [DOI] [PubMed] [Google Scholar]
- 30. Hemdahl A‐L, Gabrielsen A, Zhu C, Eriksson P, Hedin U, Kastrup J, Thorén P, Hansson GK. Expression of neutrophil gelatinase–associated lipocalin in atherosclerosis and myocardial infarction. Arterioscler Thromb Vasc Biol. 2006;26:136–142. [DOI] [PubMed] [Google Scholar]
- 31. te Boekhorst BC, Bovens SM, Hellings WE, van der Kraak PH, van de Kolk KW, Vink A, Moll FL, van Oosterhout MF, de Vries JP, Doevendans PA, Goumans M‐J, de Kleijn DP, van Echteld CJ, Pasterkamp G, Sluijter JP. Molecular MRI of murine atherosclerotic plaque targeting NGAL: a protein associated with unstable human plaque characteristics. Cardiovasc Res. 2011;89:680–688. [DOI] [PubMed] [Google Scholar]
- 32. Shalhoub J, Viiri LE, Cross AJ, Gregan SM, Allin DM, Astola N, Franklin IJ, Davies AH, Monaco C. Multi‐analyte profiling in human carotid atherosclerosis uncovers pro‐inflammatory macrophage programming in plaques. Thromb Haemost. 2016;115:1064–1072. [DOI] [PubMed] [Google Scholar]
- 33. Mach F, Sauty A, Iarossi AS, Sukhova GK, Neote K, Libby P, Luster AD. Differential expression of three T lymphocyte‐activationg CXC chemokines by human atheroma‐associated cells. J Clin Invest. 1999;104:1041–1050. [DOI] [PMC free article] [PubMed] [Google Scholar]
- 34. Higuma T, Soeda T, Abe N, Yamada M, Yokoyama H, Shibutani S, Vergallo R, Minami Y, Ong DS, Lee H, Okumura K, Jang IK. A combined optical coherence tomography and intravascular ultrasound study on plaque rupture, plaque erosion, and calcified nodule in patients with ST‐segment elevation myocardial infarction: incidence, morphologic characteristics, and outcomes after percutaneous coronary intervention. JACC Cardiovasc Interv. 2015;8:1166–1176. [DOI] [PubMed] [Google Scholar]