

Abstract
Background
Phthalates are environmental chemicals that may play a role in the development of obesity. Few studies have investigated longitudinal associations between postnatal phthalate exposures and subsequent anthropometric measurements in children.
Methods
We collected data as part of The Breast Cancer and Environment Research Program at three US sites. 1,239 girls, ages 6–8 years, were enrolled in 2004–2007. We categorized baseline phthalate exposures, assessed from creatinine-corrected urinary concentrations of low molecular weight phthalate metabolites as low, <78; medium, 78-<194; and high, ≥194 μg/g creatinine and of high molecular weight phthalates as low, <111; medium, 111–278; and high, ≥278 μg/g creatinine. Anthropometric measurements were collected through 2012 (n=1,017). Linear mixed effects regression estimated how baseline low and high molecular weight phthalate concentrations related to changes in girls’ body mass index (BMI), height, and waist circumference at ages 7 through 13 years.
Results
Low molecular weight phthalates were positively associated with gains in BMI and waist circumference. Predicted differences in BMI and waist circumference between girls with high versus low concentrations of low molecular weight phthalates increased from 0.56 (95% CI: −0.02, 1.1) to 1.2 (95%CI: 0.28, 2.1) kg/m2 and from 1.5 (95%CI: −0.38, 3.3) to 3.9 (95%CI: 1.3, 6.5) cm, respectively. High molecular weight phthalates were negatively associated with height but only among girls who were normal weight at baseline (BMI ≤85th percentile).
Conclusion
Phthalates, specifically low molecular weight phthalates, have small but detectable associations with girls’ anthropometric outcomes. Low molecular weight phthalates, showed stronger associations than other types of phthalates.
Introduction
Environmental chemicals may influence the development of obesity and related metabolic disorders.1 These chemicals are often referred to as “obesogens,” and include many chemicals that are ubiquitous in our daily environment;1 such as phthalates.2 Phthalates, or diesters of phthalic acid, are a family of man-made chemicals used in a range of consumer and industrial products: low molecular weight phthalates are typically found in medications and personal care items, such as shampoos, deodorants, and lotions, while high molecular weight phthalates are used in the manufacturing of flexible plastics for such purposes as floor and wall coverings, adhesives, medical devices, and food packaging.3–5 Exposure to phthalates may occur through dermal absorption, inhalation, or ingestion6 and it has been estimated that >98% of individuals in the United States have detectable levels of urinary phthalate metabolites.5
Compared to adults, children tend to have higher urine concentrations of phthalate metabolites.7 Children may be at increased risk of the potential adverse health effects due to exposures during time periods that are critical for normal growth and development. Laboratory evidence suggests that phthalates can disrupt normal thyroid hormone function8 and activate peroxisome proliferator-activated receptors, which regulate lipid metabolism, thereby promoting fat accumulation.9,10 In children and/or adolescents, cross-sectional and short term follow-up studies have reported associations between specific urinary phthalate metabolites (or groups of metabolites) and body mass index (BMI),11–15 height,16 and waist circumference,11,14,15 as well as blood pressure,17 insulin resistance,18 and oxidative stress biomarkers.19 However, these associations have varied by age group, sex, race/ethnicity, and body size and may have resulted from reverse causation.
In this study, we investigated the longitudinal associations between urinary phthalate concentrations during childhood and subsequent body size measurements in a multi-ethnic cohort of elementary school-aged girls over an approximate 6 year follow-up period. To our knowledge, there are currently few similar studies in children.
Methods
Data were collected as part of The Breast Cancer and Environment Research Project, a longitudinal study with a primary objective of investigating environmental exposures and onset of puberty in girls. Data collection occurred at three sites: 1) Mount Sinai School of Medicine (MSSM), which recruited in East Harlem, New York; 2) Cincinnati Children’s Hospital/University of Cincinnati (Cincinnati), which recruited in the Cincinnati metropolitan area and the Breast Cancer Registry of Greater Cincinnati; and 3) the Kaiser Permanente Northern California/University of California San Francisco (KPSF), which recruited from Kaiser members born and still residing in the San Francisco Bay Area. Eligibility included age (6–8 years), female sex, and no underlying endocrine medical conditions; additionally, at MSSM, eligibility required black or Hispanic race/ethnicity. Descriptions of the study and recruitment process are detailed elsewhere.20 The study was approved by the institutional review board at each site and the Centers for Disease Control and Prevention (CDC). A total of 1239 girls were enrolled and had baseline data collected during 2004–2007. For this analysis, 1017 (82%) girls had at least 3 anthropometric measurements collected during the study period (baseline through 2012, n=168 missing) and baseline urinary biomarker measurements (n=54 missing); the last visit occurred when girls were on average 14 years old (range, 11–16 years).
Urinary Phthalate Metabolite Measurements
At baseline, each girl provided a spot urine sample. Samples were analyzed at the National Center for Environmental Health at the CDC. Laboratory analytic methods and quality control procedures have been published.21 Briefly, the multi-rule quality control system was followed at the CDC to monitor performance, based on analysis of low- and high- concentration pools;22 batches were rerun or rejected if criteria are not met. In addition, an external quality control pool interspersed with samples was included (n=101). The coefficient of variation of this pool was <10% for six analytes with concentrations above 10 ug/L and <21% for 3 analytes at 5–7 ug/L. Urinary concentrations were obtained for creatinine and nine metabolites most frequently detected in the general US population: monoethyl phthalate (MEP); mono-n-butyl phthalate (MBP); mono-(3-carboxypropyl) phthalate (MCPP); monobenzyl phthalate (MBzP); mono-isobutyl phthalate (MiBP); mono-(2-ethylhexyl) phthalate (MEHP); mono-(2-ethyl-5-oxohexyl) phthalate (MEOHP); mono-(2-ethyl-5-carboxypentyl) phthalate (MECPP); and mono-(2-ethyl-5-hydroxyhexyl) phthalate (MEHHP). Values below the limit of detection (LOD) were imputed as LOD/√2.21,23
To limit multiple comparisons, we analyzed individual phthalate metabolites in molar sum groupings based on similar sources and biologic activities: 1) low molecular weight phthalates (<250 Dalton), the molar sum of MEP, MBP, and MiBP (metabolites of diethyl phthalate (DEP), dibutyl phthalate,(DBP), and diisobutyl phthalate (DiBP), respectively); 2) high molecular weight phthalates (>250 Dalton), the molar sum of MEHP, MEHHP, MEOHP, MECPP (metabolites of di-2-ethylhexyl (DEHP)), MCPP (metabolite of di-n-octyl phthalate (DnOP)), and MBzP (metabolite of benzylbutyl phthalate (BzBP)); and 3) the molar sum of MEHP, MEHHP, MEOHP, MECPP (metabolites of DEHP, ΣDEHP). Therefore, high molecular weight phthalates include ΣDEHP metabolites plus the metabolites MCPP and MBzP. The molar sum of low molecular weight phthalates was expressed as MEP (molecular weight 194); the molar sum of high molecular weight phthalates and ΣDEHP were expressed as MEHP (molecular weight 278).21 We corrected urinary phthalate metabolite concentrations for creatinine (micrograms per gram creatinine, μg/g creatinine, or micromoles per gram creatinine, μmol/g creatinine) to account for urine dilution. Girls with low (<10 mg/dl, n=12) or high (>300 mg/dl, n=1) creatinine levels were excluded; the sample median in the remaining girls was 92 mg/dl.
Anthropometric and Covariate Assessments
Weight, standing height, and umbilical waist circumference were collected at baseline and at annual follow-up visits thereafter (measurements were collected biannually at the Cincinnati site) by trained interviewers using a standard protocol adapted from the National Health and Nutrition Examination Survey (NHANES).24 Children wore light gowns or t-shirts and no shoes. All measurements were taken twice and the absolute difference between them was calculated, if the difference exceeded the specified tolerance level per NHANES protocol then the measurement was repeated a third time. Measurements were averaged for analyses. Weight and height were used to derive body mass index (BMI, weight in kilograms divided by squared height in meters). Only girls with measurements for weight, height, and waist circumference collected three or more times during the follow-up period were included in analyses. The median number of measurements during the follow-up period was 7 (range, 3–13 measurements).
Data regarding sociodemographic and other characteristics were collected via self-completed (Cincinnati site) or interviewer-administered questionnaires, conducted in English or Spanish, that were completed by the girl’s caregiver (usually the mother). Race/ethnicity was identified as black, Hispanic, white, and Asian. Socioeconomic status was represented by the highest attained education level of the primary caregiver, categorized as high school or less, college, graduate/professional school.
Statistical Analysis
We performed statistical analyses using STATA 13 (College Station, TX). We calculated geometric means of concentrations of the three phthalate types - Low molecular weight phthalates, high molecular weight phthalates, and ΣDEHP -as baseline characteristics in the population. We categorized creatinine-corrected concentrations (μg/g creatinine) of each of the three phthalate types into three categories: low, medium, and high. For low molecular weight phthalates, we defined categories as: low, <78; medium, 78-<194; and high, ≥194 μg/g creatinine. For high molecular weight phthalates and ΣDEHP, we defined categories as: low, <111; medium, 111–278; and high, ≥278 μg/g creatinine. These categories were based on the distributions within the population and roughly represent at least a two-fold increase in the median urinary concentration for each level within each of the three phthalate groups.
Linear mixed effects models25–27 were used to assess the relationship between Year 1 urinary metabolite concentrations (low molecular weight phthalates, high molecular weight phthalates, ΣDEHP) and the girls’ BMI (kg/m2), waist circumference (cm), and height (cm) trajectories from ages 7 through 13 years. This age range was considered due to the smaller numbers of girls with anthropometric data collected at younger or older ages. Mixed effects models easily accommodate these data since they account for unbalanced data (unequal numbers of repeated measurements within girls and irregular spacing of measurements across time and across girls) and intra-subject correlations.28 An unstructured correlation matrix was specified. Models included phthalate concentration categories (low, medium, high), child age (centered and in years estimated to the nearest tenth of a year), child age squared (to allow for non-linearity), an interaction term between age and concentration categories, an interaction term between age squared and phthalate concentration categories and an interaction term between race and age. We included interactions between phthalate concentration categories and age to assess the different anthropometric outcome trajectories by the urinary phthalate metabolite concentrations. We also used results from the mixed effects models to calculate predicted differences (and 95% confidence intervals) at each integer age in the anthropometric measures between phthalate concentration categories (medium versus low, high versus low, high versus medium) using the pwcompare command. Additional adjustment for site, caregiver education, puberty status (defined as breast stage 2 at <9.4 years, the median age in the population),29 and season of urine collection (summer versus non-summer) did not substantially alter the magnitude or precision of the results and were not included in final models. We repeated analyses without correction for creatinine and these yielded similar results to those with correction; therefore, we present creatinine-corrected models.
Based on findings from previous studies,12,14 we examined interactions by child overweight status at baseline, dichotomized at the 85th percentile of BMI-for-age, and by race/ethnic group, excluding Asians due to the small sample size (n=52). Three-way interactions (race/ethnic group*phthalate concentration category*age and overweight status*phthalate concentration category*age) were tested in models at a significance level of p<0.05. Due to potentially high correlations between phthalate metabolites within the phthalate groupings,14 we also examined associations of individual phthalate metabolites and anthropometric outcomes. Similar to the phthalate groupings, we categorized individual metabolites into low, medium, and high creatinine-corrected concentration categories (μg/g creatinine) to roughly represent at least a two-fold increase in the median urinary concentration for each category.
Results
We have reported sociodemographic characteristics of this population previously.20,23,29 At enrollment, most girls (53%) were 7 years of age (Table 1). Proportions of black, white, and Hispanic girls were similar, while Asians made up only 5% of the population. Approximately half of the girls had caregivers with higher than a high school education (Table 1). Mean urinary phthalate concentrations did not vary much across the selected sociodemographic characteristics with some exceptions: concentrations of low molecular weight phthalates, high molecular weight phthalates, and ΣDEHP were higher among girls at the MSSM site and among girls with caregivers who did not graduate from high school. Additionally, low molecular weight phthalate concentrations tended to be higher for Black and Hispanic girls and for samples collected during summer months (Table 1).
Table 1.
Geometric means (95% CI) of urinary creatinine-corrected concentrations (μg/g creatinine) of low molecular weight phthalatesa, high molecular weight phthalatesb, and the sum of four metabolites of di-2-ethylhexyl phthalate (ΣDEHP)c in relation to selected baseline characteristics.
| Characteristic | No. (%) | Low Molecular Weight Phthalates | High Molecular Weight Phthalates | ΣDEHP | |||
|---|---|---|---|---|---|---|---|
| Geometric Mean | 95% CI | Geometric Mean | 95% CI | Geometric Mean | 95% CI | ||
| Age (years) at baseline | 1017 | ||||||
| 6 to <7 | 262 (26) | 184 | 165–206 | 199 | 186–213 | 182 | 164–203 |
| 7 to <8 | 537 (53) | 136 | 126–147 | 234 | 212–258 | 152 | 142–164 |
| ≥8 | 218 (21) | 163 | 143–186 | 195 | 173–220 | 152 | 134–174 |
| Race/Ethnicity | 1017 | ||||||
| Non-Hispanic White | 365 (36) | 102 | 94–111 | 182 | 169–196 | 138 | 127–150 |
| Non-Hispanic Black | 304 (30) | 202 | 182–224 | 193 | 175–214 | 148 | 133–165 |
| Hispanic | 296 (29) | 204 | 184–226 | 264 | 239–291 | 209 | 188–233 |
| Asian | 52 (5) | 101 | 81–127 | 180 | 146–222 | 144 | 114–182 |
| Caregiver Education | 993 | ||||||
| ≤High School | 485 (49) | 192 | 177–209 | 233 | 216–252 | 182 | 168–198 |
| College | 334 (34) | 131 | 119–143 | 188 | 174–204 | 146 | 133–159 |
| <College | 174 (17) | 104 | 91–118 | 176 | 156–198 | 130 | 115–148 |
| Season of urine sample collection | 1017 | ||||||
| Summer | 279 (27) | 177 | 158–199 | 208 | 191–227 | 160 | 145–176 |
| Other Season | 738 (73) | 145 | 136–155 | 206 | 193–219 | 159 | 149–170 |
| Baseline BMI Percentile | 1017 | ||||||
| ≤50 | 343(34) | 134 | 122–147 | 210 | 192–230 | 161 | 146–177 |
| >50th to <85th | 349 (34) | 150 | 136–165 | 203 | 186–221 | 156 | 142–171 |
| ≥85th | 325 (32) | 180 | 163–200 | 109 | 191–229 | 163 | 148–179 |
| Site | 1017 | ||||||
| MSSM | 306 (30) | 253 | 229–279 | 305 | 276–555 | 242 | 217–270 |
| Cincinnati | 309 (30) | 128 | 116–142 | 179 | 165–195 | 135 | 123–147 |
| KPSF | 402 (40) | 120 | 110–130 | 171 | 159–183 | 132 | 122–143 |
Low Molecular Weight Phthalates: molar sum of MEP, MBP, and MiBP (metabolites of diethyl phthalate (DEP), dibutyl phthalate, (DBP), and diisobutyl phthalate (DiBP), respectively)
High Molecular Weight Phthalates: molar sum of MEHP, MEHHP, MEOHP, MECPP (metabolites of DEHP)), MCPP (metabolite of di-n-octyl phthalate (DnOP)), and MBzP (metabolite of benzylbutyl phthalate (BzBP))
ΣDEHP: the molar sum of MEHP, MEHHP, MEOHP, MECPP (metabolites of DEHP)
There was no evidence of an interaction of phthalate metabolites with girls’ race/ethnicity. The association between high molecular weight phthalates and height differed by baseline overweight (three-way interaction, p=0.03); therefore, these analyses were stratified by baseline overweight status.
Low Molecular Weight Phthalates
Low molecular weight phthalates were positively associated with changes in girls’ BMI and waist circumference from ages 7 to 13 years (Table 2 and Figure). Compared to girls with low or medium baseline concentrations of low molecular weight phthalates, those with high concentrations had greater predicted differences in BMI and waist circumference at baseline; these differences increased and became stronger as girls aged (Table 2 and Figure 1). For example, the predictive difference in BMI increased from 0.56 kg/m2 (95% CI: −0.02, 1.1) to 1.2 kg/m2 (95% CI: 0.28, 2.1) and the difference in waist circumference increased from 1.5 cm (95% CI: −0.38, 3.3) to 3.9 cm (95% CI: 1.3, 6.5) cm (Table 2). For high versus medium concentrations of low molecular weight phthalates, predicted differences in BMI were not strong at any age, but predicted differences in waist circumference increased with age, from 0.65 cm (95% CI: −0.83, 2.1) to 2.9 cm (95%CI: 0.81, 5.0) (Table 2). There were no associations observed when comparing girls with medium concentrations of low molecular weight phthalates to those with low concentrations. Associations of the individual low molecular weight phthalate metabolites, MEP, MBP, and MiBP, with BMI and waist circumference were consistent with those for low molecular weight phthalates. Low molecular weight phthalates were weakly, negatively associated with height differences and the majority of predicted differences in height between exposure categories were small (eTables 1–3).
Table 2.
Predicted differencesa in body mass index (kg/m2) and waist circumference (cm) from 7–13 years among girls (n=1017) with high (≥194 μg/g creatinine) compared to low (<78 μg/g creatinine) low molecular weight phthalates concentrations and high compared to medium (78-<194 μg/g creatinine) concentrations.
| Comparison of Categories of Low Molecular Weight Phthalates Concentrations | Age (year) | Predicted Difference in BMI (kg/m2) | 95% CI | Predicted Difference in Waist Circumference (cm) | 95% CI |
|---|---|---|---|---|---|
| High versus Low | 7 | 0.56 | −0.02–1.1 | 1.5 | −0.38–3.3 |
| 8 | 0.79 | 0.19–1.4 | 2.0 | 0.45–3.7 | |
| 9 | 0.97 | 0.32–1.6 | 2.6 | 0.90–4.3 | |
| 10 | 1.1 | 0.39–1.8 | 3.0 | 1.2–4.9 | |
| 11 | 1.2 | 0.41–1.9 | 3.4 | 1.3–5.4 | |
| 12 | 1.2 | 0.37–2.0 | 3.7 | 1.4–5.9 | |
| 13 | 1.2 | 0.28–2.1 | 3.7 | 1.3–6.5 | |
| High versus Medium | 7 | 0.37 | −0.10–0.83 | 0.65 | −0.83–2.1 |
| 8 | 0.43 | −0.05–0.92 | 1.1 | −0.18–2.4 | |
| 9 | 0.49 | −0.03–1.0 | 1.6 | 0.18–2.9 | |
| 10 | 0.53 | −0.03–1.1 | 1.9 | 0.43–3.5 | |
| 11 | 0.56 | −0.05–1.2 | 2.3 | 0.63–4.0 | |
| 12 | 0.58 | −0.08–1.3 | 2.6 | 0.78–4.5 | |
| 13 | 0.59 | −0.14–1.3 | 2.91 | 0.81–5.0 |
Predicted differences (95% CI) were estimated from linear mixed effects models adjusted for age, age squared, race/ethnicity, an interaction term between age and phthalate concentration categories, an interaction term between age squared and phthalate concentration categories, and an interaction term between race/ethnicity and age.
Figure 1.
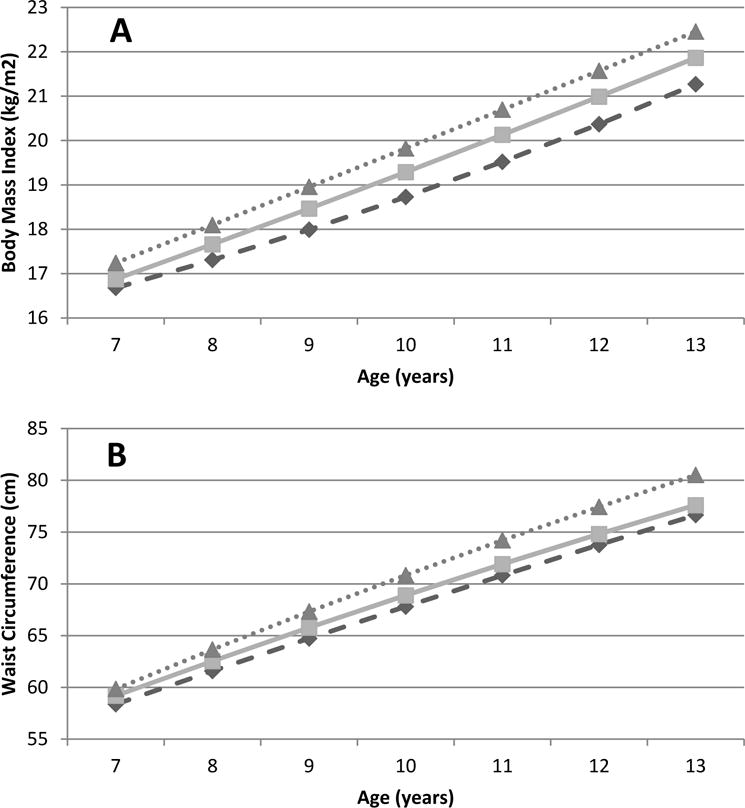
Anthropometric measurements and low molecular weight phthalate concentrations, by baseline concentration, over time. Predicted BMI (A) and waist circumference (B) trajectoriesa from 7–13 years (n=1017) among girls with low (dashed-diamonds), medium (line-squares), and high (dotted-triangles)
a Molecular weight phthalate concentrations, in umol/g creatinine: low (>78), medium (78–<194), high (>=194)
High Molecular Weight Phthalates
No associations were observed for high molecular weight phthalates or ΣDEHP with BMI or waist circumference differences. Among individual metabolites, positive associations were observed for MECPP, MEOHP, MEHHP, and MBzP, while negative associations were observed for MCPP and MEHP; however, most of the associations were weak (eTables 4–9). High molecular weight phthalates were negatively associated with height but only among girls who were normal weight at baseline (BMI ≤85th percentile) (Table 3). Girls with medium and high concentrations of high molecular weight phthalates were shorter at baseline and had smaller predicted differences in height gains over the study period than those with low concentrations of high molecular weight phthalates (Table 3). From ages 7–13 years, predicted differences in height for normal weight girls with medium concentrations of high molecular weight phthalates were less than for similar girls with low concentrations, ranging from −1.3 (95% CI: −2.5, −0.20) to −1.7 (95% CI: −3.0, −0.26) cm between ages 7–13 years (Table 3). Predicted differences in height among normal weight girls with high versus low concentrations of high molecular weight phthalates progressively increased from −1.3 (95% CI: −2.5, −0.20) to −2.2 (95% CI: −3.7, −0.69) cm (Table 3). There were no associations observed when comparing girls with high versus medium concentrations of high molecular weight phthalates. ΣDEHP was negatively associated with height but predicted differences between exposure groups were weak. Associations of the individual high molecular weight phthalate metabolites were consistent with those for high molecular weight phthalates, with strong associations observed for MBzP, MCPP, MEHP, and MECPP (eTables 10–16).
Table 3.
Predicted differencesa in height from 7–13 years among girls (n=1017) with medium (111–<278 μg/g creatinine) compared to low (<111 μmol/g creatinine) high molecular weight phthalate concentrations and high (≥278 μg/g creatinine) compared to low high molecular weight pthalate concentrations, for all girls and stratified by baseline overweight status (<85th percentile and >=85th percentile).
| All Girls (n=1017) | Normal Weight Girls (n=692) | Overweight Girls (n=325) | |||||
|---|---|---|---|---|---|---|---|
| Comparison of Categories of High Molecular Weight Phthalates Concentrations | Age (years) | Predicted Difference in Height (cm) | 95% CI | Predicted Difference in Height (cm) | 95% CI | Predicted Difference in Height (cm) | 95% CI |
| Medium versus Low | 7 | −0.85 | −1.9–0.15 | −1.3 | −2.5–−0.20 | 0.49 | −1.1–2.2 |
| 8 | −1.1 | −2.1–−0.12 | −1.5 | −2.7–−0.42 | 0.29 | −1.3–1.9 | |
| 9 | −1.3 | −2.3–−0.27 | −1.7 | −2.8–−0.53 | 0.12 | −1.5–1.7 | |
| 10 | −1.4 | −2.4–−0.32 | −1.8 | −3.0–−0.57 | 0.07 | −1.6–1.7 | |
| 11 | −1.3 | −2.4–−0.27 | −1.8 | −3.0–−0.54 | 0.13 | −1.6–1.9 | |
| 12 | −1.2 | −2.4–−0.13 | −1.8 | −3.1–−0.44 | 0.31 | −1.5–2.1 | |
| 13 | −1.1 | −2.2–0.11 | −1.7 | −3.0–−0.26 | 0.60 | −1.3–2.5 | |
| High versus Low | 7 | −1.1 | −2.2–−0.05 | −1.3 | −2.5–−0.03 | −0.22 | −2.0–1.5 |
| 8 | −1.2 | −2.3–−0.19 | −1.2 | −2.4–0.00 | −0.76 | −2.5–0.93 | |
| 9 | −1.4 | −2.4–−0.30 | −1.3 | −2.5–−0.01 | −1.1 | −2.8–0.61 | |
| 10 | −1.5 | −2.6–−0.37 | −1.4 | −2.7–−0.08 | −1.2 | −3.0–0.54 | |
| 11 | −1.6 | −2.7–−0.43 | −1.6 | −2.9–−0.22 | −1.1 | −2.9–0.69 | |
| 12 | −1.7 | −2.8–−0.48 | −1.8 | −3.3–−0.42 | −0.81 | −2.7–1.1 | |
| 13 | −1.7 | −3.0–−0.49 | −2.2 | −3.7–−0.69 | −0.30 | −2.3–1.7 | |
Predicted differences (95% CI) were estimated from linear mixed effects models adjusted for age, age squared, race/ethnicity, an interaction term between age and phthalate concentration categories, an interaction term between age squared and phthalate concentration categories, and an interaction term between race/ethnicity and age.
Discussion
In this longitudinal, prospective study of a multi-ethnic population of elementary school-aged girls recruited from three diverse sites in the United States, baseline urinary concentrations of phthalate metabolites were associated with body size measurements through 13 years of age, but varied by high or low molecular weight phthalates and the specific measurement. Low molecular weight phthalates were positively associated with BMI and waist circumference. Compared to girls with low concentrations of low molecular weight phthalate, girls with high concentrations of low molecular weight phthalates had higher baseline BMI and waist circumferences and increasing predicted differences in these measurements across the study period. High molecular weight phthalates were negatively associated with height but only among girls who were normal weight at baseline. Observed associations with low molecular weight phthalates and high molecular weight phthalates were generally consistent for each of their respective individual phthalate metabolites.
Goodman et al recently performed an extensive review of studies evaluating associations between postnatal phthalate concentrations and body size measures,2 concluding that there was weak evidence for associations among children. A majority of the studies were cross-sectional and used data from NHANES, spanning 1999–2010. Among adolescent girls (12–19 years) in NHANES 1999–2002, BMI and waist circumference increased across quartiles of MEP (a low molecular weight phthalate metabolite) and decreased across quartiles of MEHP (a DEHP metabolite) but there were no associations among younger children (6–11 years) or adolescent boys.11 Low molecular weight phthalates were associated with an approximate 20% increased odds of overweight and obesity and 0.09 SD unit increase in BMI z-score among non-Hispanic black children (6–19 years), but not children of other race/ethnic groups in NHANES 2003–2008.12 Positive associations were also reported for low molecular weight phthalates and obesity among boys but not girls (6–19 years) in NHANES 2007–2010.13 The odds of obesity were three- to five times greater among boys in the higher quartiles of low molecular weight phthalate urinary concentrations compared to those in the lowest quartile. Lastly, in a cross-sectional study of Chinese children (8–15 years), low molecular weight phthalates, high molecular weight phthalates, and ΣDEHP were positively associated with BMI and waist circumference.15
Two cohort studies, using prospectively collected data, also examined associations between urinary phthalate concentrations and body size measurements, including height. Among non-Hispanic black and Hispanic children (ages 6–8 years) recruited for the Growing Up Healthy Study in East Harlem, New York (which included some girls from the MSSM site in the current study population), dose-response relationships across quartiles of low molecular weight phthalate and MEP with BMI and waist circumference measured one year later were found for overweight (BMI>=85th percentile) girls only.14 Negative associations were observed for MBP (a low molecular weight phthalate metabolite) and MCPP (a high molecular weight phthalate metabolite) with height in girls, but not boys. In a study of Danish children (ages 4–9 years), ΣDEHP was negatively associated with height, defined as the gain in height during the previous 1.5 years.16
Although the results of previous studies are based on cross-sectional or short-term follow-up data and have varied by age, sex, race/ethnicity, and overweight status, they suggest a link between phthalates exposure and body size in children and share commonalities with the results of the present study. Across all studies (including this one), low molecular weight phthalate metabolites, specifically MEP and MBP, were associated with higher BMI, waist circumference, and/or odds of obesity. Among the few studies that considered height, greater high molecular weight phthalate and/or ΣDEHP metabolite categories were associated with shorter stature. Similar to other studies,12–14 we found no association between high molecular weight phthalate and/or ΣDEHP and adiposity measures, but we observed both negative and positive associations among their individual metabolites. For example, there was a negative association between MEHP and BMI/waist circumference, which was also previously reported for adolescent girls.11
There are uncertainties regarding phthalate concentrations that may explain some of the differences in findings among studies. It is possible that not all phthalate metabolites within the same molecular weight grouping (i.e., high or low) have the same biologic actions or potencies, as was found in the current study for high molecular weight phthalate metabolites and BMI/waist circumference, which makes it difficult to discern associations when grouped. Sources and magnitude of exposures to individual phthalates also tend to vary by age and other socio-demographic characteristics within and across populations30 and may lack the necessary variation within specific populations to detect associations if they exist. Additionally, there are several potential biologic mechanisms underlying associations between phthalates and body size8,9 that may be linked to some of the previously observed differences by sex and BMI.
The most plausible mechanism for associations, specifically for body weight and adiposity measures, is that phthalates interfere with peroxisome-proliferator activated receptors, which are involved in the metabolism of fat, carbohydrates, and protein.9 Generally speaking, phthalates may bind to these receptors, altering metabolic processes and stimulating adipogenesis and the accumulation of adipose tissue.9 Some phthalates also have anti-androgenic properties and are associated with lower testosterone levels and a higher estrogen/androgen ratio,13 which may explain some of the sex differences reported previously. Lastly, phthalates have disruptive effects on thyroid function8 and insulin-like growth factor-1 (IGF-1).16,16 Negative associations of phthalates with thyroid hormone, IGF-1, and height in children have been reported.16 In the current study, a negative association between high molecular weight phthalates and height was observed only among girls who were normal weight at baseline. Obese children have higher levels of IGF-1 and accelerated height velocity during the pre-pubertal years compared to normal weight children;31 therefore, it is possible that the negative association between high molecular weight phthalates and height is blunted in obese children.
In the review by Goodman et al.,2 common limitations in the literature that may explain inconsistencies in findings were discussed. A main limitation is that the majority of studies were based on cross-sectional data using one-time urine measurements as proxies for long-term phthalate exposure. In the current study, we were able to address temporality by using early childhood phthalate concentrations and subsequently collected annual measurements of weight, height, and waist circumference through early adolescence. BMI and waist circumference are good predictors of subcutaneous and visceral fat, respectively,32 as well as metabolic-related adverse health outcomes.33 Waist circumference, in particular, is associated with insulin resistance, hypertension, and cardiovascular disease risk factors in children.33,34 Similar to previous studies, we were limited to one-time urine measurements for estimation of exposure to phthalates, which are short-lived chemicals in the body and possibly episodic in nature. However, they have shown acceptable intra-individual variability over more than a year and are likely to be reasonably stable over time for the purposes of ranking.35,36 It is not clear if and how exposure misclassification would bias the observed results, especially if the associations between phthalate exposures and childhood growth vary with age. If exposure to phthalates increases throughout childhood/adolescence and the associations are assumed to be consistent throughout this growth period, then the observed associations reported here may be attenuated. Other limitations are related to differences in study populations and phthalate exposure assessment. In the current study, the sample was multi-ethnic but limited to girls, so we were unable to examine any potential interactions by sex.
Conclusions
Urinary concentrations of phthalate metabolites in girls were associated with body size measurements from ages 7–13 years. Low molecular weight phthalate concentrations were positively associated with BMI and waist circumference in all girls, while high molecular weight phthalate concentrations were negatively associated with height among normal weight girls. These results suggest that phthalates may have small but detectable associations with girls’ anthropometric outcomes. Low molecular weight phthalates are of particular interest as potential environmental obesogens. Additional longitudinal studies with multiple repeated phthalate measurements throughout childhood and adolescence and diverse study populations are necessary to confirm these findings.
Supplementary Material
Acknowledgments
We gratefully acknowledge our collaborators at the centers involved in this research including Jessica Montana, Nancy Mervish, Cheryl Stein, Rochelle Osborne, Lisa Boguski, Joel Forman, and Barbara Brenner (MSSM); Gayle Greenberg, Peggy Monroe, Bob Bornschein (Cincinnati); Robert Hiatt, Louise Greenspan, Julie Deardorff, Janice Barlow (Kaiser Permanente). We also thank Ella Samandar, James Preau and Tao (Lily) Jia for measurement of the phthalate metabolites. The findings and conclusions in this report are those of the authors and do not necessarily represent the official position of the Centers for Disease Control and Prevention.
Sources of Financial Support: This research was supported by the Breast Cancer and the Environment Research Program (BCERP) award numbers U01ES012770, U01ES012771, U01ES012800, U01ES012801, U01ES019435, U01ES019453, U01ES019454, U01ES019457, R827039 and P01ES009584, P30ES006096, and P30ES023515 from the National Institute of Environmental Health Sciences, the National Cancer Institute, EPA, NIH, DHHS, CSTA-UL1RR029887, NYS Empire Clinical Research Investigator Program, Pediatric Environmental Health Fellowship HD049311, and the Avon Foundation.
Footnotes
All authors declare no conflicts of interest.
References
- 1.Holtcamp W. Obesogens: An environmental link to obesity. Environ Health Perspect. 2012;120(2):a62–a68. doi: 10.1289/ehp.120-a62. [DOI] [PMC free article] [PubMed] [Google Scholar]
- 2.Goodman M, LaKind JS, Mattison DR. Do phthalates act as obesogens in humans? A systematic review of the epidemiological literature. Crit Rev Toxicol. 2014;44(2):151–175. doi: 10.3109/10408444.2013.860076. [DOI] [PubMed] [Google Scholar]
- 3.Meeker JD, Sathyanarayana S, Swan SH. Phthalates and other additives in plastic: Human exposure and associated health outcomes. Phil Trans Roy Soc Lond, B. 2009;364:2097–2113. doi: 10.1098/rstb.2008.0268. [DOI] [PMC free article] [PubMed] [Google Scholar]
- 4.NRC (National Research Council), editor. Phthalates and Cumulative Risk Assessment: The Task Ahead. Washington, DC: National Academies Press; 2008. [PubMed] [Google Scholar]
- 5.Zota AR, Calafat AM, Woodruff TJ. Temporal trends in phthalate exposures: Findings from the national health and nutrition examination survey, 2001–2010. Environ Health Perspect. 2014;122(3):235–241. doi: 10.1289/ehp.1306681. [DOI] [PMC free article] [PubMed] [Google Scholar]
- 6.Lyche JL, Gutleb AC, Bergman Å, et al. Reproductive and developmental toxicity of phthalates. J toxicol Environ Health, Pt B. 2009;12(4):225–249. doi: 10.1080/10937400903094091. [DOI] [PubMed] [Google Scholar]
- 7.Wittassek M, Koch HM, Angerer J, Brüning T. Assessing exposure to phthalates–the human biomonitoring approach. Molecular nutrition & food research. 2011;55(1):7–31. doi: 10.1002/mnfr.201000121. [DOI] [PubMed] [Google Scholar]
- 8.Boas M, Feldt-Rasmussen U, Main KM. Thyroid effects of endocrine disrupting chemicals. Mol Cell Endocrinol. 2012;355(2):240–248. doi: 10.1016/j.mce.2011.09.005. [DOI] [PubMed] [Google Scholar]
- 9.Desvergne B, Feige JN, Casals-Casas C. PPAR-mediated activity of phthalates: A link to the obesity epidemic? Mol Cell Endocrinol. 2009;304(1):43–48. doi: 10.1016/j.mce.2009.02.017. [DOI] [PubMed] [Google Scholar]
- 10.Feige JN, Gelman L, Rossi D, et al. The endocrine disruptor monoethyl-hexyl-phthalate is a selective peroxisome proliferator-activated receptor gamma modulator that promotes adipogenesis. J Biol Chem. 2007;282(26):19152–19166. doi: 10.1074/jbc.M702724200. M702724200 [pii] [DOI] [PubMed] [Google Scholar]
- 11.Hatch EE, Nelson JW, Qureshi MM, et al. Association of urinary phthalate metabolite concentrations with body mass index and waist circumference: A cross-sectional study of NHANES data, 1999–2002. Environ Health. 2008;7(27):1–15. doi: 10.1186/1476-069X-7-27. [DOI] [PMC free article] [PubMed] [Google Scholar]
- 12.Trasande L, Attina TM, Sathyanarayana S, Spanier AJ, Blustein J. Race/ethnicity-specific associations of urinary phthalates with childhood body mass in a nationally representative sample. Environ Health Perspect. 2013;121(4):501–506. doi: 10.1289/ehp.1205526. [DOI] [PMC free article] [PubMed] [Google Scholar]
- 13.Buser MC, Murray HE, Scinicariello F. Age and sex differences in childhood and adulthood obesity association with phthalates: Analyses of NHANES 2007–2010. Int J Hyg Environ Health. 2014;217(6):687–694. doi: 10.1016/j.ijheh.2014.02.005. [DOI] [PMC free article] [PubMed] [Google Scholar]
- 14.Teitelbaum SL, Mervish N, Moshier EL, et al. Associations between phthalate metabolite urinary concentrations and body size measures in new york city children. Environ Res. 2012 doi: 10.1016/j.envres.2011.12.006. [DOI] [PMC free article] [PubMed] [Google Scholar]
- 15.Wang H, Zhou Y, Tang C, et al. Urinary phthalate metabolites are associated with body mass index and waist circumference in chinese school children. PLOS one. 2013;8(2):e56800. doi: 10.1371/journal.pone.0056800. [DOI] [PMC free article] [PubMed] [Google Scholar]
- 16.Boas M, Frederiksen H, Feldt-Rasmussen U, et al. Childhood exposure to phthalates: Associations with thyroid function, insulin-like growth factor I, and growth. Environ Health Perspect. 2010;118(10):1458–1464. doi: 10.1289/ehp.0901331. [DOI] [PMC free article] [PubMed] [Google Scholar]
- 17.Trasande L, Sathyanarayana S, Spanier AJ, Trachtman H, Attina TM, Urbina EM. Urinary phthalates are associated with higher blood pressure in childhood. J Pediatr. 2013;163(3):747–753. e1. doi: 10.1016/j.jpeds.2013.03.072. [DOI] [PMC free article] [PubMed] [Google Scholar]
- 18.Trasande L, Spanier AJ, Sathyanarayana S, Attina TM, Blustein J. Urinary phthalates and increased insulin resistance in adolescents. Pediatrics. 2013;132(3):e646–55. doi: 10.1542/peds.2012-4022. [DOI] [PMC free article] [PubMed] [Google Scholar]
- 19.Kim S, Kang S, Lee G, et al. Urinary phthalate metabolites among elementary school children of korea: Sources, risks, and their association with oxidative stress marker. Sci Total Environ. 2014;472:49–55. doi: 10.1016/j.scitotenv.2013.10.118. [DOI] [PubMed] [Google Scholar]
- 20.Biro FM, Galvez MP, Greenspan LC, et al. Pubertal assessment methods and baseline characteristics in a mixed longitudinal study of girls. Pediatrics. 2010;126(3):e583–e590. doi: 10.1542/peds.2009-3079. [DOI] [PMC free article] [PubMed] [Google Scholar]
- 21.Wolff MS, Teitelbaum SL, Pinney SM, et al. Investigation of relationships between urinary biomarkers of phytoestrogens, phthalates, and phenols and pubertal stages in girls. Environ Health Perspect. 2010:1039–1046. doi: 10.1289/ehp.0901690. [DOI] [PMC free article] [PubMed] [Google Scholar]
- 22.Caudill SP, Schleicher RL, Pirkle JL. Multi-rule quality control for the age-related eye disease study. Stat Med. 2008;27(20):4094–4106. doi: 10.1002/sim.3222. [DOI] [PubMed] [Google Scholar]
- 23.Wolff MS, Teitelbaum SL, McGovern K, et al. Phthalate exposure and pubertal development in a longitudinal study of US girls. Hum Reprod. 2014;29(7):1558–1566. doi: 10.1093/humrep/deu081. deu081 [pii] [DOI] [PMC free article] [PubMed] [Google Scholar]
- 24.Kuczmarski RJ, Ogden CL, Grummer-Strawn LM, et al. CDC growth charts: United states. Adv Data. 2000 Jun;8(314):1–27. [PubMed] [Google Scholar]
- 25.Harville DA. Maximum likelihood approaches to variance component estimation and to related problems. Journal of the American Statistical Association. 1977;72(358):320–338. [Google Scholar]
- 26.Ware JH. Linear models for the analysis of longitudinal studies. American Statistician. 1985;39(2):95–101. [Google Scholar]
- 27.Laird NM, Ware JH. Random-effects models for longitudinal data. Biometrics. 1982;38(4):963–974. [PubMed] [Google Scholar]
- 28.Fitzmaurice GM, Laird NM, Ware JH. Applied Longitudinal Analysis. Hoboken, New Jersey: John Wiley & Sons, Inc.; 2004. [Google Scholar]
- 29.Biro FM, Greenspan LC, Galvez MP, et al. Onset of breast development in a longitudinal cohort. Pediatrics. 2013;132(6):1019–1027. doi: 10.1542/peds.2012-3773. [DOI] [PMC free article] [PubMed] [Google Scholar]
- 30.Wormuth M, Scheringer M, Vollenweider M, Hungerbühler K. What are the sources of exposure to eight frequently used phthalic acid esters in europeans? Risk Analysis. 2006;26(3):803–824. doi: 10.1111/j.1539-6924.2006.00770.x. [DOI] [PubMed] [Google Scholar]
- 31.Marcovecchio ML, Chiarelli F. Obesity and growth during childhood and puberty. World Rev Nutr Diet. 2013;106:135–141. doi: 10.1159/000342545. [DOI] [PubMed] [Google Scholar]
- 32.Brambilla P, Bedogni G, Moreno L, et al. Crossvalidation of anthropometry against magnetic resonance imaging for the assessment of visceral and subcutaneous adipose tissue in children. Int J Obes. 2006;30(1):23–30. doi: 10.1038/sj.ijo.0803163. [DOI] [PubMed] [Google Scholar]
- 33.L’Allemand-Jander D. Clinical diagnosis of metabolic and cardiovascular risks in overweight children: Early development of chronic diseases in the obese child. Int J Obes. 2010;34:S32–S36. doi: 10.1038/ijo.2010.237. [DOI] [PubMed] [Google Scholar]
- 34.Moreno L, Pineda I, Rodriguez G, Fleta J, Sarria A, Bueno M. Waist circumference for the screening of the metabolic syndrome in children. Acta paediatrica. 2002;91(12):1307–1312. doi: 10.1080/08035250216112. [DOI] [PubMed] [Google Scholar]
- 35.Calafat AM, Longnecker MP, Koch HM, et al. Optimal exposure biomarkers for nonpersistent chemicals in environmental epidemiology. Environ Health Perspect. 2015;123(7):A166–8. doi: 10.1289/ehp.1510041. [DOI] [PMC free article] [PubMed] [Google Scholar]
- 36.Teitelbaum S, Britton J, Calafat A, et al. Temporal variability in urinary concentrations of phthalate metabolites, phytoestrogens and phenols among minority children in the united states. Environ Res. 2008;106(2):257–269. doi: 10.1016/j.envres.2007.09.010. [DOI] [PubMed] [Google Scholar]
Associated Data
This section collects any data citations, data availability statements, or supplementary materials included in this article.