

Abstract
Pancreatic cancer is one of the deadliest human malignancies and lack of effective diagnostic and therapeutic methods. Accumulating evidence suggests that the neurotensin (NT) and neurotensin receptors (NTRs) play key roles in pancreatic adenocarcinoma growth and survival. In this study, we not only evaluate the NTR1 expression in pancreatic cancer patient samples, but also explore the PET and fluorescence imaging of NTR1 expression in pancreatic cancer animal models. The NTR1 expression was evaluated by immunohistochemistry staining in clinical patient tissue samples with pancreatic ductal adenocarcinoma, insulinoma, and pancreatitis. The results showed 79.4% positive rate of NRT1 expression in pancreatic ductal adenocarcinoma, compared with 33.3% and 22.7% in insulinoma and pancreatitis samples, respectively. High NTR1 gene expression was also found in Panc-1 cells and confirmed by cell immunofluorescence. 64Cu-AmBaSar-NT and IRDye800-NT were synthesized as imaging probes and maintained the majority of NTR1 binding affinity. In vivo imaging demonstrated that 64Cu-AmBaSar-NT has prominent tumor uptake (3.76 ± 1.45 and 2.29 ± 0.10 %ID/g at 1 and 4 h post injection). NIR fluorescent imaging with IRDye800-NT demonstrated good tumor to background contrast (8.09 ± 0.38 ×10⁸ and 6.67 ± 0.43 ×10⁸ (p/s/cm2/sr)/(μW/cm2) at 30 and 60 min post injection). Fluorescence guided surgery was also performed as a proof of principle experiment. In summary, our results indicated that NTR1 is a promising target for pancreatic ductal adenocarcinoma imaging and therapy. The imaging probes reported here may not only be considered for improved diagnosis of pancreatic ductal adenocarcinoma, but also has the potential to be fully integrated into patient screening and treatment monitoring of future NTR1 targeted therapies.
Keywords: Neurotensin receptor, Positron emission tomography, Pancreatic ductal adenocarcinoma, Fluorescence imaging, Imaging guided surgery
INTRODUCTION
Pancreatic ductal adenocarcinoma is one of the deadliest human malignancies, with an extremely poor 5-year survival rate (Rahib et al. 2014; Siegel et al. 2015). Although there has been some improvement in the strategies used to diagnose and treat pancreatic cancer, its prognosis is still poor, due to the difficulty with early detection, differentiating benign from malignant pancreatic lesions, and its aggressive growth behavior (Chakraborty et al. 2011; Hamada and Shimosegawa 2011; Raimondi et al. 2010). There is a clear need to develop new diagnostic and therapeutic methods targeting both primary and metastatic pancreatic ductal adenocarcinoma. Recent advances in pancreatic cancer tumor biology allows for a more complete understanding of the genetic and epigenetic changes in pancreatic ductal adenocarcinoma development, metastasis and progression (Hidalgo 2010; Vincent et al. 2011; Wolfgang et al. 2013; Ying et al. 2016). Identification of molecular markers that contribute to pancreatic tumorigenesis will provide unprecedented opportunities for the development of molecular imaging technologies for the precise diagnosis and treatment monitoring of pancreatic ductal adenocarcinoma.
Accumulating evidence suggests that neurotensin (NT) and neurotensin receptors (NTRs) play key roles in pancreatic ductal adenocarcinoma growth and survival (Kapuscinski et al. 1990; Mijatovic et al. 2007; Reubi et al. 1998; Wang et al. 2000a). Using a sensitive RT-PCR procedure, NTR expression was detected in approximately 88% of resected patient tumors and in 5 of 5 patient-derived xenograft tumors (Ehlers et al. 2000). It has been shown that primary pancreatic ductal adenocarcinomas have high NTR expression compared with normal pancreas and chronic pancreatitis samples as well as neuro endocrine tumors of the pancreas (Kapuscinski et al. 1990; Reubi et al. 1998; Wang et al. 2000a; Wang et al. 2000b). The selective and high expression of NTRs in ductal pancreatic adenocarcinomas and metastases has made them an important and promising target (Körner et al. 2015).
Based on the selectivity of NT/NTR expression in pancreatic ductal adenocarcinomas, we hypothesize that NTR expression may be used as both a diagnostic and treatment monitoring tool.
PET imaging has a series of advantages including high sensitivity, very low concentrations of tracer molecules, unlimited depth of penetration, and quantitative properties (Beer et al. 2011; Schlyer 2004). Previously, our group and others have reported several tracers using radiolabeled NT analogue for human colon adenocarcinoma imaging (Alshoukr et al. 2011; Deng et al. 2015; Maschauer et al. 2016; Schulz et al. 2016; Wu et al. 2014). In contrast, fluorescent imaging is relatively low cost, safe and easy to operate since it does not require ionizing radiation or radioactive materials, which make it easily applicable for intraoperative tumor margin identification (Chen et al. 2008; Jennings and Long 2009; Liu et al. 2013; Seibold et al. 2014).
There have been initial clinical studies assessing the safety and biodistribution of some NTR targeting ligands (Buchegger et al. 2003; Kulkarni et al. 2015). However, they suffered from a small sample size and thus making it less convincing. In this study, we evaluate NTR1 expression in over a hundred human pancreatic adenocarcinomas, chronic pancreatitis and endocrine pancreatic tumor samples by immunohistochemistry staining. Two NTR1 targeted imaging probes were then evaluated in a NTR1 positive tumor model: 64Cu-AmBaSar-NT was used as a PET diagnostic agent and the IRDye800-NT was used as a NIR1 tracer in optical imaging and imaging guided surgery (Fig 1).
Fig 1.
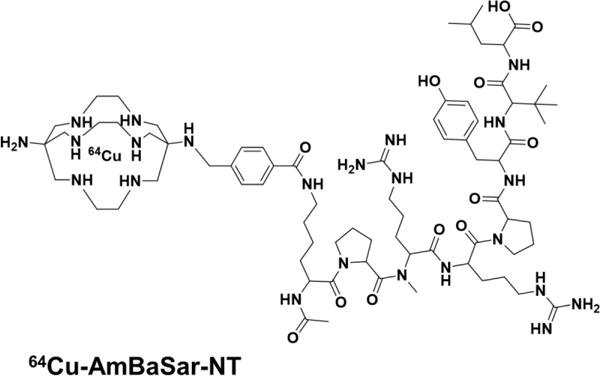
Chemical structures of 64Cu-AmBaSar-NT and IRDye800-NT.
Materials and methods
General
All chemicals and solvents were obtained from commercial sources and used without further purification. AmBaSar was synthesized by our research group according to literature reported procedure (Liu et al. 2012). Lys-NT20.3 peptide (NT) was purchased from CS Bio Co. IRDye800-NHS was purchased from LI-COR Biosciences. 64CuCl2 was obtained from University of Wisconsin (Madison, WI). Rabbit anti-human NTR1 (ab117592), goat anti-rabbit IgG H&L (Alexa Fluor® 488) and goat anti-rabbit IgG H&L (HRP) were purchased from Abcam.
Immunohistochemistry staining
All paraffin sections were dewaxed twice using dimethylbenzene and hydrated with anhydrous ethanol, 95%, 85%, 70% ethanol and PBS in sequence. Then the sections were immersed in 0.01 M citrate buffer (pH6.0) and loosely covered with aluminum foil before putting in the microwave oven. The microwave power was adjusted to P100, P80 and P50 and the sections were heated for 7 min, 7 min and 6 min respectively. After heating, the sections were cooled at room temperature and washed with PBS for 4 times. 3% H2O2 was used to neutralize the endogenous peroxidase. The section was blocked with goat anti-rabbit antiserum for 1 h at 37°C. Then the rabbit anti-human NTR1 (1:500) was added to the section and incubate at 4oC overnight. After washing with PBS for 3 times, goat anti-rabbit IgG secondary antibody (1:1000) was added and incubated at 37oC for 30 min. Then the sections were stained with 3,3′-Diaminobenzidine (DAB) and hematoxylin.
Evaluation of the immunohistochemistry results
The immunohistochemistry results were evaluated by two experienced pathologists as double-blind study. Five high visions (×400) were selected randomly to calculate the mean value based on the following methods: 0 is scored when target tissue was dyed as background color. 1 point, 2 points and 3 points are scored when the color was yellow, yellow-brown and brown, respectively. The number of positive cells within the field of view was also counted. 0, 1, 2, 3 and 4 points was score when the positive cells were less than 5%, 6% ~ 25%, 26% ~ 50%, 51% ~ 75% and over 75%, respectively. The summation of all the results was evaluate with the below criteria :0 points (−) negative, l ~ 3 points (+) weakly positive, 4 ~ 5 points (+ +) medium positive, 6 points or more (+ + +) strong positive. Integrated optical density (iOD) value of each staining slide was also measured.
Chemistry and radiochemistry
AmBaSar-NT was synthesized with our previously reported procedure (Deng et al. 2016). For IRDye800-NT, IRdye800-NHS (200 μg, 0.17 μmol) was dissolved in 10 μL DMSO followed by adding Lys-NT20.3 (520 μg, 0.47 μmol) in 20 μL acetonitrile. 2 μL DIPEA was then added to the mixture and stayed for 2 h at room temperature in dark. The reaction mixture was purified by HPLC and the products were confirmed by MALDI-TOF: IRDye800-NT (C98H136N17Na3O25S4, calculated [M+H]+: 2148.85) observed m/z 2148.16. 64Cu labeling reactions were performed according to our previously reported protocol (Deng et al. 2015).
Cells and animals
Pancreatic adenocarcinoma cell line AsPC-1 was obtained from the Tissue Culture Facility of UNC Lineberger Comprehensive Cancer Center. The pancreatic adenocarcinoma cell lines Panc-1 and SW1990 were purchased from the Central South University’s advanced cell research center. Panc1 cells were cultured in DMEM high glucose medium, SW1990 and AsPC-1 cells were cultured in RPMI-1640 medium. All medium was added with 10 % fetal bovine serum (FBS) and the cells were cultured in a humidified atmosphere of 5% CO2 at 37°C. When grown to 80% confluence, the cells were detached with 0.05% trypsin-EDTA for cell binding assay or animal tumor injection. Animal procedure was performed according to a protocol approved by the UNC Institutional Animal Care and Use Committee. Male athymic nude mice and of 4–6 weeks were purchased from Animal Study Facility of UNC-Chapel Hill. All work performed on animals were in accordance with and approved by UNC institutional Animal Care and Use Committee. Each mouse was subcutaneously injected with AsPC-1 pancreatic adenocarcinoma cells at a concentration of 1 × 10⁶ cells per 0.1 mL in the shoulder. Animals were subjected to further imaging experiments when the tumors grew to at least 3 mm in diameter.
Cell binding assay
The competitive cell binding assay was used to assess the in vitro NTR1 binding affinity and specificity of NT-IRDye800 and NT-AmBaSar based on the previous reported method (Alshoukr et al. 2011; Wu et al. 2014). In brief, 50% inhibitory concentration (IC50) for the binding to living HT29 cells was determined by competitive receptor binding between 125I-labeled neurotensin (Perkin-Elmer) and non-radiolabeled NT analogs. HT29 cells (2 × 10⁶ cells) were rinsed with 500 μL DMEM supplemented with 0.2% BSA and incubated for 60 min at 37°C with 125I-neurotensin (0.25 uCi, 300 μL DMEM, 0.2% BSA, 0.8 mM 1, 10-phenanthroline) in the presence of increasing concentrations of non-radiolabeled IRDye800-NT, AmBaSar-NT, or unmodified NT peptide. After being washed twice with ice-cold DMEM 0.2% BSA, cells were lysed in 1 mL 2 N NaOH and radioactivity was counted using 2480 WIZARD2 gamma counter (Perkin Elmer). The data were fitted with nonlinear regression using GraphPad Prism (GraphPad Software) to calculate the 50% inhibitory concentration (IC50) value. Experiments were performed in triplicate.
Reverse transcription PCR (RT-PCR) for NTR1 gene expression
The total RNA of the Panc-1 and SW1990 cell lines were extracted using RNAiso Plus reagent (TaKaRa Inc. Japan). The RNAs were then dissolved in the nuclease-free water to measure the concentration and purity with an ultramicro UV-VIS spectrophotometer. All the RNAs were reverse transcribed into cDNA under the manufacturer’s instructions of PrimeScript™ RT reagent Kit with gDNA Eraser (TaKaRa Inc. Japan). The primers used for RNAs’ amplification were: NTR1-FP:5′-GGAGTGGGCTCAGAGTCTAGCAA-3′,NTR1-RP:5′-CTCAGAAATTATGGCCCAAGGTC-3′,β-Actin-FP:5′-GCACCACACCTTCTACAATGAGC-3′,β-Actin-RP:5′- GGATAGCACAGCCTGGATAGCAAC-3′. β-Actin acted as an internal control to evaluate the relative expression of NTR1. SYBR® Premix Ex TaqTM II kit (TaKaRa Inc. Japan) was used for fluorescent quantification.
Cell immunofluorescence
The cells were fixed with pre-cooled 4% paraformaldehyde and 0.2% Triton-X-100 was used to permeabilize the membrane for 20 min. After blocking with goat anti-rabbit serum and washing 4 times in PBS, the rabbit anti-human NTR1 antibody (1:400) were added to the cells and the cells were incubated in 4°C overnight. Then, secondary antibody (1:400) was incubated with the cells in 37°C for 50 min in dark. The cells were then washed with PBS three times before stained with 4,6-diamidino-2-phenylindole (DAPI). Photos were taken with fluorescence microscope and analyzed by the Image-Pro Plus software.
Biodistribution study and small animal PET imaging
PET scans and image analysis were performed on mouse bearing AsPC-1 xenograft. Briefly, 3.7 MBq (~100 μL) of the 64Cu-AmBaSar-NT was injected into each animal via the tail vein (n=3/group). At 1 and 4 h post injection, the mice were anesthetized under 2% isoflurane in oxygen and static emission scans were acquired for 10 min using small animal PET scanner (GE eXplore Vista). The region of interest (ROIs) were drawn over the tumor and other organs and converted to %ID/g (percentage of injected dose per gram of tissue) based on the assumption that the tissue density is 1 g/mL. Biodistribution study was performed at 4h post injection after PET scan. Tissues and organs of interest were harvested and weighed. Radioactivity in each sample was measured by γ counting and the radioactivity uptake was calculated as %ID/g. The mean uptake and standard deviation was calculated for each group.
In vivo NIR fluorescence imaging
Fluorescence imaging was performed using IVIS Kinetic optical imaging system (Caliper Life Sciences, Alameda, CA, USA). An ICG filter set was used for acquiring images for 10 s exposure time (f/stop=4). Each mouse was injected 2 nmol of NT-IRDye800 intravenously and subjected to fluorescence imaging at 0.5 and 1 hour post injection. For blocking group, the probe was coinjected with 100 μg of NT20.3 peptide (n=3/group). The mean fluorescence for each group was reported. The mouse was then subjected to optical guided surgery after 1 h post injection imaging.
Data analysis
Quantitative data are expressed as mean ± SD except for the semi-quantification of NTR1 expression in pancreatic diseases are expressed as median value. Means were compared using one-way ANOVA and Student’s t test using Graphpad Prism (GraphPad Software). P value of less than 0.05 were considered as statistically significant.
Results
Immunohistochemistry Tissue Staining in Different Pancreatic Diseases
In order to evaluate NTR1 expression in different types of pancreatic diseases, we performed immunohistochemistry staining of NTR1 on different pancreatic diseases, including pancreatic ductal adenocarcinomas, pancreatic neuroendocrine neoplasms, and pancreatitis samples. Over one hundred patient samples are evaluated. It was found that 79.4% of the pancreatic ductal adenocarcinomas were NTR1 positive as defined by the criteria discussed above. In contrast, only 33.3% of pancreatic neuroendocrine neoplasms and 22.7% of chronic pancreatitis samples stained are positive, respectively (P<0.001). Inpatient demographics and tumor characteristics are shown in Table 1.
Table 1.
The expression of NTR1 in Ductal adenocarcinoma (n=131), pancreatitis (n=44) and insulinoma (n=9).
| n | NTR1 | X2 | P Value | ||
|---|---|---|---|---|---|
| Positive | Negative | ||||
| Pancreatic diseases | 49.404 | 0.000 | |||
| Ductal adenocarcinoma | 131 | 104 | 27 | ||
| Pancreatitis | 44 | 10 | 34 | ||
| Insulinoma | 9 | 3 | 6 | ||
| Gender | 7.45 | 0.006 | |||
| Male | 115 | 64 | 51 | ||
| Female | 69 | 53 | 16 | ||
| Age | 3.412 | 0.065 | |||
| <50 | 60 | 32 | 28 | ||
| ≥50 | 124 | 85 | 39 | ||
| Pathological grading of cancer | 5.216 | 0.064 | |||
| Well | 34 | 31 | 3 | ||
| Moderate | 76 | 59 | 17 | ||
| Poorly | 21 | 14 | 7 | ||
Representative immunohistochemistry images are shown in Fig 2: an NTR1 positive sample of pancreatic ductal adenocarcinoma (Fig. 2A), compared to an NTR1 negative sample of an insulinoma (Fig. 2B) or a chronic panreatitis (Fig. 2C) sample. Semi-quantification of the staining patterns is shown in Fig 2D. The median iOD (integrated optical density) value for pancreatic ductal adenocarcinoma is 0.113 while the value for insulinoma and pancreatitis is 0.062 and 0.057, respectively. Clearly, NTR1 is a promising target for pancreatic ductal adenocarcinoma.
Fig 2.
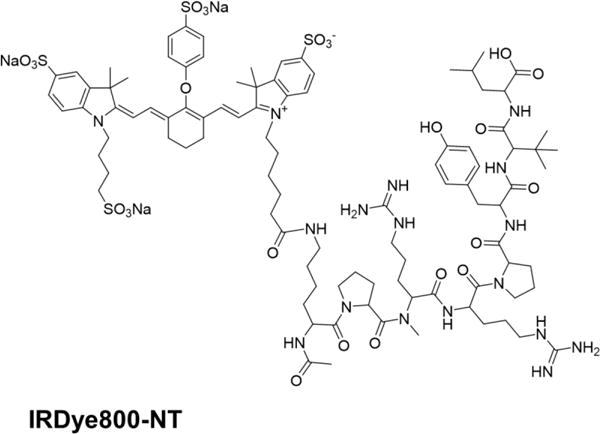
(a) A representative immunohistochemistry staining in pancreatic ductal adenocarcinoma showed NTR1 positive result; (b)、(c) Representative immunohistochemistry tissue stainings in chronic pancreatic endocrine tumor and pancreatitis showed both samples are NTR1 negative. (d) Semi-quantification of NTR1 expression in pancreatic ductal adenocarcinoma gave higher median iOD value than that of in pancreatitis and insulinoma.
In Vitro Cell Binding Affinity
The binding affinity of two NTR1 targeted probes is evaluated using cell binding assay and the results are shown in Fig 3A. Both IRDye800-NT and AmBaSar-NT could inhibit the binding of 125I-NT (8–13) in a concentration dependent manner. The IC50 value for IRDye800-NT and AmBaSar-NT was 16.66 ± 1.31 nM and 9.96 ± 1.18 nM, respectively. Compared with NT20.3 (9.38 ± 0.77 nM), both imaging probes have comparable NTR1 binding affinity to the parent peptide.
Fig 3.
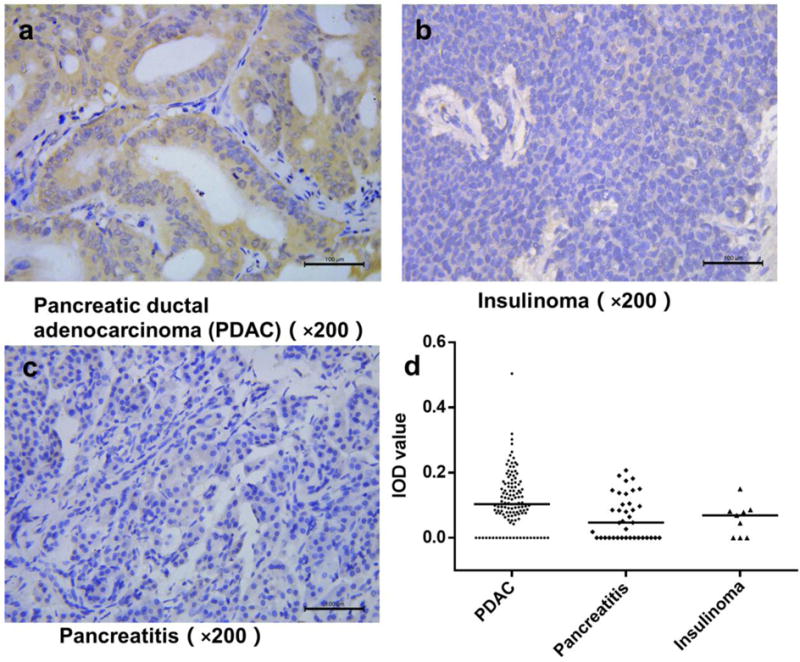
(a) Cell binding assay results of IRDye800-NT and AmBaSar-NT showed comparable binding affinity to unmodified NT peptide (n=3/group). (b) The relative level of NTR1 mRNA expression in Panc-1 was significantly (P<0.05) higher than the control SW1990 cells. Results are normalized to SW1990 expression level. (c)Panc-1 cells showed stronger fluorescence intensity compared with SW1990 cells in cell immunofluorescent study.
NTR1 Expression in Pancreatic Adenocarcinoma Cell Line and Tumor Models
Panc-1 and SW1990 cells were evaluated for NTR1 gene expression. We first studied the relative expression of NTR1 mRNA in these cell lines (SW1990 was used as a control). As shown in Fig. 3B, Panc-1 cell had a higher relative value of 687.83 ± 243.99 when we use the NTR1 gene expression level of SW1990 cells as a reference value. This was also confirmed by the cell immunofluorescence results shown in Fig. 3C: while both SW1990 and Panc-1 cell lines have NTR1 receptor present in cytoplasm, Panc-1 cells show a stronger fluorescence intensity compared with SW1990 cells. In addition to gene level, NTR1 expression was also evaluated in tumor tissues. Representative immunohistochemistry staining has shown strong NTR1 expression on both AsPC-1 and Panc-1 xenograft tumor tissues (Fig. 4), suggesting both models are suitable for testing NTR1 targeted imaging agents.
Fig 4.
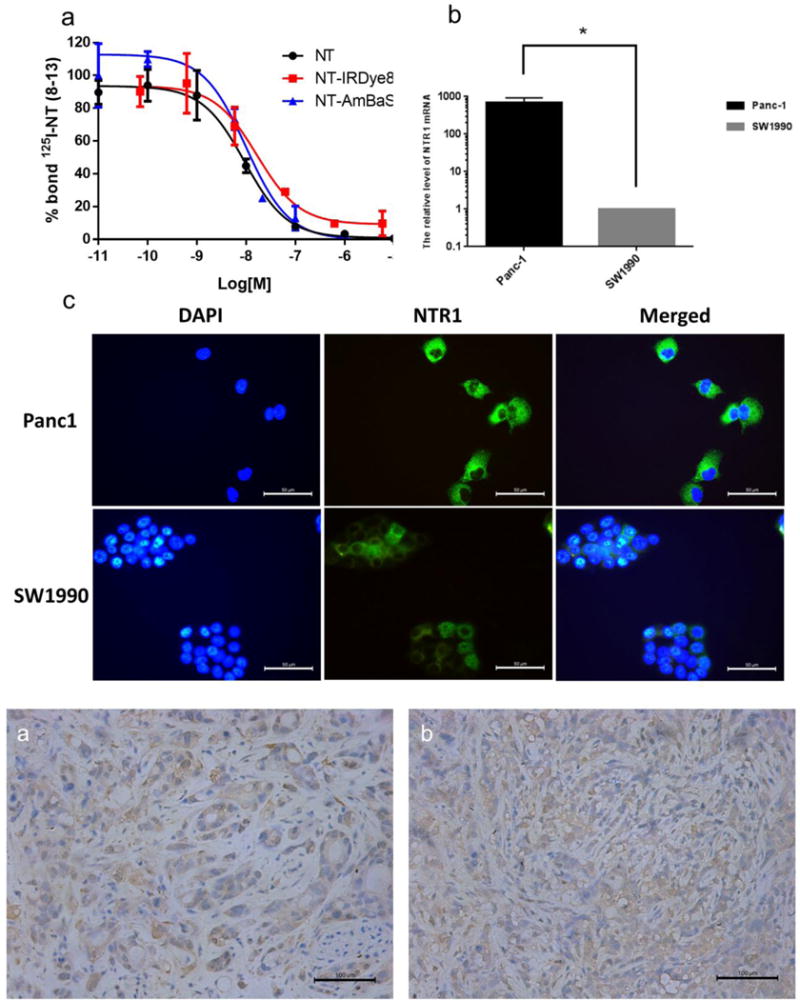
Immunohistochemistry staining showed strong NTR1 expression in both (a) AsPC1 tumor tissue and (b) Panc1 tumor tissue
Small Animal PET Imaging and Biodistribution
In order to validate that NTR1 could serve as a PET imaging target, 64Cu-AmBaSar-NT was prepared and evaluated in AsPC-1 xenografts (NTR1 positive). As shown in Fig 5A, the tumor can be clearly visualized with good tumor to background contrast at both time points (1 and 4 h, p.i.). High kidney uptake was observed which was decreased significantly at late time point. The tumor uptake was 3.76 ± 1.45 and 2.29 ± 0.10 %ID/g at 1 and 4 h post injection, respectively (Fig 5B). In addition to the small animal PET study, biodistribution studies were also performed 4 h after the injection. As shown in Fig 5C, tumor and kidney has the highest uptake with 2.63 ± 0.55 and 2.81 ± 0.33 %ID/g. Liver and intestine showed uptake with 1.10 ± 0.04 and 1.21 ± .032 %ID/g while other organs were essentially at background levels. The prominent tumor uptake at all time points and the high tumor to background contrast clearly demonstrated that NTR1 is a valid diagnosis target for PET imaging in pancreatic ductal adenocarcinoma.
Fig 5.
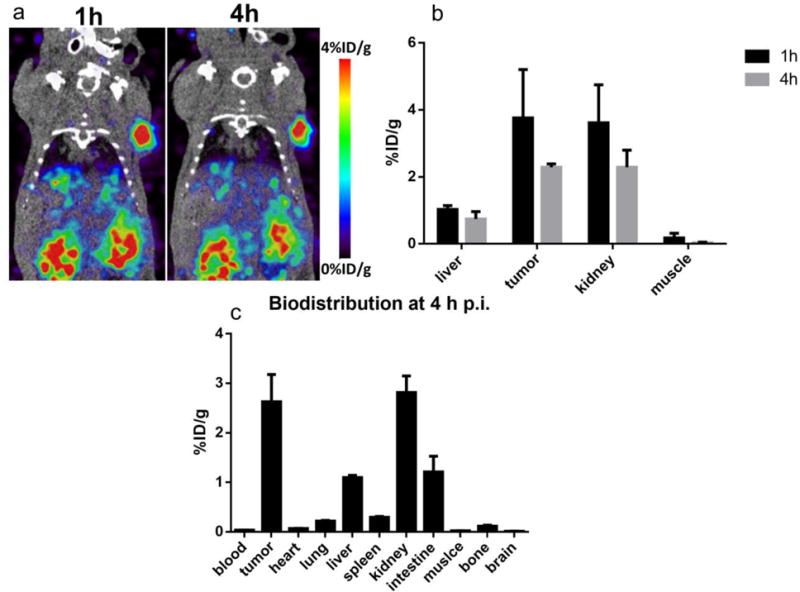
(a) MicroPET images of mice bearing AsPC1 tumor models at 1 h and 4 h post injection of 64Cu-AmBaSar-NT (n=3) showed clear tumor to background contrast. (b) The tumor uptake was 3.76 ± 1.45 and 2.29 ± 0.10 %ID/g at 1 and 4 h post injection based on quantitative results derived from microPET images. (c) Biodistribution of 64Cu-AmBaSar-NT in AsPC1 tumor models at 4 h post injection (n=3) confirmed the tracer has high uptake in tumor and kidney.
Fluorescent Imaging
Different from PET imaging, fluorescent imaging is relatively low cost, safe and easy to operate since it does not require ionizing radiation or radioactive materials. In order to demonstrate that NTR1 could be used in optical screening of pancreatic cancers, NT-IRDye800 was tested on AsPC-1 xenografts. Similar to PET imaging, tumors could be clearly visualized at time points examined (Fig. 6A) with high tumor to background ratio. The specificity of the probe was confirmed by a blocking experiment in which tracers was coinjected with an excess amount of unlabeled NT20.3. As can be seen from Fig. 6A and 6B, in the presence of unlabeled NT20.3, the tumor uptake [5.93 ± 0.21 ×10⁸ and 4.29 ± 0.29 ×10⁸ (p/s/cm2/sr)/(μW/cm2) at 30 and 60 min post injection, respectively] was significantly (P<0.05) lower than that without NT [8.09 ± 0.38 ×10⁸ and 6.67 ± 0.43 ×10⁸ (p/s/cm2/sr)/(μW/cm2) at 30 and 60 min post injection, respectively].
Fig 6.
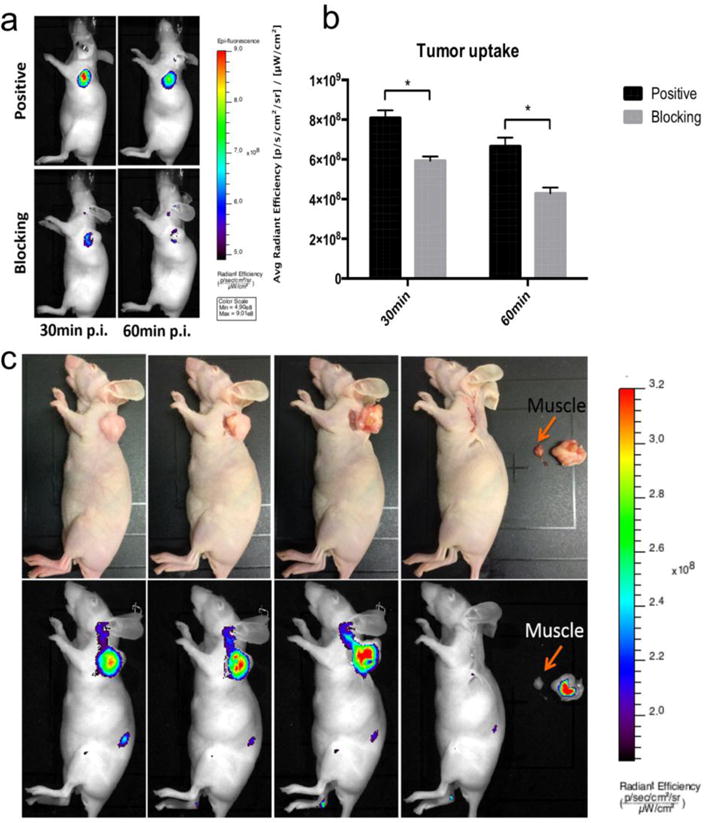
(a) Representative in vivo fluorescent images of AsPC1 tumor-bearing mice at 30 min and 60 min post injection of NT-IRDye800 showed clear tumor contrast in positive group and the tracer specificity was confirmed by blocking group (n=3/group). (b) The quantitative tumor uptakes derived from fluorescent imaging was significantly (P<0.05) different at both time points in positive and blocking group. (c) Mouse bearing AsPC1 tumor at 1 h post injection of NT-IRDye800. The tumor lesion could be successfully removed by fluorescent-imaging guided surgery. Upper row are digital pictures during the surgery and lower row are fluorescent images
Image-Guided Surgery
Another potential application of NTR1 targeted optical imaging is on intraoperative tumor identification. As a proof of principle experiment, mice with AsPC-1 xenografts were imaged by fluorescence imaging at 1 h post injection and followed by image-guided surgery of the tumors (n=3). In brief, the precise tumor location was identified by NIR fluorescence imaging first. Then the tumors were resected under fluorescence guidance. These steps were repeated to ensure a complete resection of the tumor. In Fig. 6C, the feasibility for intraoperative image-guided surgical resection of the tumor nodules using NTR1 as a target is shown.
Discussion
While tumor markers are key elements in pancreatic cancer diagnosis and therapy, being able to image the size of a tumor, its location and its molecular characteristics provides a crucial diagnostic/monitoring tool that directly impacts patient management and informs possible treatment strategies. Given the urgency of these diagnostic and therapeutic needs, a great deal of interest is being devoted to cancer-specific imaging techniques that can be used for internal organs such as the pancreas.
Currently there are several biomarkers (such as CA19-9 and CEA) being used to detect pancreatic cancers (Kruttika et al. 2012; Lamerz 1999; Naghibalhossaini et al. 2007). The elevated serum level of these antigen and proteins showed close correlation in patients with locally advanced or metastatic unresectable pancreatic cancer (Tsavaris et al. 2009). Despite their clinical usefulness, these tumor markers are not effective for the early detection of small pancreatic cancer, since elevated biomarker levels in the serum indicate the presence of a significant number of cancer cells. Moreover, they failed to provide the exact location of the cancer lesions thus making it difficult for therapy. Indeed, even after the tumor has been fully resected, the outcome in patients with early pancreatic cancer is disappointing (Hidalgo 2010). There is clearly a need to develop new diagnostic and therapeutic methods targeting both primary and metastatic pancreatic cancer. In this study, we aim to evaluate whether NTR1 could be a valid target for pancreatic cancer imaging, and potentially therapy in the future.
NT acts through its high-affinity G-protein-coupled receptor (NTR) to regulate a variety of functions in the gastrointestinal tract, including stimulation of pancreatic and biliary secretion, colonic motility, and growth of normal intestinal mucosa and pancreas (Kulinska-Niedziela and Paluszak 1997). In addition, NTR stimulation has been shown to promote carcinogenesis and to exert a trophic effect on human colon cancer cell lines both in vitro and in vivo (Ehlers et al. 2000; Evers et al. 1992; Wang et al. 2006). NTR mRNA expression was found in 88% of the surgical specimens examined and pancreatic ductal adenocarcinoma xenografts. In contrast, other peptide receptors which might be presented in pancreatic ductal adenocarcinoma, including VIP receptors (VIPR), substance P receptors (SPRs), and gastrin-releasing peptide (GRP) expression was detected in only 31%, 27%, and 8% of pancreatic ductal adenocarcinoma examined, respectively (Ehlers et al. 2000). In another study, enhanced expression of NTR1 mRNA was observed in pancreatic ductal adenocarcinoma; however, relatively high levels of NTR mRNA also presented in chronic pancreatitis (CP) which excludes NTR1 mRNA as a specific parameter for pancreatic ductal adenocarcinoma and for the differentiation of pancreatic ductal adenocarcinoma from CP (Wang et al. 2000a). However, the presence of NTR1 mRNA in resected human pancreas doesn’t necessarily correspond to the expression of the functional NTR1 in these patients. In addition, pancreatic adenocarcinoma is often comprised of a large number of nontumorous cells, including stroma and mesenchymal cells. RT-PCR performed using total tissue RNA extract may not be able to distinguish the NTR1 expression on these surrounding cells or on the tumor cells. Moreover, it is still under debate where the level of NTR1 expression correlate with tumor stage or clinical outcomes.
Instead of focusing on mRNA analysis, in our study, IHC was performed in paraffin embedded patient samples to directly assess NTR1 protein expression in in pancreatic ductal adenocarcinoma, insulinoma, and CP (Table1). Although NTR1 mRNA expression couldn’t differentiate pancreatic ductal adenocarcinoma from CP, NTR1 protein expression was overserved in 79.4% pancreatic ductal adenocarcinoma patients, but only 22.7% pancreatitis patients (p<0.001). This result suggested that detection of NTR1 expression at protein level may be used to facilitate the differential diagnosis of pancreatic ductal adenocarcinoma from CP, which also justified the importance of development of NTR1 targeting imaging probes for diagnostic imaging. However, no association was observed between NTR1 expression level and pathological grading of pancreatic ductal adenocarcinoma (p=0.064), which indicated that NTR1 imaging may have limited application for cancer staging. We do like to point out that the NTR1 expression level analysis is only semi-quantification, which need to be improved in the future. Nonetheless, it clearly demonstrated NTR1 is a promising target for pancreatic cancer research.
With the encouraging histology data on hand, we then confirmed that both Panc-1 and AsPC1 are NTR1 positive (this is also confirmed by previous literature report) (Na et al. 2015; Olszewski and Hamilton 2009). We would like to point out that we also observed cytoplasmic localization of NTR1 based on cell staining results (Fig 3), which should mainly present on the plamsa membrane. Previously, it has been reported that both prostate cancer and Ewing’s sarcoma cells might have NT/NTR1 autocrine loop pathway to promote cell proliferation and leads to NTR1 internalization after forming complex with NT peptide (Reubi et al. 1999; Sehgal et al. 1994; Valerie et al. 2011). Therefore, the observed cytoplasmic signal in pancreatic ductal adenocarcinoma cells here could possibly be caused by the internalization of NTR1 in the presence of NT. Further experiments will be needed to confirm this hypothesis. AsPC1 tumor model was used thereafter to study NTR1 targeted PET and fluorescent imaging agents. As mentioned above, PET imaging has advantage in detecting metastasis, recurrence, and monitoring response to therapy non-invasively. The encouraging PET imaging results in Fig. 5 clearly demonstrated the feasibility of targeting NTR1 for pancreatic ductal adenocarcinoma imaging. Despite the encouraging imaging result on NTR1 targeted PET agent, this approach will not be feasible for patient screening due to the overall low incident rate of pancreatic ductal adenocarcinoma, radiation exposure and high cost. Therefore, fluorescence imaging was then proposed to be used for potential screening and image-guided surgery. Optical imaging has similar picomolar or nanomolar sensitivity compared to PET but does not require ionizing radiation, which enables repeated imaging without radiation risks. Moreover, optical imaging is relatively cheap and imaging agents are easier to generate than PET tracers. As for the depth penetration issue in optical imaging, using NIR light and advanced more sensitive detection equipment, penetration depth in human tissue is now possible up to 15 cm (Herranz and Ruibal 2012). The result in Fig. 6 showed that NTR1 can successfully locate the pancreatic ductal adenocarcinoma tumor in optical imaging and may facilitate imaging guided surgery. This further proved our hypothesis that NTR1 targeted fluorescence imaging can be used for potential screening.
Conclusion
In order to evaluate the potential of using NTR1 as a target for imaging and therapy in pancreatic ductal adenocarcinoma, immunohistochemistry staining of NTR1 was performed on patient tissue samples, which demonstrated the high incident rate of NTR1 expression in pancreatic ductal adenocarcinoma. With this encouraging data in hand, we tested both PET and fluorescent NTR1 targeting probes in AsPC1 tumor model (NTR1 positive). Both agents provided prominent tumor uptake and good tumor to background contrast. The imaging probes reported here could potentially not only be used for precise diagnosis of pancreatic ductal adenocarcinoma, but also be fully integrated into patient screening (using optical probe) and treatment monitoring of NTR1 targeted therapy.
Acknowledgments
This work was supported by UNC Lineberger Comprehensive Cancer Center (pilot fund to Wu), Radiology Department and BRIC, P30-CA016086-35-37 from the National Cancer Institute, and the National Natural Science Foundation of China (NSFC) (Grant No.81471689). We would also like to acknowledge Dr. Jen Jen Yeh at UNC for proof reading and editing the manuscript.
Footnotes
Conflict of interest: The authors declare that they have no conflicts of interest.
Compliance with Ethical Standards
Conflict of interest: The authors declare that no conflicts of interest were disclosed.
Ethical approval: All applicable international, national, and/or institutional guidelines for the care and use of animals were followed. All procedures performed in studies involving human participants were in accordance with the ethical standards of the institutional and/or national research committee and with the 1964 Helsinki declaration and its later amendments or comparable ethical standards. Human subjects were recruited from the Pathology Department of Xiangya Hospital of Central South University from April 2010 to October 2015. All tissues were fully anonymized and de-identification before they were accessed for this study. Informed consent was obtained from all individual participants included in the study.
Informed consent: Informed consent was obtained from all individual participants included in the study.
References
- Alshoukr F, et al. Novel DOTA-Neurotensin Analogues for 111In Scintigraphy and 68Ga PET Imaging of Neurotensin Receptor-Positive. Tumors Bioconjugate Chemistry. 2011;22:1374–1385 d. doi: 10.1021/bc200078p. [DOI] [PubMed] [Google Scholar]
- Beer AJ, Kessler H, Wester H-J, Schwaiger M. PET Imaging of Integrin αVβ3 Expression Theranostics. 2011;1:48–57. doi: 10.7150/thno/v01p0048. [DOI] [PMC free article] [PubMed] [Google Scholar]
- Buchegger F, et al. Radiolabeled Neurotensin Analog, 99mTc-NT-XI, Evaluated in Ductal Pancreatic Adenocarcinoma Patients. Journal of Nuclear Medicine. 2003;44:1649–1654. [PubMed] [Google Scholar]
- Chakraborty S, Baine MJ, Sasson AR, Batra SK. Current status of molecular markers for early detection of sporadic pancreatic cancer Biochimica et Biophysica Acta (BBA) - Reviews on Cancer. 2011;1815:44–64. doi: 10.1016/j.bbcan.2010.09.002. [DOI] [PMC free article] [PubMed] [Google Scholar]
- Chen K, Li Z-B, Wang H, Cai W, Chen X. Dual-modality optical and positron emission tomography imaging of vascular endothelial growth factor receptor on tumor vasculature using quantum dots European. Journal of Nuclear Medicine and Molecular Imaging. 2008;35:2235–2244. doi: 10.1007/s00259-008-0860-8. [DOI] [PubMed] [Google Scholar]
- Deng H, Wang H, Wang M, Li Z, Wu Z. Synthesis and Evaluation of 64Cu-DOTA-NT-Cy5.5 as a Dual-Modality PET/Fluorescence Probe to Image Neurotensin Receptor-Positive Tumor Molecular Pharmaceutics 12:3054–3061. 5 as a Dual-Modality PET/Fluorescence Probe to Image Neurotensin Receptor-Positive Tumor Molecular Pharmaceutics. 2015;12:3054–3061. doi: 10.1021/acs.molpharmaceut.5b00325. [DOI] [PMC free article] [PubMed] [Google Scholar]
- Deng H, et al. The Synthesis and Evaluation of 64Cu-DOTA-NT, 64Cu-NOTA-NT and 64Cu-AmBaSar-NT for PET Imaging of Neurotensin Receptor. Prostate Cancer Journal of Nuclear Medicine. 2016;57(suppl):1067. [Google Scholar]
- Ehlers RA, et al. Gut Peptide Receptor Expression in Human Pancreatic. Cancers Annals of Surgery. 2000;231:838–848. doi: 10.1097/00000658-200006000-00008. [DOI] [PMC free article] [PubMed] [Google Scholar]
- Evers BM, Ishizuka J, Chung DH, Townsend CM, Thompson JC. Neurotensin expression and release in human colon cancers. Annals of Surgery. 1992;216:423–431. doi: 10.1097/00000658-199210000-00005. [DOI] [PMC free article] [PubMed] [Google Scholar]
- Hamada S, Shimosegawa T. Biomarkers of Pancreatic. Cancer Pancreatology. 2011;11:14–19. doi: 10.1159/000323479. [DOI] [PubMed] [Google Scholar]
- Herranz M, Ruibal A. Optical Imaging in Breast Cancer Diagnosis. The Next Evolution Journal of Oncology. 2012;2012:10. doi: 10.1155/2012/863747. [DOI] [PMC free article] [PubMed] [Google Scholar]
- Hidalgo M. Pancreatic Cancer New England Journal of Medicine. 2010;362:1605–1617. doi: 10.1056/NEJMra0901557. [DOI] [PubMed] [Google Scholar]
- Jennings LE, Long NJ. ‘Two is better than one’-probes for dual-modality molecular imaging Chemical Communications. 2009:3511–3524. doi: 10.1039/b821903f. [DOI] [PubMed] [Google Scholar]
- Kapuscinski M, Shulkes A, Read D, Hardy KJ. Expression of Neurotensin in Endocrine Tumors. The Journal of Clinical Endocrinology & Metabolism. 1990;70:100–106. doi: 10.1210/jcem-70-1-100. [DOI] [PubMed] [Google Scholar]
- Körner M, Waser B, Strobel O, Büchler M, Reubi JC. Neurotensin receptors in pancreatic ductal carcinomas. EJNMMI Research. 2015;5:17. doi: 10.1186/s13550-015-0094-2. [DOI] [PMC free article] [PubMed] [Google Scholar]
- Kruttika B, Fengfei W, Qingyong M, Qinyu L, Sanku M, Tze-chen H, Erxi W. Advances in Biomarker Research for Pancreatic Cancer Current. Pharmaceutical Design. 2012;18:2439–2451. doi: 10.2174/13816128112092439. [DOI] [PMC free article] [PubMed] [Google Scholar]
- Kulinska-Niedziela I, Paluszak J. Neurotensin–structure, origin and biological function Postępy Higieny i Medycyny Doświadczalnej. 1997;51:329–342. [PubMed] [Google Scholar]
- Kulkarni H, Schuchardt C, Wiessalla S, Smerling C, Reineke U, Osterkamp F, Baum R. Radiopeptide Therapy using Lu-177 3BP-227 in a Patient with Pancreatic Adenocarcinoma. Journal of Nuclear Medicine. 2015;56(suppl):1235–1235. doi: 10.2967/jnumed.117.193847. [DOI] [PubMed] [Google Scholar]
- Lamerz R. Role of tumour markers, cytogenetics. Annals of Oncology. 1999;10:S145–S149. [PubMed] [Google Scholar]
- Liu S, et al. The Efficient Synthesis and Biological Evaluation of Novel Bi-Functionalized Sarcophagine for 64Cu Radiopharmaceuticals. Theranostics. 2012;2:589–596. doi: 10.7150/thno.4295. [DOI] [PMC free article] [PubMed] [Google Scholar]
- Liu S, et al. Lewis Acid-Assisted Isotopic 18F-19F Exchange in BODIPY Dyes: Facile Generation of Positron Emission Tomography/Fluorescence Dual Modality Agents for Tumor Imaging. Theranostics. 2013;3:181–189. doi: 10.7150/thno.5984. [DOI] [PMC free article] [PubMed] [Google Scholar]
- Maschauer S, Einsiedel J, Hübner H, Gmeiner P, Prante O. 18F- and 68Ga-Labeled Neurotensin Peptides for PET Imaging of Neurotensin Receptor 1. Journal of Medicinal Chemistry. 2016;59:6480–6492. doi: 10.1021/acs.jmedchem.6b00675. [DOI] [PubMed] [Google Scholar]
- Mijatovic T, Gailly P, Mathieu V, De Nève N, Yeaton P, Kiss R, Decaestecker C. Neurotensin is a versatile modulator of in vitro human pancreatic ductal adenocarcinoma cell (PDAC) migration Cellular oncology : the official journal of the International. Society for Cellular Oncology. 2007;29:315–326. doi: 10.1155/2007/701789. [DOI] [PMC free article] [PubMed] [Google Scholar]
- Na Y et al. Potent antitumor effect of neurotensin receptor-targeted oncolytic adenovirus co-expressing decorin and Wnt antagonist in an orthotopic pancreatic tumor model. Journal of Controlled Release. 2015;220(Part B):766–782. doi: 10.1016/j.jconrel.2015.10.015. [DOI] [PubMed] [Google Scholar]
- Naghibalhossaini F, Yoder AD, Tobi M, Stanners CP. Evolution of a Tumorigenic Property Conferred by Glycophosphatidyl-Inositol Membrane Anchors of Carcinoembryonic Antigen Gene Family Members during the Primate Radiation Molecular Biology of the Cell. 2007;18:1366–1374. doi: 10.1091/mbc.E06-10-0884. [DOI] [PMC free article] [PubMed] [Google Scholar]
- Olszewski U, Hamilton G. Neurotensin signaling induces intracellular alkalinization and interleukin-8 expression in human pancreatic cancer cells. Molecular Oncology. 2009;3:204–213. doi: 10.1016/j.molonc.2009.01.006. [DOI] [PMC free article] [PubMed] [Google Scholar]
- Rahib L, Smith BD, Aizenberg R, Rosenzweig AB, Fleshman JM, Matrisian LM. Projecting Cancer Incidence and Deaths to 2030: The Unexpected Burden of Thyroid, Liver, and Pancreas Cancers. United States Cancer Research. 2014;74:2913–2921. doi: 10.1158/0008-5472.CAN-14-0155. [DOI] [PubMed] [Google Scholar]
- Raimondi S, Lowenfels AB, Morselli-Labate AM, Maisonneuve P, Pezzilli R. Pancreatic cancer in chronic pancreatitis; aetiology, incidence, and early detection. Best Practice & Research Clinical Gastroenterology. 2010;24:349–358. doi: 10.1016/j.bpg.2010.02.007. [DOI] [PubMed] [Google Scholar]
- Reubi JC, Waser B, Friess H, Büchler M, Laissue J. Neurotensin receptors: a new marker for human ductal pancreatic adenocarcinoma Gut. 1998;42:546–550. doi: 10.1136/gut.42.4.546. [DOI] [PMC free article] [PubMed] [Google Scholar]
- Reubi JC, Waser B, Schaer J-C, Laissue JA. Neurotensin receptors in human neoplasms: high incidence in Ewing’s sarcomas. INternational Journal of Cancer. 1999;82:213–218. doi: 10.1002/(sici)1097-0215(19990719)82:2<213::aid-ijc11>3.0.co;2-8. [DOI] [PubMed] [Google Scholar]
- Schlyer D. PET tracers and radiochemistry. ANNALS-ACADEMY OF MEDICINE SINGAPORE. 2004;33:146–154. [PubMed] [Google Scholar]
- Schulz J, et al. Comparative Evaluation of the Biodistribution Profiles of a Series of Nonpeptidic Neurotensin Receptor-1 Antagonists Reveals a Promising Candidate for Theranostic. Applications Journal of Nuclear Medicine. 2016;57:1120–1123. doi: 10.2967/jnumed.115.170530. [DOI] [PubMed] [Google Scholar]
- Sehgal I, Powers S, Huntley B, Powis G, Pittelkow M, Maihle NJ. Neurotensin is an autocrine trophic factor stimulated by androgen withdrawal in human prostate cancer. Proceedings of the National Academy of Sciences of the United States of America. 1994;91:4673–4677. doi: 10.1073/pnas.91.11.4673. [DOI] [PMC free article] [PubMed] [Google Scholar]
- Seibold U, et al. Bimodal Imaging Probes for Combined PET and OI: Recent Developments and Future Directions for Hybrid Agent. Development BioMed Research International. 2014;2014:13. doi: 10.1155/2014/153741. [DOI] [PMC free article] [PubMed] [Google Scholar]
- Siegel RL, Miller KD, Jemal A. Cancer statistics, 2015 CA. A Cancer Journal for Clinicians. 2015;65:5–29. doi: 10.3322/caac.21254. [DOI] [PubMed] [Google Scholar]
- Tsavaris N, et al. CEA and CA-19.9 Serum Tumor Markers as Prognostic Factors in Patients with Locally Advanced (Unresectable) or Metastatic Pancreatic Adenocarcinoma: A Retrospective Analysis Journal of Chemotherapy. 2009;21:673–680. doi: 10.1179/joc.2009.21.6.673. [DOI] [PubMed] [Google Scholar]
- Valerie NCK, Casarez EV, DaSilva JO, Dunlap-Brown ME, Parsons SJ, Amorino GP, Dziegielewski J. Inhibition of Neurotensin Receptor 1 Selectively Sensitizes Prostate. Cancer to Ionizing Radiation Cancer Research. 2011;71:6817. doi: 10.1158/0008-5472.CAN-11-1646. [DOI] [PubMed] [Google Scholar]
- Vincent A, Herman J, Schulick R, Hruban RH, Goggins M. Pancreatic cancer Lancet (London, England) 2011;378:607–620. doi: 10.1016/S0140-6736(10)62307-0. [DOI] [PMC free article] [PubMed] [Google Scholar]
- Wang L, et al. Neurotensin Receptor-1 mRNA Analysis in Normal Pancreas and Pancreatic Disease Neurotensin Receptor-1 mRNA. Analysis in Normal Pancreas and Pancreatic Disease Clinical Cancer Research. 2000a;6:566–571. [PubMed] [Google Scholar]
- Wang L, et al. Neurotensin Receptor-1 mRNA Analysis in Normal Pancreas and Pancreatic Disease. Clinical Cancer Research. 2000b;6:566. [PubMed] [Google Scholar]
- Wang Q, Zhou Y, Evers BM. Neurotensin Phosphorylates GSK-3α/β through the Activation of PKC. Human Colon Cancer Cells Neoplasia (New York, NY) 2006;8:781–787. doi: 10.1593/neo.06259. [DOI] [PMC free article] [PubMed] [Google Scholar]
- Wolfgang CL, Herman JM, Laheru DA, Klein AP, Erdek MA, Fishman EK, Hruban RH. Recent Progress in Pancreatic Cancer CA. A cancer journal for clinicians. 2013;63:318–348. doi: 10.3322/caac.21190. [DOI] [PMC free article] [PubMed] [Google Scholar]
- Wu Z, et al. Facile Preparation of a Thiol-Reactive 18F-Labeling Agent and Synthesis of 18F-DEG-VS-NT for PET Imaging of a Neurotensin Receptor-Positive Tumor Journal of nuclear medicine. Vol. 55. Official publication, Society of Nuclear Medicine; 2014. pp. 1178–1184. [DOI] [PubMed] [Google Scholar]
- Ying H, Dey P, Yao W, Kimmelman AC, Draetta GF, Maitra A, DePinho RA. Genetics and biology of pancreatic ductal adenocarcinoma. Genes & Development. 2016;30:355–385. doi: 10.1101/gad.275776.115. [DOI] [PMC free article] [PubMed] [Google Scholar]