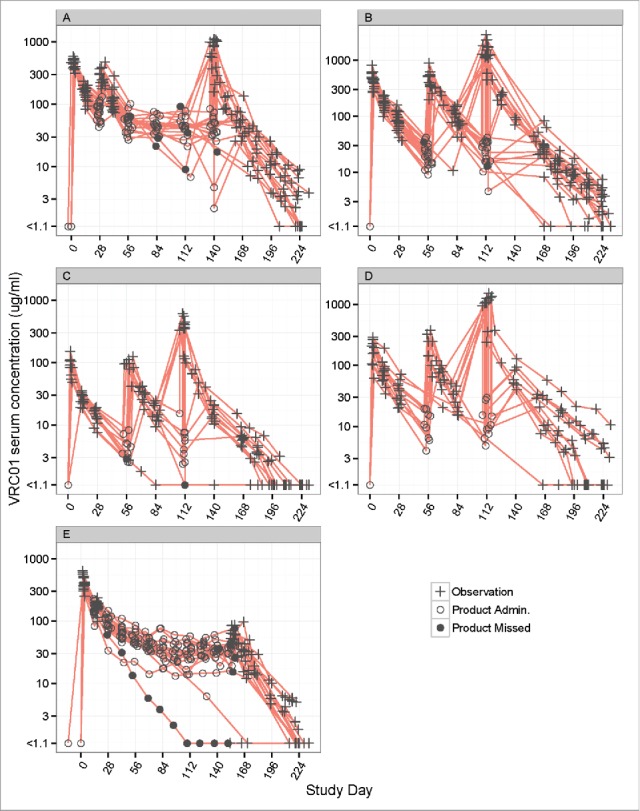
Figure 2.

Individual-level concentration (log-scale)-time panel plots for VRC01 recipients in Groups 1–5 (Panels A-E) of HVTN104. Panel A – E display data from Groups 1, 2, 4, 5, and 3, respectively. “+” indicates no product administrations, an open circle indicates product administration, and a filled circle indicates a missed product administration.
