

Abstract
Background
Every day, millions of people undergo surgical procedures facilitated by anesthesia. Yet, there is no clinically accepted measure to predict the effects of sedation or anesthesia on the CNS. Auditory brain activation may provide an objective and quantifiable method to measure of the effects of sedation on neuronal processing.
Methods
This is a randomized clinical trial. Forty-eight healthy volunteers were randomized to receive one of three sedative drugs [midazolam (n=11), propofol (n=12) or dexmedetomidine (n=12)] at a concentration adjusted to achieve mild sedation by self-rating, or to a no-drug control group (n=13). Participants underwent functional magnetic resonance imaging (fMRI) while listening to music in a 5-minute block design experiment. We tested the hypothesis that mild sedation changes the magnitude or extent of cortical activation of an auditory stimulus.
Results
We observed a significant reduction in auditory activation in both the dexmedetomidine (p=0.001) and midazolam (p=0.029) but not the propofol group (p=0.619) when compared to saline control.
Conclusions
Our findings indicate that, compared to saline control, there is a significant reduction of brain activation in the auditory cortex in response to midazolam and dexmedetomidine but not propofol when given at mildly sedative doses. This method serves as a novel approach to quantify effects of sedative agents in an objective fashion.
INTRODUCTION
Every day, millions of people undergo surgical procedures facilitated by anesthesia.1 Recognition that physicians need to take individual variability into account is driving huge interest in personalized or “precision” medicine.2 Yet, in the field of anesthesiology we have no accepted method or monitor to measure anesthetic susceptibility of a person in a quantitative fashion. Our work describes one possible method to start this process, the use of functional imaging of the auditory cortex to quantify the effects of anesthesia.
The effect of sedation and anesthesia on brain function using brain-mapping methods has been the topic of investigation for many years. The primary goal of this line of research in anesthesiology has been to support theories about the effects of sedative-hypnotic and analgesic drugs on the central nervous system (CNS). We previously examined the interaction of sedation and pain perception using both psychophysical methods3 and magnetic resonance imaging (MRI) based approaches.4 Our previous work using 15O-water positron emission tomography5 supports an emerging theory that propofol, when given at anesthetic doses, acts by inhibiting the thalamo-cortical signal transmission. This hypothesis was recently substantiated in a study using functional connectivity analysis6 for propofol. However, there is little or no information on the effects of other sedative hypnotic drugs on the functional MRI signal of any cortical region.
The thalamo-cortical axis is a key portion of central-nervous integration of the five senses; somatosensation, vision, hearing, smell and taste. Hence, a quantitative assessment of this effect is a logical target for study. Because BOLD fMRI has shown to be particularly reliable with respect to visual and auditory stimuli, we chose to study the effect of sedation on the auditory cortex. We studied the global effects of propofol before5 but the effects of this and other sedative hypnotic drugs on cortical processing is unclear. This issue is particularly relevant to studies in primates and small children that cannot be performed without sedation. We now present a novel approach to quantify the effects of several sedative hypnotic drugs, thus providing a possible solution to some of the challenges of measuring subtle effects of anesthetic drugs in an objective fashion.
In this prospective randomized study, the effects of three sedative drugs given at comparable doses and a no-drug (control) group were examine with respect to auditory brain activation. The primary objectives of this study were to determine if mild intravenous sedation changes the magnitude or extent of auditory cortex activation (mean signal amplitude in the auditory cortex) and whether any observed effects would differ by drug type. We compared our drug intervention to a no-drug (control) group, although it is generally assumed that neither task repetition nor mild sedation affects blood oxygen dependent level (BOLD) functional MRI (fMRI). An exploratory study aim was to determine whether there is a gender or race effect with respect of auditory brain activation and thus may provide clues about the effects of person characteristics on auditory processing or drug effects.
METHODS
Subjects and Design
The Institutional Review Board of the University of Alabama at Birmingham (Birmingham, AL, United States) approved this study. Between November 2010 and March 2015, subjects were recruited by use of public advertisements placed around the University campus. Interested individuals underwent a screening visit during which we determined eligibility by obtaining a medical history, performed a focused physical examination, and obtained written informed consent. Inclusion criteria were healthy adults between 19 to 40 years of age, who were able to understand all study instructions. Exclusion criteria were any existing and active medical conditions that could affect somatosensation or cognitive function such as diabetes mellitus, neurologic diseases, chronic pain, psychiatric disorders, treatment with any controlled substance, or a past history of drug or substance abuse. The data for this report are a subset of an ongoing study with a focus on somatosensory processing where auditory processing was used as a control task.
Subjects were randomized to one of three sedative treatments (midazolam, propofol, dexmedetomidine) on the day prior to the study. Randomization of subjects receiving sedation was determined by a list created with the PLAN procedure in SAS, version 9.4 software (SAS Institute, Cary, NC, United States) and was balanced to blocks of 5 participants. One participant was excluded on the day of the study due to the presence of a previously undisclosed drug in the medical history. No intravenous access was established in the no-drug (control) group.
As part of the first study session, an individual’s dose for moderate sedation was determined, as described below. The auditory fMRI was performed on a separate day during which the previously established sedative dose was used.
Administration of Intravenous Sedation
A 20-Ga intravenous catheter was placed on the left forearm. Drugs were infused with a Graseby 3400 infusion pump (Smiths Medical, St. Paul, MN, United States) controlled by a personal computer using the Stanpump software (available at www.opentci.org.*) This software uses a three-compartment pharmacokinetic model adjusted by height, weight, age, and gender to predict plasma concentrations of intravenous drugs. This computer-assisted infusion was approved by the United States Food and Drug Administration (IDE # G060183) for research use. Pharmacokinetics for propofol were published by Marsh et al.,7 and pharmacokinetic parameters for the administration of dexmedetomidine and midazolam were published by Dyck et al.8 and Greenblatt et al.,9 respectively. Unlike traditional drug infusions, with this method the infusion rate varies constantly to rapidly attain and maintain a desired drug plasma concentration. The method has great utility in a situation where the investigator needs to rapidly achieve a drug plasma concentration, as in this study.
Dose Finding Procedure
On a separate day of the MRI study visit, the dose of medication for mild sedation was determined. The goal of this procedure was to establish a comparable level of sedation for all participants receiving intravenous sedation regardless of drug assignment. The dose required to achieve moderate sedation was based on the person’s individual sedation rating, a sedation biomarker that has been shown to correlate well with intravenous drug concentrations and observer assessment of sedation.10,11 Subjects received escalating doses of their assigned intravenous sedative. They were asked to rate their own sedation after having received ten minutes of intravenous sedation at each level by making a mark on a 10 cm horizontal line bounded by “fully awake” to “completely sedated” (sedation self-assessment scale). Doses were increased in predefined steps (see below) every 10 minutes until participants were considered moderately sedated by making their sedation mark at the midsection of the sedation self assessment line (at 5 cm on a 10 cm sedation self-assessment scale) or within the right half of the sedation line (between 5 cm and 10 cm of the sedation self-assessment scale). Drug dose steps were based on previous published data7–9,11 for “effect site” concentrations. For dexmedetomidine we used effect site concentrations of 0.1, 0.2, 0.4, 0.6 and 0.8 ng/mL, for midazolam we used effect site concentrations of 10, 20, 40, 60 and 80 ng/mL and for propofol we used effect site concentrations of 0.4, 0.8,1.2 and 1.6 μg/mL. Because the dose finding was incremental (in fixed steps) the number of steps, time of the dose finding procedure and cumulative drug dose to achieve moderate sedation varied. We recorded both the effect site concentration at which moderate sedate was obtained and the cumulative drug dose in mg used for any given participant.
The effect site concentration for a particular participant was recorded and used for the MRI session during which sedation was initiated after the baseline MRI and continued for 20 minutes before the repeated MRI session was performed.
Subject Monitoring
All subjects were monitored according to the standards of the American Society of Anesthesiologists using pulse oximetry, electrocardiogram, and noninvasive blood pressure in addition to inspection of subject’s breathing and circulation.
Statistical Analysis
Statistical analysis was performed using the Statistical Analysis System (SAS, Cary, NC, United States), version 9.4. We focused our analysis on changes of the auditory cortex, which have been shown to be particularly sensitive to the processing of music.12 The statistical analysis of cluster size was done on temporally realigned but otherwise untransformed (no other preprocessing steps) images. The analysis on signal magnitude within the auditory cortex (superior temporal gyrus) was done on realigned and spatially normalized images to match the coordinate space of the auditory cortex mask.
We examined differences of treatment groups with an analysis of variance (ANOVA) on difference scores (sedation minus baseline values) for both signal magnitude within the ROI and cluster size resulting in two independent ANOVA models. We inspected the histogram of residual errors of the two ANOVA models for gross deviation from normality. Post hoc analyses of pairwise group differences were done with Dunnett’s test. As a point of reference, we compared the distribution of the difference scores in the saline control group to a hypothesized mean of zero using a signed rank test.
We performed two independent multivariable analyses to investigate our exploratory study aim of investigating race and gender effects. These analyses were done with a mixed model where drug, time (baseline versus sedation | repeated), race gender as fixed effects and subject as random effects and either mean signal amplitude or cluster size as outcomes in separate models. In these analyses, we considered race and gender predictors of interest and drug and time control variables. This approach allowed us to quantify the overall temporal change in mean auditory activation or cluster size and to evaluate the effect of predictors such as race and gender while controlling for other explanatory variables in the model. We did not include interaction effects of race and gender or race and drug because the number of subjects in the subcategories defined by these interactions would have been too small to produce stable prediction parameters.
Sample Size Calculation
Our power analysis was performed using G*power.13. P values < 0.05 were considered statistically significant. The primary outcome for this study was the change in the size of the auditory activation cluster. Activation of the primary and secondary auditory cortex would consist of approximately 1,500±750 voxels at a 2 mm isometric voxel size. The sample size to detect a 33% reduction in the activation cluster using a within subject correlation of 0.7 to obtain 80% power was n=10 per group. Since exact comparative data on the expected temporal change of auditory activation do not exist, we based our assumptions about the expected magnitude of CNS effects due to sedation were based on our previous experiments on saccadic eye movements.14
Imaging Design and Analysis
a. Acquisition and Data Format
MRI Images were acquired on a Siemens Allegra 3T brain scanner using the Siemens imaging software version syngo MR 4VA25A. We recorded functional and one structural (anatomical) image. We note that structural images were not required for the target frequency analysis (TFA) but obtained as reference. Functional runs consisted of a series of 150 echo planar images using the following scanning parameters: a repetition time of 2000 ms, an echo time of 30 ms and a flip angle of 70 deg. We obtained 30 slices of 4 mm thickness with 4 mm by 4 mm pixel spacing. The acquisition matrix was 64 by 64 elements resulting in a 254 mm by 254 mm field-of-view. Two images (equilibration scans) preceded the run of 150 images; they were generated as but not recorded. The structural image was a T1-weighted magnetization-prepared rapid acquisition gradient echo (MP RAGE) sequence using a 12 degree flip angle. We obtained 160 slices of 1 mm thickness with 1 mm by 1 mm pixel spacing. The acquisition matrix was 256 by 256 elements resulting in a 256 mm by 256 mm field-of-view.
b. Preprocessing
Images were recorded ion Siemens Digital Imaging and Communications in Medicine (DICOM) format. DICOM images were then imported into Matlab as Neuroimaging Informatics Technology Initiative (NifTI) format with a 4D dimension (64 × 64 × 30 × 150) for functional runs and a 3D dimension (256 × 256 × 160) for structural images using Statistical Parametric Mapping in Matlab (Mathworks, Natick, MA version 2014a) using Statistical Parametric Mapping 12 (version 6685). Using SPM 12, auditory runs were then realigned using 4th degree B-Spline interpolation. No slice timing correction was performed. Realigned functional runs were used to perform the TFA (see below). Further preprocessing of realigned images was only performed for the purpose of illustrating group activation maps (figure 2) and conducted as follows: manual normalization of each individual’s TFA image to match the ‘single subject T1’ template provided with SPM using the ‘Display’ and ‘Check Registration’ options in SPM using a manual 9-degree-of-freedom linear affine transformation. Individuals steps of this process were: resetting the brain’s origin to the anterior commissure (translations along x, y, and z), three axis rotations (pitch, roll and yaw) and scaling along x, y, and z.
Figure 2.
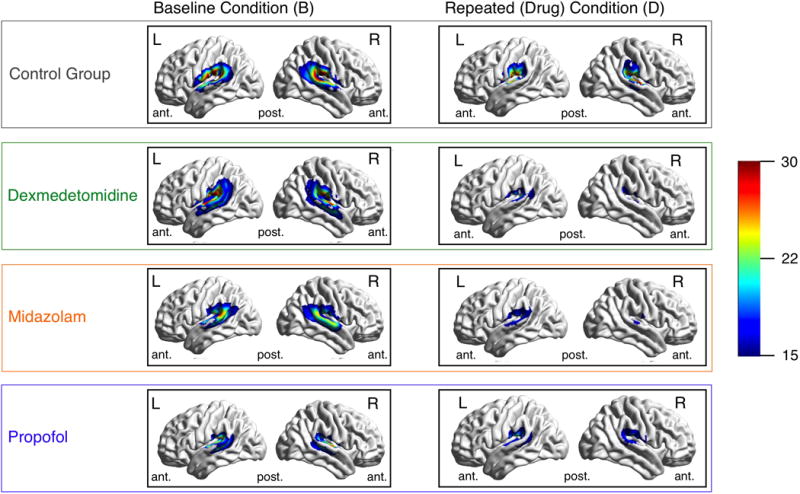
Legend. Illustration of cortical overlay of brain activation:
Images show cortical renderings of auditory activation clusters. Activation maps are the average of individual activation maps. There are three section (A, B, and C): Section A lists the results of paired t-tests comparing activation cluster size at baseline to repeated acquisition (after receiving sedation or saline). Section B shows cortical renderings of average group activation after spatial normalization. Section C shows histograms of cluster size changes by group. Group averages of left (L) and right (R) lateral brain cortex at baseline and during sedation or repetition (in the no-drug control group). Histograms to the right describe activated voxels for each group, again comparing baseline to drug condition. The significance of a paired t-test for these counts is provided alongside the left side of the figure. ant. … anterior, post. …posterior. The color bar represents the amplitude (a) of the target frequency (TF).
c. Target Frequency Analysis
Details of the theoretical framework of this analysis are provided in Frölich et al (2015).15 The analysis involves the following steps: Loading the 4D NifTI images into a 4-dimentional matrix (dimensions: 64 × 64 × 30 × 150), normalizing the time series by subtracting the mean and dividing by the standard deviation along the time dimension for each brain voxel using matrix commands. Extracting the target frequency component from the BOLD fMRI intensity time-series using the Goertzel algorithm - a single commend step in Matlab - and calculating the frequency amplitude (absolute value) of each brain voxel. Threshold the TFA image to a value of 23.22, the 95th percentile of a Nakagami (1,150) distribution after spatial normalization (see above) to generate activation maps. We measured both the mean auditory TFA amplitude and the size (number of voxels) of the auditory cluster. For this analysis we normalized individual activation maps as described in section d. (below) and selected the superior temporal gyrus bilaterally as region of interest (ROI) using the MARINA (MAsks for Region of INterest Analysis, Version 0.6.1) system.16 We used the average amplitude of all voxels included in the ROI as outcome measure for this analysis.
d. Cortical Rendering (figure 2)
We illustrate our findings in figure 2. To create this figure several transformations were needed. Individual TFA amplitude images were spatially normalized (see section b, above) and thresholded (see section c above). Normalized images were then smoothed using a 8 by 8 by 8 Gaussian smoothing kernel. A drug group average of spatially normalized TFA amplitude images was created using the ‘imcalc’ command of SPM. Cortical rendering to a smoothed normalized surface was done with BrainNet Viewer.17
Auditory Stimulation
The auditory stimulation consisted of 8 seconds royalty free music clips representing a variety of music genres that were stored as motion picture expert group (MPEG) type 4 files and played through an fMRI compatible headset to study subjects during their functional scan. This design and the associated analysis outlined below is illustrated in Figure 1.
Figure 1.
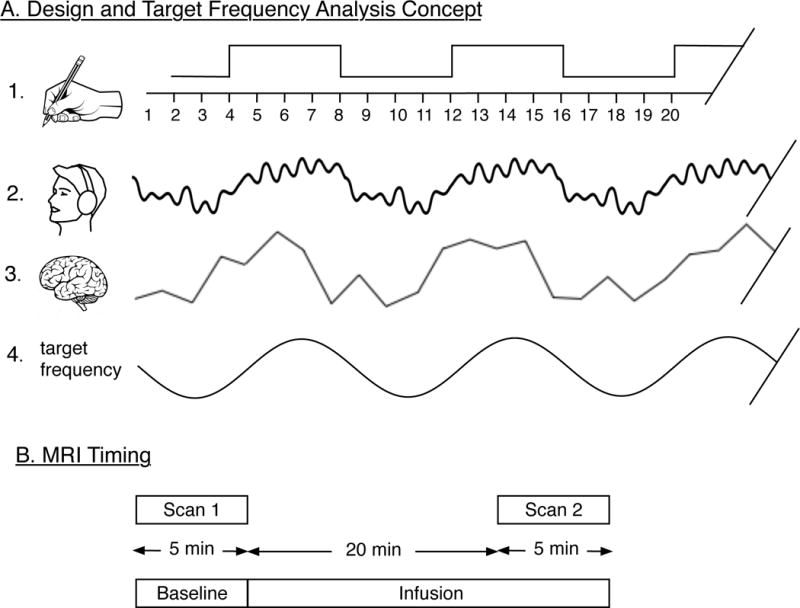
Legend. Illustration of design and target frequency analysis concept:
Section A illustrates the steps in the design and analysis; A.1. shows the balanced block design where four 2-second MRI images without music are alternated with four 2-second MRI images with music playing. A.2 illustrates the auditory signal perceived by the subject. A.3. illustrates the discrete time-series of BOLD signal intensities recorded. A.4 illustrates the sine target frequency that matches the design (A.1), is extracted from the BOLD signal and analyzed in terms of its amplitude. Section B illustrates the timing of the MRI sequence in relationship to the computer assisted infusion of sedative drugs.
RESULTS
Descriptive Statistics and Demographics
There were n=12 participants in the propofol, n=12 in the dexmedetomidine, n=11 patients in the midazolam group and n=13 patients in the no-drug (control) group. Race, age, BMI or gender distributions did not appear different across drug groups. Final effect site concentrations and cumulative drug doses are summarized in Table 2.
Table 2.
Descriptive Statistics (Dose, Age, BMI)
| Cumulative Drug Dose | Final Effect Site Concentration | Age | BMI | |
|---|---|---|---|---|
|
|
||||
| Dexmedetomidine | 0.5 (0.2) mg | 26.2 (8.2) ng/ml | 24.8 (6.3) yrs | 25.1 (4.8) kg/m2 |
| Midazolam | 4.4 (2.2) mg | 87.9 (43.9) ng/ml | 23.9 (4.4) yrs | 27.7 (5.6) kg/m2 |
| Propofol | 186 (77.5) mg | 93.0 (38.8) mcg/ml | 28.4 (5.4) yrs | 26.1 (3.5) kg/m2 |
| Control | NA | NA | 26.5 (5.1) yrs | 22.8 (2.7) kg/m2 |
Data presented as means and standard deviation, provided in parenthesis. Cumulative Drug Dose refers to the sedative dose administered to a participant over the course of the study. Final Effect Site Concentration refers to the effect site concentration of sedation drug at the end of the fMRI scan under sedation. BMI … body mass index. yrs … years.
Auditory Activation Change
The residual errors of both ANOVA models (difference in cluster size and difference in mean activation within the auditory cortex) appeared approximately normally distributed. We observed a significant difference in drug groups with respect to change in mean auditory activation (Fdf=3,44=6.059, p=0.002) (see figure 3.A.). Changes in mean auditory activation, comparing active drugs to saline control, are listed in table 3. We note that in the post-hoc analysis both dexmedetomidine and midazolam but not propofol differed significantly from saline control. As a point of reference, auditory activation did not change significantly in the saline control group (p=0.636). We did not observe a significant treatment group differences with respect to change in auditory cluster size (Fdf=3,44=0.400, p=0.753) (see figure 3.B). Changes in cluster size, comparing active drugs to saline control, are listed in table 4.
Figure 3.

Illustration of changes in brain activity: Boxplots A and B show the change (compared to baseline values) of the 2 main study outcomes. A, Changes of the auditory activation cluster (bilaterally). B, Changes of the average target frequency amplitude within the auditory cluster.
Table 3.
Spatial Extent of the Auditory Activation
| Overall difference (ANOVA) | |||||
| F-ratio | Prob | ||||
| 0.040 | 0.753 | ||||
| Means Comparison (Dunnett’s test) | |||||
| Control | Drug | Difference | Lower CL | Upper CL | p-Value |
|
| |||||
| Saline | Dexmedetomidine | 272 | −674 | 1219 | 0.893 |
| Saline | Midazolam | 246 | −723 | 1215 | 0.922 |
| Saline | Propofol | 94 | −853 | 1040 | 0.995 |
|
| |||||
Drug comparison of change in cluster size (spatial extent of auditory activation) within the auditory cortex. The difference column is calculated by subtracting the cluster size change (sedation minus baseline) of each drug (dexmedetomidine, midazolam, propofol) from the cluster size change (repeat minus baseline) in the saline control group.
Table 4.
Mean Signal Magnitude (Amplitude) in the Auditory Cortex
| Overall difference (ANOVA) | |||||
| F-ratio | Prob | ||||
| 6.059 | 0.002 | ||||
| Means Comparison (Dunnett’s test) | |||||
| Level | Level | Difference | Lower CL | Upper CL | p-Value |
|
| |||||
| Control | Dex | 9 | 4 | 13 | 0.001 |
| Control | Mida | 69 | 2 | 11 | 0.029 |
| Control | Propofol | 29 | −29 | 7 | 0.619 |
|
| |||||
Drug comparison of change in mean signal amplitude within the auditory cortex. The difference column is calculated by subtracting the signal change (sedation minus baseline) of each drug (dexmedetomidine, midazolam, propofol) from the signal change (repeat minus baseline) in the saline control group.
The mixed model with cluster size as outcome showed a significant time effect (p<0.001) indicating that, after adjusting for other independent variables in the model, cluster size decreased significantly. Race was also a significant predictor in this model (p=0.041). This effect can be appreciated better by reporting the least square means (LSM) and standard errors (SE, in parentheses) for cluster size, which are as follows: in African Americans the LSM was 1237 (197) voxels, in the “Other” category the LSM was 1020 (347) voxels and in the Caucasian race category the LSM was 1745 (128) voxels. In this model with cluster size as outcome, neither drug (p=0.395) or gender (p=0.596) were significant predictors. The lack of the drug effect is consistent with the findings of the ANOVA model (above). In the mixed model with mean auditory signal amplitude as outcome only time was a significant predictor (p<0.001) after controlling for other predictors in the model. Neither Race, drug or gender were significant predictors in the latter model.
DISCUSSION
This study utilized a novel approach to quantify the effects of mild sedation in order to address two important scientific questions: whether there is a drug effect of mild sedation on auditory brain activation and whether any observed effect is specific to a particular drug. As supplemental analysis we evaluate whether there are any race, gender effects in auditory processing while controlling for drug.
The use of the extent of cortical neuronal activity and the signal magnitude as a quantitative measure of sedative susceptibility is an innovative approach to evaluating the effects of mild sedation. These effects are too subtle to be observed in a reproducible and quantifiable fashion by current objective evaluation measures. The quantitative analysis we describe is based on the straight forward target frequency analysis (TFA) approach which determines the agreement of the observed periodic signal from a block-design fMRI experiment with an a priori defined periodic stimulus. This approach is very useful because unlike the most commonly applied general linear model analysis approach, the method does not require exact knowledge about the dynamics of the perceived stimulus. In other words, it does not matter whether the stimulus perception increases, decreases, or is delayed over the stimulation block. Similarly, it does not matter whether these responses vary across brain areas as long as the response remains of periodic nature. Because existing methods, mostly based on processed EEG data, have proven unsatisfactory as objective biomarkers for the effects of mild sedation, we utilized the change in auditory fMRI activation, a well validated outcome in the imaging community, in the new context of quantifying the effects of sedation. In the following discussion, we will review the existing MRI and EEG literature on the effect of sedative anesthetic drugs on functional imaging measures, followed by an interpretation of our specific findings.
A drug specific effect would support that the different pharmacology of sedative drugs, GABA-acting versus alpha-2-receptor-acting, translates into a characteristic action at a functional level as opposed to adopting the hypothesis that sedative hypnotic drugs invoke a uniform response at a functional level. Although the effect of general anesthesia with propofol on brain activation has been studied before5,18, this study is the first to test the effects of three different intravenous sedative drugs on the cortical response to an auditory stimulus when administered in the anxiolytic, mildly sedative range. We observed an overall reduction in the magnitude and extent of the auditory activation at doses titrated to achieve the same biological effect, which was determined by the subject’s sedation self-report.
Although there was no evidence to suggest that the magnitude of auditory activation decreased we observed a reduction in the size of the activation cluster I the saline group similar to the change seen in the sedation groups. This effect may reflect some level of habituation to the repeated administration of a stimulus. Another noteworthy detail is that, compared to saline control, the magnitude of auditory activation decreased significantly in both midazolam and dexmedetomidine but not in the propofol group, suggesting that perhaps propofol has a lesser effect on auditory CNS processing compared to midazolam or dexmedetomidine. Our finding of a similar reduction of cluster size in the saline group compared to the sedation groups suggests that the extent of cortical activation of auditory fMRI is very sensitive to repeated test administration and overall reduced when participants receive an intravenous sedation even at a very small (anxiolytic) dose. Our observation that auditory fMRI results change with repeated task administration independently confirms existing electrophysiological work19 and has important implications for neuroimaging experiments in general. MRI acquisition sequences are presented in sequence to accommodate various image modalities and may occasionally be quite lengthy, e.g. 20 min, by themselves. At times, subjects need to be sedated to reduce anxiety or simply to tolerate the fMRI procedure as in the case of studying children20 or when studying animals.21
Experimenters usually assume that small doses of sedation do not affect functional imaging results and that imaging results are not affected by task repetition. Our study finding of a cluster size reduction in the saline group should serve as caution for investigators employing long and repeated imaging sequence while assuming no habituation effect.
The most promising finding of our study is that we were able to document reproducible effects of sedation at very low dose which thus has not been possible with other techniques such as auditory evoked potentials (AEP). The concept of AEP has been used to assess anesthetic depth.22,23 Auditory latency has been described as an effective index for the effects of general anesthetics24–26 although these anesthetic effects are only notable at doses used to maintain full anesthesia27 or higher sedation doses.28 One of the key differences in AEP and auditory fMRI is that AEP monitor brain stem responses. In humans, sound information from the inner ear travels down the vestibulocochlear nerve, through intermediate stations such as the cochlear nuclei and superior olivary complex of the brainstem and the inferior colliculus of the midbrain, being further processed at each relay station. The information eventually reaches the thalamus, and from there it is relayed to the cortex.29–31 Evoked potentials are thought to reflect activity in these brainstem structures. In contrast, auditory fMRI measures the extent to which the auditory cortex is activated by a sound stimulus. In the human brain, the primary auditory cortex is located in the temporal lobe. It subdivided into a primary (AI), secondary (AII) and further association areas.32 As such, the neuroanatomical targets of AEP and auditory fMRI as implemented in our study differ and this difference may account for the difference in sensitivity of the technique to sedative-anesthetic effects whereby AEP are only affected by sedative doses that are higher than the ones used in our study.
A secondary finding was that Non-Hispanic White study subjects showed a significantly larger area of auditory brain activation when compared to the African-American and other race categories, after controlling for gender and treatment. Although this observation needs to be interpreted with caution because of the small sample size, person-specific anesthetic susceptibility has been observed in a different context.33 The challenge in quantifying anesthetic effects has been that to-date, there is no reliable biomarker that is considered a reliable test to evaluate person-specific responses to anesthetic medications in an objective fashion. Sedation self-rating as used in our study has been shown to perform well when compared to other methods34 but is a subjective assessment. There are other validated methods of quantifying anesthetic susceptibility such as the evaluation of the speed of saccadic eye movements14 or neurocognitive evaluation tools.35 These types of evaluations may be important for individuals considered at risk for suffering untoward effects from exposure to sedation and anesthesia,36 they are impractical for clinical use based on the time required to complete them. In this regard, a 5-minute auditory fMRI study as used in our study may provide a more practical and an objective measure of the sensitivity to sedative-hypnotic drugs.
In summary, the extent of auditory activation in response to music is reduced with repeated stimulus presentation. Compared to saline control, we observed a significant auditory signal amplitude reduction in persons being sedated with midazolam, and dexmedetomidine. Our findings have utility to describe, in an objective fashion, subtle sedation effects and reveal differences in a person’s susceptibility to neuroactive medication.
Table 1.
Descriptive Statistics (Race, Gender)
| Race | Gender | ||||
|---|---|---|---|---|---|
| AA | O | C | female | male | |
|
|
|||||
| Dexmedetomidine | 2 | 1 | 9 | 5 | 7 |
| Midazolam | 3 | 1 | 7 | 9 | 2 |
| Propofol | 4 | 1 | 7 | 6 | 6 |
| Control | 6 | 1 | 6 | 11 | 2 |
Comparison of Race and Gender across drug groups. AA … African-American, O … Other (Hispanic, Asian, Pacific Islander), C … Caucasian or Non-Hispanic White.
Acknowledgments
Funding: NIH K23RR021874 and NIH 5UL1 RR025777
Footnotes
Shafer R: Stanpump, http://www.opentci.org, 1998, last acessed: Feb 3, 2014.
Did a Section Editor solicit this submission? No
IRB: V. Leslie Cooper, Interim Director, Institutional Review Board, (205) 934-3789, lcooper@uab.edu.
Contributor Information
Michael A. Frölich, Department of Anesthesiology, University of Alabama at Birmingham (UAB).
Catiffaney Banks, Emory Healthcare.
Timothy J Ness, Anesthesiology, UAB
References
- 1.Hall MJ, DeFrances CJ, Williams SN, Golosinskiy A, Schwartzman A. National hospital discharge survey: 2007 summary. Natl Health Stat Report. 2010;29:1–20. [PubMed] [Google Scholar]
- 2.Collins FS, Varmus H. A new initiative on precision medicine. New England Journal of Medicine. 2015;372:793–795. doi: 10.1056/NEJMp1500523. [DOI] [PMC free article] [PubMed] [Google Scholar]
- 3.Frölich MA, Zhang K, Ness T. Effect of sedation on pain perception. Anesthesiology. 2013;118:611–21. doi: 10.1097/ALN.0b013e318281592d. [DOI] [PMC free article] [PubMed] [Google Scholar]
- 4.Frölich MA, Deshpande H, Ness TJ, Deutsch G. Quantitative Changes in Regional Cerebral Blood Flow Induced by Cold, Heat and Ischemic Pain. Anesthesiology. 2012;117:857–67. doi: 10.1097/ALN.0b013e31826a8a13. [DOI] [PMC free article] [PubMed] [Google Scholar]
- 5.Byas-Smith M, Frolich MA, Votaw JR, Faber TL, Hoffman JM. Cerebral blood flow during propofol induced sedation. Mol Imaging Biol. 2002;4:139–46. doi: 10.1016/s1536-1632(01)00006-3. [DOI] [PubMed] [Google Scholar]
- 6.Liu X, Lauer KK, Ward BD, Li SJ, Hudetz AG. Differential effects of deep sedation with propofol on the specific and nonspecific thalamocortical systems: a functional magnetic resonance imaging study. Anesthesiology. 2013;118:59–69. doi: 10.1097/ALN.0b013e318277a801. [DOI] [PMC free article] [PubMed] [Google Scholar]
- 7.Marsh B, White M, Morton N, Kenny GN. Pharmacokinetic model driven infusion of propofol in children. Br J Anaesth. 1991;67:41–8. doi: 10.1093/bja/67.1.41. [DOI] [PubMed] [Google Scholar]
- 8.Dyck JB, Maze M, Haack C, Azarnoff DL, Vuorilehto L, Shafer SL. Computer-controlled infusion of intravenous dexmedetomidine hydrochloride in adult human volunteers. Anesthesiology. 1993;78:821–8. doi: 10.1097/00000542-199305000-00003. [DOI] [PubMed] [Google Scholar]
- 9.Greenblatt DJ, Abernethy DR, Locniskar A, Harmatz JS, Limjuco RA, Shader RI. Effect of age, gender, and obesity on midazolam kinetics. Anesthesiology. 1984;61:27–35. [PubMed] [Google Scholar]
- 10.Chernik DA, Gillings D, Laine H, Hendler J, Silver JM, Davidson AB, Schwam EM, Siegel JL. Validity and reliability of the Observer’s Assessment of Alertness/Sedation Scale: study with intravenous midazolam. J Clin Psychopharmacol. 1990;10:244–51. [PubMed] [Google Scholar]
- 11.Frolich MA, Arabshahi A, Katholi C, Prasain J, Barnes S. Hemodynamic characteristics of midazolam, propofol, and dexmedetomidine in healthy volunteers. J Clin Anesth. 2011;23:218–23. doi: 10.1016/j.jclinane.2010.09.006. [DOI] [PMC free article] [PubMed] [Google Scholar]
- 12.Hwang J-H, Wu C-W, Chou P-H, Liu T-C, Chen J-H. Hemispheric difference in activation patterns of human auditory-associated cortex: an FMRI study. ORL. 2005;67:242–246. doi: 10.1159/000089501. [DOI] [PubMed] [Google Scholar]
- 13.Faul F, Erdfelder E, Lang AG, Buchner A. G*Power 3: a flexible statistical power analysis program for the social, behavioral, and biomedical sciences. Behav Res Methods. 2007;39:175–91. doi: 10.3758/bf03193146. [DOI] [PubMed] [Google Scholar]
- 14.Busettini C, Frölich M. Effects of mild to moderate sedation on saccadic eye movements. Behavioural brain research. 2014;272:286–302. doi: 10.1016/j.bbr.2014.07.012. [DOI] [PMC free article] [PubMed] [Google Scholar]
- 15.Frolich MA, Jung P, Starr S. Target Frequency Analysis of Functional MRI Data. Int J Clin Biostat Biom. 2015;1:1–7. [Google Scholar]
- 16.Walter B, Blecker C, Kirsch P, Sammer G, Schienle A, Stark R, Vaitl D. MARINA: An easy to use tool for the creation of MAsks for Region of INterest Analyses; 9th International Conference on Functional Mapping of the Human Brain; 2003. [Google Scholar]
- 17.Xia M, Wang J, He Y. BrainNet Viewer: a network visualization tool for human brain connectomics. PLoS One. 2013;8:e68910. doi: 10.1371/journal.pone.0068910. [DOI] [PMC free article] [PubMed] [Google Scholar]
- 18.Plourde G, Belin P, Chartrand D, Fiset P, Backman SB, Xie G, Zatorre RJ. Cortical processing of complex auditory stimuli during alterations of consciousness with the general anesthetic propofol. Anesthesiology. 2006;104:448–57. doi: 10.1097/00000542-200603000-00011. [DOI] [PubMed] [Google Scholar]
- 19.Rosburg T, Sörös P. The response decrease of auditory evoked potentials by repeated stimulation–Is there evidence for an interplay between habituation and sensitization? Clinical Neurophysiology. 2016;127:397–408. doi: 10.1016/j.clinph.2015.04.071. [DOI] [PubMed] [Google Scholar]
- 20.Fransson P, Åden U, Blennow M, Lagercrantz H. The functional architecture of the infant brain as revealed by resting-state fMRI. Cerebral Cortex. 2011;21:145–154. doi: 10.1093/cercor/bhq071. [DOI] [PubMed] [Google Scholar]
- 21.Borsook D, Becerra L. CNS animal fMRI in pain and analgesia. Neuroscience & Biobehavioral Reviews. 2011;35:1125–1143. doi: 10.1016/j.neubiorev.2010.11.005. [DOI] [PMC free article] [PubMed] [Google Scholar]
- 22.Cheung YM, Scoones GP, Stolker RJ, Weber F. Evaluation of the auditory evoked potentials derived aepEX™ as a measure of hypnotic depth in pediatric patients receiving sevoflurane–remifentanil anesthesia. Pediatric Anesthesia. 2014;24:760–765. doi: 10.1111/pan.12434. [DOI] [PubMed] [Google Scholar]
- 23.Matsushita S, Oda S, Otaki K, Nakane M, Kawamae K. Change in auditory evoked potential index and bispectral index during induction of anesthesia with anesthetic drugs. Journal of clinical monitoring and computing. 2014:1–6. doi: 10.1007/s10877-014-9643-x. [DOI] [PMC free article] [PubMed] [Google Scholar]
- 24.Dong X, Suo P, Yuan X, Yao X. Use of Auditory Evoked Potentials for Intra-Operative Awareness in Anesthesia: A Consciousness-Based Conceptual Model. Cell biochemistry and biophysics. 2015;71:441–447. doi: 10.1007/s12013-014-0221-0. [DOI] [PubMed] [Google Scholar]
- 25.Bielefeld EC. Influence of dose and duration of isoflurane anesthesia on the auditory brainstem response in the rat. International journal of audiology. 2014;53:250–258. doi: 10.3109/14992027.2013.858280. [DOI] [PubMed] [Google Scholar]
- 26.Huang B, Liang F, Zhong L, Lin M, Yang J, Yan L, Xiao J, Xiao Z. Latency of auditory evoked potential monitoring the effects of general anesthetics on nerve fibers and synapses. Scientific reports. 2015:5. doi: 10.1038/srep12730. [DOI] [PMC free article] [PubMed] [Google Scholar]
- 27.Norton J. Brainstem Auditory Evoked Potentials, Principles of Neurophysiological Assessment, Mapping, and Monitoring. Springer; 2014. pp. 137–144. [Google Scholar]
- 28.Hsu C-W, Sun S-F, Chu K-A, Lee DL, Wong K-F. Monitoring sedation for bronchoscopy in mechanically ventilated patients by using the Ramsay sedation scale versus auditory-evoked potentials. BMC pulmonary medicine. 2014;14:15. doi: 10.1186/1471-2466-14-15. [DOI] [PMC free article] [PubMed] [Google Scholar]
- 29.Bellis TJ. Assessment and Management of Central Auditory Processing Disorders in the Educational Setting: From Science to Practice. Thomson/Delmar Learning. :2003. [Google Scholar]
- 30.Lee MC, Tracey I. Imaging pain: a potent means for investigating pain mechanisms in patients. Br J Anaesth. 2013;111:64–72. doi: 10.1093/bja/aet174. [DOI] [PMC free article] [PubMed] [Google Scholar]
- 31.Burger RM, Forsythe ID, Kopp-Scheinpflug C. Editorial: Inhibitory function in auditory processing. Frontiers in Neural Circuits. 2015;9:45. doi: 10.3389/fncir.2015.00045. [DOI] [PMC free article] [PubMed] [Google Scholar]
- 32.Pickles CF, James O. An Introduction to the Physiology of Hearing. 4th. UK: Emerald Group Publishing Limited; 2012. [Google Scholar]
- 33.Sessler DI. Red hair and anesthetic requirement. Canadian Journal of Anesthesia/Journal canadien d’anesthésie. 2015;62:333–337. doi: 10.1007/s12630-015-0325-z. [DOI] [PubMed] [Google Scholar]
- 34.De Visser S, Van Der Post J, De Waal P, Cornet F, Cohen A, Van Gerven J. Biomarkers for the effects of benzodiazepines in healthy volunteers. British journal of clinical pharmacology. 2003;55:39–50. doi: 10.1046/j.1365-2125.2002.t01-10-01714.x. [DOI] [PMC free article] [PubMed] [Google Scholar]
- 35.Li B, Wang H, Wu H, Gao C. Neurocognitive Dysfunction Risk Alleviation With the Use of Dexmedetomidine in Perioperative Conditions or as ICU Sedation: A Meta-Analysis. Medicine. 2015;94:e597. doi: 10.1097/MD.0000000000000597. [DOI] [PMC free article] [PubMed] [Google Scholar]
- 36.Inouye SK, Westendorp RG, Saczynski JS. Delirium in elderly people. The Lancet. 2014;383:911–922. doi: 10.1016/S0140-6736(13)60688-1. [DOI] [PMC free article] [PubMed] [Google Scholar]