

Abstract
Sleep is essential for survival, yet it also represents a time of extreme vulnerability to predation, hostile conspecifics and environmental dangers. To reduce the risks of sleeping, the sentinel hypothesis proposes that group-living animals share the task of vigilance during sleep, with some individuals sleeping while others are awake. To investigate sentinel-like behaviour in sleeping humans, we investigated activity patterns at night among Hadza hunter–gatherers of Tanzania. Using actigraphy, we discovered that all subjects were simultaneously scored as asleep for only 18 min in total over 20 days of observation, with a median of eight individuals awake throughout the night-time period; thus, one or more individuals was awake (or in light stages of sleep) during 99.8% of sampled epochs between when the first person went to sleep and the last person awoke. We show that this asynchrony in activity levels is produced by chronotype variation, and that chronotype covaries with age. Thus, asynchronous periods of wakefulness provide an opportunity for vigilance when sleeping in groups. We propose that throughout human evolution, sleeping groups composed of mixed age classes provided a form of vigilance. Chronotype variation and human sleep architecture (including nocturnal awakenings) in modern populations may therefore represent a legacy of natural selection acting in the past to reduce the dangers of sleep.
Keywords: sleep, sentinel, chronotype, actigraphy, hunter–gatherer, evolutionary mismatch
1. Introduction
In 1966, Frederick Snyder [1] proposed the sentinel hypothesis (p. 130): ‘Man and other animals have learned that under conditions of danger it is safe to sleep only if sentinels are employed to remain vigilant….’ He further proposed that periodic awakenings associated with shifts between NREM and REM sleep served the purpose of providing individuals with scan samples of their environments. In a group situation, vigilance behaviour could be achieved through behavioural mechanisms to ensure that some individuals serve as sentinels while others sleep. Sentinel-like behaviour could also be achieved through variation in sleep timing, periodic awakenings, and periods of time spent in lighter stages of sleep, from which arousals would be more likely in the context of external threatening stimuli. For example, if some individuals in a group go to sleep early and wake up earlier than other individuals, this would facilitate greater levels of wakefulness at the beginning and end of the sleep period.
Although research on human vigilance behaviour remains largely unexplored [2], work on circadian rhythmicity and sleep homeostasis has investigated individual differences in sleep–wake regulation, revealing high variance in phase timing (i.e. the preference for a given sleep start and end time) consistent with humans having different chronotypes (defined as the individual propensity for sleep and activity at particular times during a 24 h period) [3]. Individuals in the tails of the distribution are colloquially known as morning ‘larks’ and night ‘owls,’ reflecting that they either go to sleep early and wake early, or go to sleep late and wake late. Chronotype variation is found across animals; examples include the existence of stable, species-typical chronotypes in birds [4,5] and rodents [6], and the chronotype of the diurnal degus (Octodon degus) is described as similar to humans [7].
In Western populations, the chronotype distribution is normally distributed, sex-specific (with males biased towards being late chronotype) and characterized by systematic changes to chronotype across the lifespan (with older individuals tending to be more early chronotype) [8]. Chronotype variation is independent of total sleep duration [8] and has been shown to correlate with physiological measures, such as early low core body temperature [9,10], greater melatonin secretion [11], higher cortisol levels [12] and lower testosterone [13] in early morning types. The genetic basis of chronotype variation has been investigated, with twin studies showing that chronotype is moderately to highly heritable (40–72%) [14], and circadian rhythmicity has been linked with PERIOD genes [15] and the circadian clock gene CRY1 [16].
Individual differences in sleep behaviour have been interpreted as variation that is linked to circadian phase misalignment, resulting in health problems and often identified as a sleep disorder when the misalignment is extreme [17]. Recent investigations reframe this disease-focused perspective in the context of evolutionary mismatch, where changes in environments and lifestyles today differ from those in our ancestral past in ways that create evolutionarily novel health challenges [18]. Thus, investigating sleep phasing in nonindustrial humans is not only important to basic science, but may also provide advances in understanding some human sleep disorders.
To investigate group-level sleep patterns in a system relevant to our human evolutionary past, we studied Hadza hunter–gatherers. The Hadza live in a savannah-woodland environment in Northern Tanzania, and their foraging lifestyle has been thoroughly documented [19]. The activity patterns of their society are not regulated from a structured ‘top–down’ system that assumes work during specific times during the day. Additionally, this population lacks environmental barriers; such barriers are standard in post-industrial society, including environmentally controlled buildings with insulation that blunts noise and other critical zeitgebers (e.g. artificial light) that have been previously demonstrated to influence circadian timing of activity or inactivity. With very little if any aid from industrially produced equipment or tools, they hunt and gather on foot using bows, digging sticks, and axes. Sexual division of foraging effort is pronounced, with men hunting for game and spending considerable effort gathering honey, while women gather plant products [20]. While no living population is a perfect model of ancestral lifestyles, Hadza subsistence strategy and ecology are thought to offer important similarities to our Pleistocene ancestors [19].
We investigate the possibility that, under the sentinel hypothesis, phenotypic variation in sleep timing may have been adaptive in ancestral human environments, where night-time wakefulness could have increased group-level vigilance and survivability as a way to counter outside threats from predators, environmental hazards and hostile conspecifics. We predict that only rarely will all individuals in a group be identified as asleep during night-time periods based on actigraphy, which scores sleep based on movement patterns that correspond with wakefulness or light sleep. Alternatively, if all individuals in the study tend to be asleep simultaneously for long intervals of time, the sentinel hypothesis would be rejected. To test this general prediction, we developed a simulation model to produce a null distribution of wakefulness overlap that is tailored to our sampling regime and data. Empirical observations of more extreme variation in wakefulness overlap would support the sentinel hypothesis. We further used this model to investigate the factors that influence sleep synchrony, focusing on variation in chronotype and group size. Finally, to assess whether demographic and other factors maintain chronotype variation, we investigated how age, sex, number of co-sleeping children, weather and nursing status predict chronotype.
2. Methods
(a). Subjects
The Hadza lie near the median value for most ecological and life-history traits among equatorial hunter–gatherers [19]. For example, they live in an East African environment with an effective temperature of 17°C, which is close to the median for warm-climate hunter–gatherers (16.3°C). Average annual temperature varies considerably between day and night (mean min = 14°C, mean max = 35°C), but little across the year (mean ∼ 28°C). Habitat is primarily savannah–woodland, with the inclusion of rocky hills, brush and marshland [19]. Their environment is highly seasonal, with the dry season occurring between June and November and the wet season occurring from December to May, with short rains followed by long rains.
The annual Hadza diet consists of approximately 43% hunted foods (game animals, birds and honey) and 57% gathered foods, including fruits, legumes, tubers, and nuts and seeds [21], similar to the median value for the diets of other African hunter–gatherers [19]. The median local group home range for the Hadza is 122 km2, although range sizes are declining due to adjacent population pressure and globalization [22,23]. Importantly, the median local group size is approximately 30 for the Hadza (mean group size for warm-climate hunter–gatherers is 26), and groups are characterized by central-place provisioning, with individuals returning to a central place to distribute food [20]. The Hadza exhibit high levels of sexual division of labour, with males acting as primary hunters and females as primary gatherers.
Hadza volunteers were recruited from a bush camp located near Lake Eyasi in northern Tanzania (latitude: 03–04°S and longitude 34–36° E). Volunteers participated in the study between June 21 and February 11, 2016. Day length at this time of year ranged between 12.23 and 12.28 h, sunrise occurred between 06.43 and 06.46, and sunset occurred between 18.59 and 19.00 (http://aa.usno.navy.mil/data). Lunar phase ranged from full moon to complete cover of lunar light. Participants were healthy adults over 18 years of age who engaged in daily foraging. In addition to age, exclusion criteria included self-reported insomnia or physical disability due to injury or infirmed status that prevented an individual from engaging in active foraging. Based on injury and infirmed status, three individuals were excluded from analysis; no one was excluded due to insomnia, as no potential subjects reported sleep difficulties. In total, 33 subjects completed the study, with up to 22 subjects wearing actigraphs during any given day. The sample was composed of 21 females (mean age: 34.9 ± 14.3 years) and 12 males (mean age: 35.6 ± 14.7 years).
All research was approved by the Tanzanian Commission for Science and Technology (COSTECH) and the Tanzanian National Institute for Medical Research (NIMR). All eligible subjects gave their verbal informed consent, as outlined by the Institutional Review Board for human subjects research at the University of Nevada, Las Vegas and Duke University. The sleep survey was based on a previously validated-cross cultural survey [24] and translated into Swahili (see electronic supplemental material for the English version of the administered survey).
(b). Protocol
Participants were verbally administered a sleep survey in Swahili, their second language, at the beginning of the study period (20 January–11 February 2016) to screen for healthy sleep and ascertain general information on subjective sleep quality and threat perception (see electronic supplemental material). During the initial survey, participants were asked to rank perceived threats from greatest to least from among a list of five potential categories: (i) animals, (ii) disease, (iii) lack of food, (iv) people and (v) weather. When asked to rank perceived threats, subjects ranked ‘lack of food’ as the most urgent primary threat (48.6%), ‘other people’ (29.7%) as their second most urgent primary threat, with a tie between ‘animals’ (10.8%) and ‘disease’ (10.8%) for primary threats; ‘weather’ was perceived as the least dangerous, with 75.7% of respondents putting it in the least threatening category.
Although polysomnography (PSG) is currently considered the gold standard for quantifying sleep, it remains cumbersome, expensive and difficult to apply with ambulatory participants in a primitive field setting. Actigraphy, on the other hand, is a valuable approach to investigate sleep outside of clinical or laboratory settings. The noninvasive, wrist-worn device has been increasingly adopted to investigate sleep not only in various populations living in post-industrialized Western societies [25], and also in developing countries [26,27] and non-industrialized, small-scale societies [28,29].
We used the Motionwatch 8 actigraph (CamNtech). The MotionWatch 8 sensor logs motion data over a user-defined interval, or epoch, using a built-in tri-axial accelerometer. The sensor samples data at 50 Hz and accumulates data over the epoch, ultimately assigning it an integer value on a ratio scale (‘counts’). We collected data on the minute, as continuous 1-min sampling is the most commonly used actigraphic method for measuring sleep–wake activity patterns in both human and non-human primates [30]. Subjects were asked to press the actigraphy event marker preceding any sleep event throughout the study, including sleep after night-time wake bouts and before initiating daytime naps. Actigraph data were scored using the CamNtech MotionWare 1.1.15 program. The software has a sleep detection algorithm that generates sleep quotas based on actigraphic counts. The algorithmic high-sensitivity settings are the most commonly used in actigraphy sleep studies due to demonstrated reliability for determining sleep versus wakefulness [25]; therefore, we used the high-sensitivity setting in this study. By collecting data on multiple individuals per night, we can control for environmental variables that might affect sleep.
Although the algorithms score an individual as asleep or awake in each epoch, we note that many cases of scored wakefulness may actually represent light stages of sleep. We are assuming here that stimuli occurring during light sleep are more likely to lead to an arousal, and thus relevant to investigating the sentinel hypothesis, even though we do not have direct data on wakefulness (which would require EEG or observation, neither of which are possible in this field setting). The reasonableness of this assumption is based on studies showing that subjects awaken easily from light sleep (stages N1 & N2 characterized by the lowest arousal threshold) and tonic REM [31]. In addition, we note that the algorithms may also score an awake but still person as sleeping. In this case, however, we would be underestimating the degree of synchronous wakefulness, making it harder to test the sentinel hypothesis and thus acting as a conservative bias.
(c). Statistical analyses
We used R v. 3.3.0 [32] to conduct statistical analyses. For each 24 h period throughout the study (n = 20 days), we performed an epoch-by-epoch analysis, from the phase at which the first subject fell asleep to the phase at which the last subject awoke. Sleep epochs were determined by the CamNtech MotionWare software after the sleep onset and sleep offset periods were designated manually by an experienced scorer (D.R.S.), guided by the event markers used by study participants. We generated descriptive statistics reporting the mean wake-ratio (proportion of subjects that are awake at any given night-time epoch) and mean of the median of subjects awake at any given night-time epoch. We also generated the effective group sleep time, which is the sum duration from the first person scored as asleep in the evening to the last person scored as awake in the morning. Moreover, we calculated and averaged circadian phase measure (CPM) [3], which is the midpoint of clock time between sleep onset and awakening.
Functional linear modelling (FLM) was used to characterize and illustrate 24 h sleep–wake patterns [33]. The FLM approach, specifically designed for actigraphy time-series data analysis, measures raw activity counts within and between samples, and can overcome problems when summary statistics mask differences across groups. FLM was used to compare activity patterns to assess the timing of sleep–wake activity on the individual level to identify periods during the 24 h cycle when all individuals (with Fourier smoothed averages) were asleep at the same time.
To characterize the most and least active time periods between sexes, we used Nonparametric Circadian Rhythm Analysis (NPCRA) [34]. NPCRA does not assume that the data fit any pre-defined distribution, therefore making it the preferred method to analyse several consecutive 24 h periods of activity–rest data (which do not typically fit well with traditional Cosinor waveform analysis) [34].
We developed a simulation model for comparison to the empirical data, and to further investigate the underlying mechanisms, including the effects of variation in chronotype and group size on group-level night-time wakefulness patterns. The model was parameterized to match exactly the data collection, including variation in the number of subjects sampled per day, and also using inferences from actigraphy data of transitions from sleep to wakefulness (or light sleep). The model is based on a discrete time Markov chain, in which time units correspond to 1-min epochs in the actigraphy data and the probability of a sleep–wake state in time t depends on the state in time t − 1, with transition probabilities estimated from the collected data. We first ran this model with all individuals having identical transition probabilities, sleep onset time and wake time (i.e. no variation in chronotypes), based on empirical data for one randomly selected individual on a random day. We ran this model 1000 times, randomly sampling an individual from the empirical dataset for each 20-day simulation. To introduce variation in chronotypes, we then repeated the procedure, but using a different individual to parameterize sleep for each individual simulated per day. We also used the model to assess how changes in group size affect sleep synchrony, with and without variation in chronotypes. These more general simulations were run assuming a constant number of individuals sampled across nights, for 20 nights.
To investigate the factors that covary with circadian phase based on CPM, we ran a linear mixed effects model across 390 nights of data. The fixed effects were age, sex, number of co-sleeping children in the bed, nursing status and study day (controlling for environmental variability). We included ‘subject’ as a random effect to control for repeated measures. The model was run using the lme4 package [35] in R, with estimates obtained using log-likelihood optimization. Using multi-model inference based on AIC [36], we averaged models with ΔAIC < 10 using the MuMIn package [37]. Statistical inferences were made using standardized coefficient estimates with shrinkage and 95% confidence intervals.
3. Results
(a). Sleep sites and threat perception
The camp consisted of two subgroups of grass-huts (total n = 22). The distance between the two groups was 127 m, measured to the centre of each. The average distance between huts was 12.7 m, as measured to the closest adjacent hut. The average hut size was 1.89 m (s.d. = 0.42) tall, 2.71 m (s.d. = 0.38) in diameter at the base, and with wall thickness of 0.22 m (s.d. = 0.04). In each hut, on average 3.4 (s.d. = 1.97) individuals slept, including both children and adults. The average noise level in each cluster was 46.95 (dB), and previous research found that an individual can raise his or her voice to be heard across clusters [38].
(b). Measuring forager sleep–wake patterns
We found high levels of scored wakefulness at night by the Hadza. The summary of statistics generated from the night-time epoch-by-epoch results are presented in the electronic supplementary material, table S1. The mean (s.d.) wake-ratio (i.e. the proportion of all participants that were awake at any given epoch during the night-time period) was 0.394 ± 0.08. In other words, on average 60.6% of the group were scored as asleep while 39.4% were scored as awake, indicating inferred wakefulness. On a per-night basis, the median number of individuals (max n = 22 subjects per night) scored as awake ranged from 5 to 12, with an overall median of eight individuals awake at any given time (see electronic material for more detail on sampling characteristics and a supplemental figure of the number of individuals awake throughout the sleep period for each study night). All individuals were simultaneously scored as asleep for a total of only 18 one-minute epochs over 20 nights (13 408 total epochs, and thus simultaneously asleep in only 0.002% of analysed epochs). It is important to note that we were unable to sample every individual in the camp, and actigraphy is known to over-estimate sleep [39]. Thus, it is highly likely that more individuals in this group were simultaneously awake or in lighter, more easily aroused, stages of sleep in a given epoch.
We calculated group sleep time as the duration from when the first person was scored as asleep in the evening to when the last person was scored as awake in the morning. Group sleep was calculated to be 12 h, which is nearly double the average individual sleep duration (table 1) and covers almost the entire period of darkness experienced by this population.
Table 1.
Effective and individual sleep timing and duration. Specifically, timing for effective group sleep is the period between when the first person falls asleep and the last person wakes up. The individual average for this group is measured as sleep onset and sleep end; note that the additional time between onset and end is the individual averaged wake after sleep onset (WASO) time of 2.4 h.
| parameter | effective group sleep | individual averaged sleep |
|---|---|---|
| sleep start | 20.34 ± 31 min | 22.13 ± 36 min |
| sleep end | 07.48 ± 20 min | 06.55 ± 28 min |
| mean sleep duration | 11.26 ± 0.62 h | 06.25 ± 0.72 h |
Sleeping in a larger group will increase the number of individuals who are awake, either through increased noise or simply by chance. To assess whether the observed level of simultaneously scored wakefulness differs from expectations of randomly sleeping individuals, we used our Markov-based null model with transitions between wake and sleep states estimated from the empirical data, while variation among individuals in sleep onset and offset times was ignored. In other words, the null model represented individuals who sleep independently of others and do not show variation in chronotype. The observed mean number of individuals scored as awake (8.65) was significantly higher than expected from this model (mean of the distribution of the null hypothesis = 5.07, 95% of the simulated distribution was from 4.15 to 5.95, with none of the 1000 simulated values exceeding that which was observed). Additionally, we examined whether synchronous sleep is more extreme than expected. We found that the observed value of 18 min of scored synchronous sleep fell below the mean of the null distribution (44.1), but within the 95% confidence interval from our null model (11 to 117), and 10.9% of the distribution was more extreme, i.e. smaller, than observed.
To further investigate patterns of activity, we ran FLM by averaging the circadian actigraphy data for each individual within the group. The output illustrated mean activity patterns for individuals (figure 1), upon which we placed a horizontal line representing a conservative estimate of sleep versus wake determination. This line was placed at a threshold of 80 actigraphy counts per minute; thus, unlike the primary analysis that used the high sensitivity threshold of 20 actigraphy counts per minute to score sleep–wake epochs, we used a setting that overestimates sleep scores and is thus (in this context) a conservative estimate for inferring inactivity. In support of the sentinel hypothesis, at no point in the 24 h period was every individual inferred to be below this threshold.
Figure 1.

Functional linear modelling (FLM) analysis. Individual 24 h averaged activity (counts per minute) generated from FLM is compared among all individual Hadza subjects throughout the 24 h period. The horizontal red line crosses the y-axis at ‘activity 80.’ This analysis reveals that several individuals exhibited moderate levels of activity throughout the 24 h period in this population, and at no point did the averaged activity of all individuals fit under the conservative threshold of 80 activity counts per minute. In other words, more than one individual was inferred to be active throughout the 24 h period based on this analysis.
(c). Potential sleep–wake pattern mechanisms
Several mechanisms could drive the unexpectedly high group-level wakefulness that we documented. First, individuals could show different chronotypes, with variation in sleep onset and offset timing helping to ensure that more individuals are awake throughout the night. Using circadian phase analysis, we found that the Hadza CPM averaged as a group was 03:47 ± 50, and that CPM varied significantly among individuals (figure 2, ANOVA: F = 14.11, d.f. = 388, p < 0.001). These findings are thus consistent with variation in chronotypes among the subjects in our study, which reflects a mean chronotype based on night-to-night variation in sleep timing by each individual. Second, the NREM-REM cycle is highly variable in humans, as the average length of the first cycle is approximately 70–100 min, whereas later cycles shift to approximately 90–120 min [40]. These cycles are associated with brief episodes of arousal, usually involving REM sleep transitions, and could thus influence general patterns of sleep–wake transitions throughout the night. A third mechanism could involve active asynchrony of sleep times throughout the night. This might be achieved, for example, if individuals prefer to sleep when others are awake, perhaps triggered via background noise facilitating sleep by instilling a sense of safety because others are awake. Alternatively, a single individual's activity could promote multiple arousals as a type of cascade effect, which could sustain a pool of awake individuals, even if those awake tend to return to sleep.
Figure 2.
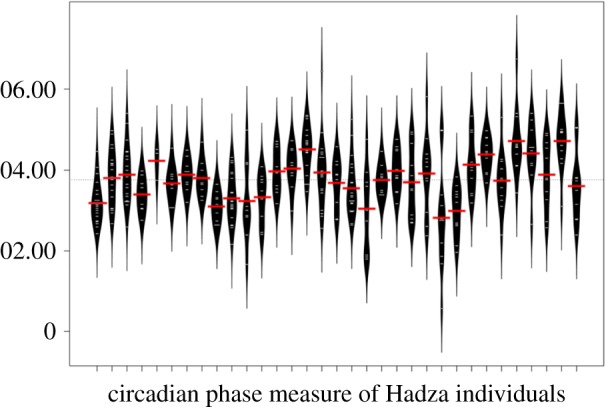
Circadian phase measure (CPM) in Hadza hunter–gatherers. CPM is the midpoint clock time between sleep onset and awakening. Here, the average CPM is illustrated for each individual with a beanplot, where the horizontal white lines show the individual night-time CPM observations and the black shows the distribution of the observed data; shape of the beanplot represents density. ANOVA revealed that the Hadza significantly differ in CPM on the individual level (see §3c). Additionally, the more intra-individual variation, the greater the spread from the red line; that is, the longer and thinner the bean plots, the more variation is seen on the intra-individual level. Note that the tails of the CPM distributions overlap several night-time hours; in other words, variability in sleep timing is distributed throughout the night-time period.
We again used our simulation model of independently sleeping individuals to investigate these possibilities, but this time including chronotype variation across individuals by simulating individual variation in inferred sleep onset and offset based on the nightly data. We expected that observed group wakefulness measures would fall outside of the simulated distributions if active asynchrony is needed to achieve the observed level of wakefulness, and within the simulated distribution if chronotype variation is sufficient to achieve the group wakefulness we observed. We found support for the effect of chronotype variation on maintaining sentinel-like behaviour: the observed mean of 8.65 individuals scored as awake was well within the distribution of simulated values from the model that included chronotype (mean = 8.94, 95% of distribution was from 7.73 to 10.2, and 32.3% of simulated values were below 8.65). Similarly, the number of epochs in which no individuals were scored as awake (n = 18) fell more clearly within the simulated distribution (mean = 12.4, 95% of distribution was from 0 to 38, with the observed value marking the 90th percentile).
These results further raise the question of how chronotype variation is maintained, which we tested cross-sectionally in a linear mixed effects model. We found that variation in chronotype (CPM) covaries with age, but not with other fixed effects that include sex, co-sleeping, nursing status and study day. That is, at older ages, individuals tend to exhibit a more ‘lark’ type chronotype (age: β ± s.e. = −0.23 ± 0.09, p = 0.01, CI = −0.401, −0.056; figure 3). Thus, variation in age helps to generate variation in chronotype, which then facilitates sentinel-like behaviour.
Figure 3.

Plotted slope for the fixed coefficient of ‘age.’ Circadian phase measure (CPM) was regressed on age, with circadian phase generated by calculating each individual's nightly number of minutes asleep from after midnight. The model showed that sex, number of co-sleeping children, nursing status and the study day (correcting for weather) did not significantly influence CPM, but age did.
We also used the model to investigate the effects of group size, aiming to assess the relative effects of group size and chronotype variation on night-time safety in a more general modelling framework that is not strictly tied to this population and sampling regime. The model predicted that the mean number of individuals awake scales linearly with group size (figure 4a), and that the proportion of the time all individuals are asleep drops asymptotically to zero with increasing group size (figure 4b). Without variation in chronotypes, the model revealed that group size would have to be substantially larger to reach a similar level of safety as found with variation in chronotype (figure 4).
Figure 4.

Simulating wakefulness dynamics in relation to group size. The model used to assess significance of our results was also used to generally examine predicted mean number of individuals awake (a) and number of epochs in which all individuals were asleep (b), relative to group size. Open circles indicate simulations with no variation in chronotype, while filled circles incorporate variation in chronotype. Thus, variation in chronotype increases substantially the mean number of individuals awake and, for groups of 12 or fewer, reduces the duration of time when all individuals are asleep.
4. Discussion
These findings provide, to our knowledge, the first test of the sentinel hypothesis in humans. We found that inter-individual variation in chronotype and periodic awakenings are sufficient to generate consistent sentinel-like behaviour throughout the night for Hadza hunter–gatherers, without the need for any active behavioural mechanisms, such as posting of actual sentinels, to maintain asynchrony. Furthermore, our model showed that chronotype is not predicted by sex, environment, nursing status or the number of co-sleeping children, but is a function of age. Thus, on the basis of this research, we introduce the poorly sleeping grandparent hypothesis for sentinel-like behaviour. That is, ancestral band level groups that exhibit variability in age distribution would have facilitated adaptive sentinel-like behaviour through greater variation in chronotypes.
That vigilance decreases as group size increases is one of the most frequently reported relationships in the field of animal behaviour [41]. Our model may therefore explain why the Hadza do not post sentinels at strategic locations throughout the night, as typical sleeping group sizes may be sufficient to generate sentinel-like behaviour. Interestingly, when group size drops below a specific threshold much smaller than the groups we studied, active sentinel behaviour is adopted. For example, reports from San hunter–gatherers indicate that groups of two to three males on long, multi-day hunting trips (to large gatherings of animals at water holes) ensure that at least one hunter is awake at all times (G. Yetish 2017, personal communication). As acknowledged above, our scoring based on actigraphy does not necessarily mean that individuals scored as ‘awake’ are truly awake and vigilant, as compared to studies in other mammals where more direct observations of sentinel behaviours are possible. Sentinel behaviour has often been inferred by observation and anecdotal evidence, but rarely has coordinated vigilance been systematically measured in animal species; thus, in attempts to quantify sentinel behaviour, it has been defined as the distribution of bouts of wakefulness across time that are more evenly distributed than expected by chance [42]. In meerkats, for example, sentinel behaviour has been measured as the proportion of time individuals are bipedal with heads raised [42].
A combination of observations, experiments, polysomnography and surveys would help to assess the degree to which these inferred awakenings in the Hadza actually contribute to sentinel behaviour, and the awareness by individuals that they contribute to actual vigilance against threats. Even for epochs representing light sleep or brief arousals (e.g. between REM and NREM sleep stages), we propose that scored periods of wakefulness would facilitate detection of threats from conspecifics, predators and environmental risks, with higher probabilities for arousal when such stimuli occur at these times. Future research could focus more directly on the role that sleep architecture has in maintaining night-time vigilance behaviour in humans.
Another relevant characteristic of sleep may be that sleep phase is highly adaptable (i.e. flexible) in response to different ecological, social and other factors, in humans [27,29] and other animals [43]. The variation we documented in activity patterns and chronotype (figures 1 and 2) reveals additional evidence of flexibility characterizing sleep in the Hadza. Flexibility may be characteristic of all human populations today, representing a legacy of past selective pressures in foraging populations. For example, the ‘first-night’ effect has been observed to alter sleep in modern humans when sleeping in a new environment, such as a hotel room, by shifting to a greater reliance on sleep in one brain hemisphere and increasing the other hemisphere's sensitivity to deviant stimuli [44]. This effect is similar to what is observed in birds and marine mammals that sleep unihemispherically [45,46]. Use of EEG, coupled with experimental increases or decreased in perceived threat, could be used to test this idea in traditional populations, although subject to ethical considerations for both EEG and experimental manipulations.
Our research raises several new questions. For example, could there be an optimal group size and mix of ages to achieve more effective sentinel-like behaviour in human populations? Sleep timing, duration, and staging changes throughout the lifespan [47] and both chronotype [14] and sleep architecture [48] are heritable. Therefore, an interesting question for future work is to target the role that genes and environment play in the timing and duration of sleep throughout different life-history stages. Another direction for future research concerns ways that natural selection could promote individual variability in chronotype, which would be in addition to the variation we demonstrated in relation to age. Genetic variation in chronotype could be maintained by frequency-dependent selection, such that individuals with rare chronotypes in a population are favoured [49]. Such selection might occur if advantages accrue at the individual level to being awake when most others are asleep. For example, quiet times represent opportunities for attacks by predators or conspecifics, and being awake while others sleep would conceivably reduce individual mortality risk in such conditions. Additionally, group and/or kin selection could favour groups of individuals that show more chronotype variation [50,51]. Variability in chronotype could be further enhanced through sexual selection, perhaps as indicated by variation in reproductive success among chronotypes in Western populations [52]. Alternatively, greater flexibility in sleep patterns could emerge simply from relaxed selection on a specific chronotype in our evolutionary past.
Our findings also have implications for evolutionary perspectives on sleep disorders. Disorders of circadian rhythm are defined by a mismatch between the desired sleep demands of the social environment and that of an individual's natural sleep period [18,53]. Specifically, circadian rhythm disorders are characterized by three types of sleep timing mismatch: (i) advanced sleep phase syndrome, in which affected individuals tend to fall asleep earlier and wake up earlier than preferred, (ii) delayed sleep phase syndrome, in which affected individuals tend to go to bed later and sleep later than is preferred, and (iii) irregular sleep–wake schedule, where a shifting mismatch occurs between the period in which an individual is able to sleep and their preferred sleep period. The mechanisms generating variation in sleep durations and patterning may have resulted in disorders of circadian rhythms in modern populations, especially when coupled with lifestyle and technological changes, such as access to artificial lighting, that may accentuate variation in chronotypes [54]. Our results also shed new light on clinical reports of ‘insomnia’ among older individuals. For example, modern perspectives often hold that changes in sleep duration and timing in the elderly are a disorder to treat [55]; by normalizing ‘wakeful grandparents,’ thereby downplaying the ‘sick role’ among older individuals, clinicians could promote health by reducing overmedication among older individuals.
Intriguingly, Snyder [1] initially postulated (p. 132), ‘….that sleep would have the greatest continuity and the REM state would be best developed in those forms with the highest immunity to predators…either by their own defensive strength or…inaccessibility for protection during sleep.’ This prediction has since been supported in phylogenetic analyses showing that mammalian species that experience a greater risk of predation at the sleep site exhibited less REM sleep [56,57] and that humans have both shorter than expected sleep and a higher than expected proportion of REM sleep [58]. Throughout human evolution, the transition to relatively deeper, higher quality sleep would have conferred cognitive benefits such as the consolidation of memory [59], processing of emotion leading to better social intelligence [60], and increasing creativity and innovation [61]. The success of Homo sapiens has been described as ‘a spectacular evolutionary anomaly’ that has resulted in humans colonizing every terrestrial habitat [62]. Sleep, facilitated by sentinel-like behaviour, was one part of the adaptive suite of characters that led to humanity's evolutionary success.
Supplementary Material
Supplementary Material
Supplementary Material
Acknowledgements
We would like to thank the Hadza, the Tanzanian Commission for Science and Technology (COSTECH) and the Tanzanian National Institute for Medical Research (NIMR) for research approval. We appreciate insightful feedback on the manuscript from Andrew Phillips, James McKenna, Gandhi Yetish and anonymous reviewers.
Ethics
All research was approved by the Tanzanian Commission for Science and Technology (COSTECH), the Tanzanian National Institute for Medical Research (NIMR) and the Institutional Review Board for human subjects research at the University of Nevada, Las Vegas and Duke University.
Data accessibility
The raw data will be archived in DRYAD data repository.
Authors' contributions
D.R.S., A.N.C. and C.L.N. designed research; D.R.S., I.A.M. and A.Z.P.M. performed research; D.R.S. analysed data; D.R.S., A.N.C. and C.L.N. wrote the paper.
Competing interests
We declare we have no competing interests.
Funding
This grant was funded by National Geographic (grant no. 9665-15).
References
- 1.Snyder F. 1966. Toward an evolutionary theory of dreaming. Am. J. Psychiatry 123, 121–136. ( 10.1176/ajp.123.2.121) [DOI] [PubMed] [Google Scholar]
- 2.Beauchamp G. 2015. Animal vigilance: monitoring predators and competitors. Quebec, Canada: Academic Press. [Google Scholar]
- 3.Randler C. 2014. Sleep, sleep timing and chronotype in animal behaviour. Anim. Behav. 94, 161–166. ( 10.1016/j.anbehav.2014.05.001) [DOI] [Google Scholar]
- 4.Von Aschoff J, Wever R. 1962. Spontanperiodik des menschen bei ausschluss aller zeitgeber. Naturwissenschaften 49, 337–342. ( 10.1007/BF01185109) [DOI] [Google Scholar]
- 5.Steinmeyer C, Schielzeth H, Mueller JC, Kempenaers B. 2010. Variation in sleep behaviour in free-living blue tits, Cyanistes caeruleus: effects of sex, age and environment. Anim. Behav. 80, 853–864. ( 10.1016/j.anbehav.2010.08.005) [DOI] [Google Scholar]
- 6.Wicht H, Korf HW, Ackermann H, Ekhart D, Fischer C, Pfeffer M. 2014. Chronotypes and rhythm stability in mice. Chronobiol. Int. 31, 27–36. ( 10.3109/07420528.2013.820739) [DOI] [PubMed] [Google Scholar]
- 7.Labyak SE, Lee TM, Goel N. 1997. Rhythm chronotypes in a diurnal rodent, Octodon degus. Am. J. Physiol 273, R1058–R1066. [DOI] [PubMed] [Google Scholar]
- 8.Roenneberg T, Kuehnle T, Pramstaller PP, Ricken J, Havel M, Guth A, Merrow M. 2004. A marker for the end of adolescence. Curr. Biol. 14, R1038–R1039. ( 10.1016/j.cub.2004.11.039) [DOI] [PubMed] [Google Scholar]
- 9.Baehr EK, Revelle W, Eastman CI. 2000. Individual differences in the phase and amplitude of the human circadian temperature rhythm: with an emphasis on morningness–eveningness . J. Sleep Res. 9, 117–127. ( 10.1046/j.1365-2869.2000.00196.x) [DOI] [PubMed] [Google Scholar]
- 10.Sarabia J, Rol M, Mendiola P, Madrid J. 2008. Circadian rhythm of wrist temperature in normal-living subjects: a candidate of new index of the circadian system. Physiol. Behav. 95, 570–580. ( 10.1016/j.physbeh.2008.08.005) [DOI] [PubMed] [Google Scholar]
- 11.Burgess HJ, Fogg LF. 2008. Individual differences in the amount and timing of salivary melatonin secretion. PLoS ONE 3, e3055 ( 10.1371/journal.pone.0003055) [DOI] [PMC free article] [PubMed] [Google Scholar]
- 12.Randler C, Schaal S. 2010. Morningness–eveningness, habitual sleep–wake variables and cortisol level. Biol. Psychol. 85, 14–18. ( 10.1016/j.biopsycho.2010.04.006) [DOI] [PubMed] [Google Scholar]
- 13.Randler C, Ebenhöh N, Fischer A, Höchel S, Schroff C, Stoll JC, Vollmer C. 2012. Chronotype but not sleep length is related to salivary testosterone in young adult men. Psychoneuroendocrinology 37, 1740–1744. ( 10.1016/j.psyneuen.2012.02.008) [DOI] [PubMed] [Google Scholar]
- 14.Lopez-Minguez J, Ordoñana JR, Sánchez-Romera JF, Madrid JA, Garaulet M. 2015. Circadian system heritability as assessed by wrist temperature: a twin study. Chronobiol. Int. 32, 71–80. ( 10.3109/07420528.2014.955186) [DOI] [PubMed] [Google Scholar]
- 15.Viola AU, Archer SN, James LM, Groeger JA, Lo JCY, Skene DJ, von Schantz M, Dijk DJ. 2007. PER3 polymorphism predicts sleep structure and waking performance. Curr. Biol. 17, 613–618. ( 10.1016/j.cub.2007.01.073) [DOI] [PubMed] [Google Scholar]
- 16.Patke A, Murphy PJ, Onat OE, Krieger AC, Özçelik T, Campbell SS, Young MW. 2017. Mutation of the human circadian clock gene CRY1 in familial delayed sleep phase disorder. Cell 169, 203–215. ( 10.1016/j.cell.2017.03.027) [DOI] [PMC free article] [PubMed] [Google Scholar]
- 17.Reid KJ, Zee PC. 2011. Circadian disorders of the sleep–wake cycle. In Principles and practice of sleep medicine (eds Kryger MH, Roth T, Dement WC), pp. 470–482. St. Louis, MO: Elsevier Saunders. [Google Scholar]
- 18.Nunn CL, Samson DR, Krystal A. 2016. Shining evolutionary light on human sleep and sleep disorders. Evol. Med. Public Health 1, 227–243. ( 10.1093/emph/eow018) [DOI] [PMC free article] [PubMed] [Google Scholar]
- 19.Marlowe FW. 2010. The Hadza: hunter–gatherers of Tanzania. Berkeley, CA: University of California Press. [Google Scholar]
- 20.Marlowe FW. 2006. Central place provisioning, the Hadza as an example. In Feeding ecology in apes and other primates (eds Hohmann G, Robbins MM), pp. 359–379. Cambridge, UK: Cambridge University Press. [Google Scholar]
- 21.Crittenden AN. 2016. Ethnobotany in evolutionary perspective: wild plants in diet composition and daily use among Hadza hunter–gatherers. In Wild harvest: plants in the hominin and pre-agrarian human worlds (eds Hardy K, Kubiak ML), pp. 319–339. Oxford, UK: Oxbow Books. [Google Scholar]
- 22.Crittenden AN. 2014. Ancestral attachment. In Ancestral landscapes in human evolution: culture, childrearing and social wellbeing (eds Narvaez D, Valentino K, Agustin F, McKenna J, Gray JP), p. 282 Oxford, UK: Oxford University Press. [Google Scholar]
- 23.Apicella CL, Crittenden AN. 2015. Hunter–gatherer families and parenting. In The handbook of evolutionary psychology (ed. Buss DM.), pp. 797–827. Hoboken, NJ: Wiley Publishing. [Google Scholar]
- 24.Barry H, Paxson LM. 1971. Infancy and early childhood: cross-cultural codes. Ethnology 10, 466–508. ( 10.2307/3773177) [DOI] [Google Scholar]
- 25.Kanady JC, Drummond S, Mednick SC. 2011. Actigraphic assessment of a polysomnographic-recorded nap: a validation study. J. Sleep Res. 20, 214–222. ( 10.1111/j.1365-2869.2010.00858.x) [DOI] [PubMed] [Google Scholar]
- 26.Knutson KL. 2014. Sleep duration, quality, and timing and their associations with age in a community without electricity in Haiti. Am. J. Hum. Biol. 26, 80–86. ( 10.1002/ajhb.22481) [DOI] [PMC free article] [PubMed] [Google Scholar]
- 27.Samson DR, Manus MB, Krystal AD, Fakir E, Yu JJ, Nunn CL. 2017. Segmented sleep in a nonelectric, small-scale agricultural society in Madagascar. Am. J. Hum. Biol. ( 10.1002/ajhb.22979) [DOI] [PubMed] [Google Scholar]
- 28.Yetish G, Kaplan H, Gurven M, Wood B, Pontzer H, Manger PR, Wilson C, McGregor R, Siegel JM. 2015. Natural sleep and its seasonal variations in three pre-industrial societies. Curr. Biol. 25, 1–7. ( 10.1016/j.cub.2015.09.046) [DOI] [PMC free article] [PubMed] [Google Scholar]
- 29.Samson DR, Crittenden AN, Mabulla IA, Mabulla AZP, Nunn CL. 2017. Hadza sleep biology: evidence for flexible sleep–wake patterns in hunter–gatherers. Am. J. Phys. Anthropol. 162, 399–610. ( 10.1002/ajpa.23160) [DOI] [PubMed] [Google Scholar]
- 30.Sri Kantha S, Suzuki J. 2006. Sleep quantitation in common marmoset, cotton top tamarin and squirrel monkey by non-invasive actigraphy. Comp. Biochem. Physiol. A Mol. Integr. Physiol. 144, 203–210. ( 10.1016/j.cbpa.2006.02.043) [DOI] [PubMed] [Google Scholar]
- 31.Ermis U, Krakow K, Voss U. 2010. Arousal thresholds during human tonic and phasic REM sleep. J. Sleep Res. 19, 400–406. ( 10.1111/j.1365-2869.2010.00831.x) [DOI] [PubMed] [Google Scholar]
- 32.R Core Team. 2016. R: a language and environment for statistical computing. Vienna, Austria. [Google Scholar]
- 33.Shannon W, Li T, Xian H, Wang J, Deych E, Gonzalez C.2015. Functional Actigraphy Data Analysis. Package ‘Actigraphy’. See CRAN repository: https://cran.r-project.org/web/packages .
- 34.Van Someren EJ, Swaab DF, Colenda CC, Cohen W, McCall WV, Rosenquist PB. 1999. Bright light therapy: improved sensitivity to its effects on rest–activity rhythms in Alzheimer patients by application of nonparametric methods. Chronobiol. Int. 16, 505–518. ( 10.3109/07420529908998724) [DOI] [PubMed] [Google Scholar]
- 35.Bates D, Maecher M, Bolker B, Walker S. 2015. Fitting linear mixed-effects models using lme4. J. Stat. Softw. 67, 1–48. ( 10.18637/jss.v067.i01) [DOI] [Google Scholar]
- 36.Burnham K, Anderson D. 2002. Information and likelihood theory: a basis for model selection and inference In Model selection and multimodel inference: a practical information-theoretic approach, 2nd edition, pp. 49–97. New York, NY: Springer.
- 37.Bartoń K.2015. Version 1.15.6 ed. See https://cran.r-project.org/web/packages/MuMIn .
- 38.Samson DR, Crittenden AN, Mabulla AI, Mabulla I, Nunn CL. In review. The evolution of a good night's rest: technological and cultural innovation associated with sleep in Hadza hunter–gatherers. J. Hum. Evol. [DOI] [PubMed] [Google Scholar]
- 39.Stone KL, Ancoli-Israel A. 2011. Actigraphy. In Principles and practice of sleep medicine (eds Kryger MH, Roth T, William C), pp. 1668–1675. St. Louis, MO: Elsevier Saunders. [Google Scholar]
- 40.Carskadon MA, Dement WC. 2005. Normal human sleep: an overview. In Principles and practice in sleep medicine, 4th edn (eds Kryger MH, Roth T, Dement WC), pp. 13–23. Philadelphia, PA: Elsevier Saunders. [Google Scholar]
- 41.Roberts G. 1996. Why individual vigilance declines as group size increases. Anim. Behav. 51, 1077–1086. ( 10.1006/anbe.1996.0109) [DOI] [Google Scholar]
- 42.Bednekoff PA. 2015. Chapter Four—Sentinel behavior: a review and prospectus. In Advances in the study of behavior, vol. 47 (eds Naguib M, Peter JBS), pp. 115–145. Waltham, MA: Academic Press. [Google Scholar]
- 43.Tobler I. 1989. Napping and polyphasic sleep in mammals. In Sleep and alertness: chronobiological, behavioral, and medical aspects of napping (eds Dinges DF, Broughton RJ), pp. 9–30. New York, NY: Raven Press, Ltd. [Google Scholar]
- 44.Tamaki M, Bang Ji W, Watanabe T, Sasaki Y. 2016. Night watch in one brain hemisphere during sleep associated with the first-night effect in humans. Curr. Biol. 26, 1190–1194. ( 10.1016/j.cub.2016.02.063) [DOI] [PMC free article] [PubMed] [Google Scholar]
- 45.Rattenborg NC, Voirin B, Cruz SM, Tisdale R, Dell-Omo G, Lipp HP, Wikelski M, Vyssotski AL. 2016. Evidence that birds sleep in mid-flight. Nat. Commun. 7, 1–9. ( 10.1038/ncomms12468) [DOI] [PMC free article] [PubMed] [Google Scholar]
- 46.Lyamin O, Manger P, Ridgway S, Mukhametov L, Siegel J. 2008. Cetacean sleep: an unusual form of mammalian sleep. Neurosci. Biobehav. Rev. 32, 1451–1484. ( 10.1016/j.neubiorev.2008.05.023) [DOI] [PMC free article] [PubMed] [Google Scholar]
- 47.Ohayon MM, Carskadon MA, Guilleminault C, Vitiello M. 2004. Meta-analysis of quantitative sleep parameters from childhood to old age in healthy individuals: developing normative sleep values across the human lifespan. Sleep 27, 1255–1273. [DOI] [PubMed] [Google Scholar]
- 48.Kuna ST, Maislin G, Pack FM, Staley B, Hachadoorian R, Coccaro EF, Pack AI. 2012. Heritability of performance deficit accumulation during acute sleep deprivation in twins. Sleep 35, 1223–1233. ( 10.5665/sleep.2074) [DOI] [PMC free article] [PubMed] [Google Scholar]
- 49.Ayala FJ, Campbell CA. 1974. Frequency-dependent selection. Annu. Rev. Ecol. Syst. 5, 115–138. ( 10.1146/annurev.es.05.110174.000555) [DOI] [Google Scholar]
- 50.Nowak MA, Tarnita CE, Wilson EO. 2010. The evolution of eusociality. Nature 466, 1057–1062. ( 10.1038/nature09205) [DOI] [PMC free article] [PubMed] [Google Scholar]
- 51.Marshall JAR. 2011. Group selection and kin selection: formally equivalent approaches. Trends Ecol. Evol. 26, 325–332. ( 10.1016/j.tree.2011.04.008) [DOI] [PubMed] [Google Scholar]
- 52.Randler C, Ebenhöh N, Fischer A, Höchel S, Schroff C, Stoll JC, Vollmer C, Piffer D. 2012. Eveningness is related to men's mating success. Pers. Individ. Dif. 53, 263–267. ( 10.1016/j.paid.2012.03.025) [DOI] [Google Scholar]
- 53.Jones CR, Huang AL, Ptáček LJ, Fu YH. 2013. Genetic basis of human circadian rhythm disorders. Exp. Neurol. 243, 28–33. ( 10.1016/j.expneurol.2012.07.012) [DOI] [PMC free article] [PubMed] [Google Scholar]
- 54.Pandi-Perumal S, Seils L, Kayumov L, Ralp M, Lowe A, Moller H, Swaab D. 2002. Senescence, sleep, and circadian rhythms. Ageing Res. Rev. 1, 559–604. ( 10.1016/S1568-1637(02)00014-4) [DOI] [PubMed] [Google Scholar]
- 55.Wright KP, McHill AW, Birks BR., Griffin BR, Rusterholz T, Chinoy ED. 2013. Entrainment of the human circadian clock to the natural light–dark cycle. Curr. Biol. 23, 1554–1558. ( 10.1016/j.cub.2013.06.039) [DOI] [PMC free article] [PubMed] [Google Scholar]
- 56.Capellini I, Barton RA, McNamara P, Preston B, Nunn CL. 2008. Ecology and evolution of mammalian sleep. Evolution 62, 1764–1776. ( 10.1111/j.1558-5646.2008.00392.x) [DOI] [PMC free article] [PubMed] [Google Scholar]
- 57.Lesku JA, Roth TC, Amlaner CJ, Lima SL. 2006. A phylogenetic analysis of sleep architecture in mammals: the integration of anatomy, physiology, and ecology. Am. Nat. 168, 441–453. ( 10.1086/506973) [DOI] [PubMed] [Google Scholar]
- 58.Samson DR, Nunn CL. 2015. Sleep intensity and the evolution of human cognition. Evol. Anthropol. 24, 225–237. ( 10.1002/evan.21464) [DOI] [PubMed] [Google Scholar]
- 59.Walker MP, Stickgold R. 2004. Sleep-dependent learning and memory consolidation. Neuron 44, 121–133. ( 10.1016/j.neuron.2004.08.031) [DOI] [PubMed] [Google Scholar]
- 60.Walker MP. 2009. The role of sleep in cognition and emotion. Ann. N. Y. Acad. Sci. 1156, 168–197. ( 10.1111/j.1749-6632.2009.04416.x) [DOI] [PubMed] [Google Scholar]
- 61.Wagner U, Gais S, Haider H, Verleger R, Born J. 2004. Sleep inspires insight. Nature 427, 352–355. ( 10.1038/nature02223) [DOI] [PubMed] [Google Scholar]
- 62.Hill K, Barton M, Hurtado AM. 2009. The emergence of human uniqueness: characters underlying behavioral modernity. Evol. Anthropol. 18, 187–200. ( 10.1002/evan.20224) [DOI] [Google Scholar]
Associated Data
This section collects any data citations, data availability statements, or supplementary materials included in this article.
Supplementary Materials
Data Availability Statement
The raw data will be archived in DRYAD data repository.