Proc. R. Soc. B 281, 20132312. (7 March 2014; Published online 22 January 2014) (doi:10.1098/rspb.2013.2312)
The corrections are (i) Foote's 2000 terminology of boundary crossers (ii) the inclusion of the time boundary in boundary crosser tabulations. The output values are now in-line with Foote's own tabulations (M. Foote 2017, personal communication).
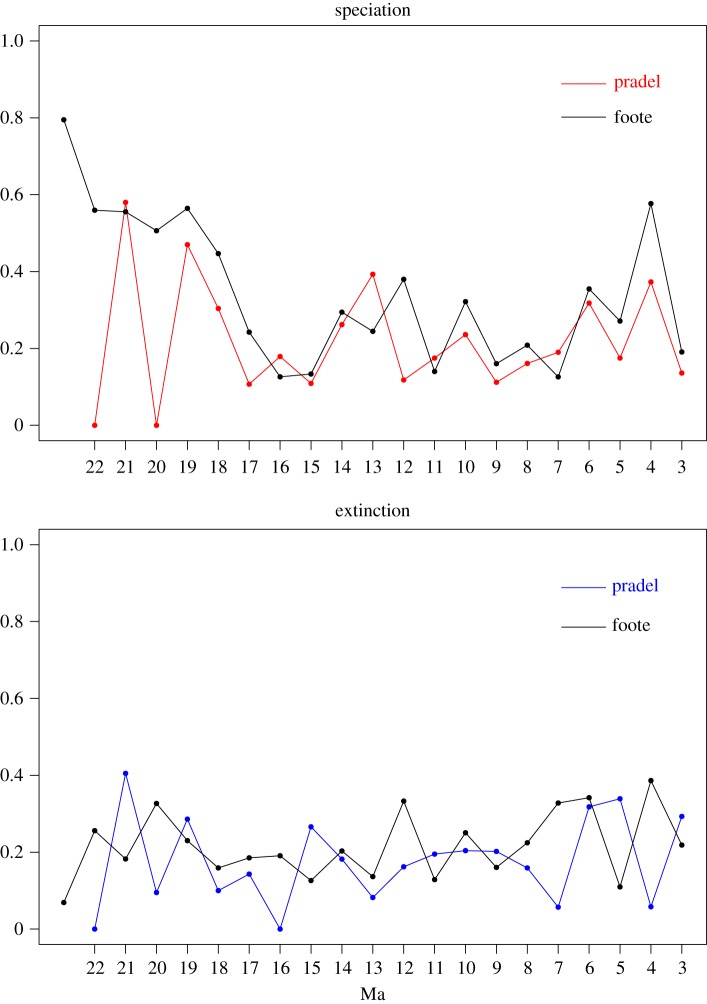
Note that the correlation values between the two estimates (Pradel and Foote) are worse than reported in the electronic supplementary material, figure S12 of the paper. New plots for the comparisons are supplied. These errors do not contribute to any changes in inferences in the main text.
Figure S12.
FA=function(x){min(which(x==1))}
LA=function(x){max(which(x==1))}
#Foote function
footerates <- function(FA, LA, timeint){
da=cbind(FA, LA)
NFt=NA #number of top crosser (this was previously misnamed re Foote 2000)
Nbt=NA #number of double crosser (this was previously misnamed re Foote 2000)
NbL=NA #number of bottom crosser
q=NA#per capita extinction rate
p=NA#per capita origination rate
for (i in 1:(length(timeint)-1))
{
Ft= da[which(da[,1]<=timeint[i] & da[,1] > timeint[i+1] & da[,2] <= timeint[i+1]),]#top crosser
bt=da[which(da[,1]>timeint[i] & da[,2]<=timeint[i+1]),]#double crosser
bL=da[which(da[,1]> timeint[i] & da[,2]<= timeint[i] & da[,2]>timeint[i+1]),]#bottom crosser
#Ft=da[which(da[,1]>timeint[i] & da[,2]>timeint[i+1] & da[,2]<=timeint[i]),] #old code
#bt= da[which(da[,1]>timeint[i] & da[,2]<timeint[i+1]),] #old code
#bL=da[which(da[,1]<timeint[i] & da[,1]>=timeint[i+1] & da[,2]<timeint[i+1]),] #old code
if (!is.null(nrow(Ft)))
{NFt[i]=nrow(Ft)
} else{
NFt[i]=1}
if (!is.null(nrow(bt)))
{Nbt[i]=nrow(bt)
}else{
Nbt[i]=1}
if (!is.null(nrow(bL)))
{NbL[i]=nrow(bL)
}else{
NbL[i]=1}
}
footeq=-log(Nbt/(NbL+ Nbt))#extinction
footep=-log(Nbt/(NFt+ Nbt))#origination
res=cbind(footeq, footep)
colnames(res)=c("q","p")
rownames(res)=timeint[1:(length(timeint)-1)]
#return(res)
return(list(NFt=NFt,NbL=NbL,Nbt=Nbt,Nb= Nbt+NbL,Nt=Nbt+NFt,p=footep,q=footeq))
}
#read in species file
data<-read.csv("rspb20132312supp4.csv",header=FALSE)
#####################
#prepare data in correct format for function "foote"
FAD=apply(data[,2:25],1, FA)
LAD=apply(data[,2:25],1, LA)
times=seq(24,1,-1)
FA=times[FAD]
LA=times[LAD]
FA<-as.integer(FA)
LA<-as.integer(LA)
foote=footerates(FA,LA,(times))
foote=as.data.frame(foote) #Foote rates ready for use
pradel.time=seq(-22,-3, 1)
pradel.est.p=c(0.000, 0.580, 0.000, 0.470, 0.304, 0.107, 0.179, 0.109, 0.262, 0.393, 0.118,
0.175, 0.236, 0.112, 0.161, 0.190, 0.318,0.175, 0.373, 0.136)
pradel.est.q=c(0.000, 0.405, 0.095, 0.286, 0.100, 0.143, 0.000, 0.266, 0.182, 0.082,
0.162, 0.195, 0.204, 0.202, 0.159, 0.057, 0.318, 0.339, 0.058, 0.293)
pradel.est.d=c(0.130, 0.131, 0.158, 0.313, 0.292, -0.040, 0.219, -0.177, 0.108, 0.512,
-0.050, -0.025, 0.042, -0.101, 0.003, 0.165, 0.001, -0.199, 0.504, -0.182)
par(mfrow=c(2,1), mar=c(4,2,2,2))
plot(pradel.time,pradel.est.p, axes=F, xlim=c(-23,-3),ylim=c(0,1),
pch=20,col="red", main="speciation", xlab="")
lines(pradel.time,pradel.est.p, col="red")
axis(1, at=pradel.time, labels=seq(22,3,-1))
axis(2)
points(-times[2:22],foote$p[2:22], pch=20)
lines(-times[2:22],foote$p[2:22], lwd=1)
legend("topright", c("pradel", "foote"), col=c("red", "black"),
lty=c(1,1), bty="n", text.col=c("red","black"))
box()
cor.test(pradel.est.p, foote$p[3:22])#cor= 0.3741679, p-value=0.1041
plot(pradel.time,pradel.est.q, axes=F, xlim=c(-23,-3),ylim=c(0,1),
pch=20, main="extinction", col="blue", xlab="Ma")
lines(pradel.time,pradel.est.q, col="blue")
axis(1, at=pradel.time, labels=seq(22,3,-1))
axis(2)
points(-times[2:22],foote$q[2:22], pch=20)
lines(-times[2:22],foote$q[2:22], lwd=1)
legend("topright", c("pradel", "foote"), col=c("blue", "black"),
lty=c(1,1), bty="n", text.col=c("blue","black"))
box()
cor.test(pradel.est.q, foote$q[3:22]) #cor= -0.2798411, p-value=0.2321


