

Abstract
Methods to generate fibers from hydrogels, with control over mechanical properties, fiber diameter and crystallinity, while retaining cytocompatibility and degradability, would expand options for biomaterials. Here we exploited features of silk fibroin protein for the formation of tunable silk hydrogel fibers. The biological, chemical, and morphological features inherent to silk were combined with elastomeric properties gained through enzymatic crosslinking of the protein. Post-processing via methanol and autoclaving provided tunable control of fiber features. Mechanical, optical, and chemical analyses demonstrated control of fiber properties by exploiting the physical cross-links, and generating double network hydrogels consisting of chemical and physical cross-links. Structure and chemical analysis revealed crystallinity from 30–50%, modulus from 0.5MPa to 4MPa, and ultimate strength 1 to 5 MPa depending on the processing method. Fabrication and post-processing combined provided fibers with extensibility from 100 to 400% ultimate strain. Fibers strained to 100% exhibited 4th order birefringence, revealing macroscopic orientation driven by chain mobility. The physical cross-links were influenced in part by the drying rate of fabricated materials, where bound water, packing density, and micro-structural homogeneity influenced cross-linking efficiency. The ability to generate robust and versatile hydrogel microfibers is desirable for bottom-up assembly of biological tissues and for broader biomaterial applications.
Keywords: silk, hydrogel, double network hydrogel, microfiber, biomaterial, bottom-up assembly
Graphical Abstract

Introduction
The need for new biomaterials with tunable properties, compatibility and degradability that enables bottom-up design is rapidly expanding in the field of biomaterials. These bottom-up platforms provide hierarchical building blocks promising for recapitulating native tissue complexity in tissue engineering approaches1–5. Many approaches to achieve this have utilized fiber spinning techniques, such as electrospinning, microfluidic spinning, melt spinning, and biospinning 2,4,6–10. Upon fabrication, these fibers can be utilized for bottom-up assembly for 3D scaffolds via weaving, braiding, or knitting7. Many polymers have been used in the above fabrication methods, including silk 11–20, collagen 11,21, cellulose, polylactic acid (PLA) 22,23, poly(lactic-co-glycolic acid) (PLGA) 14,22,24, polycaprolactone (PCL) 22,25,26, acrylamine poly(ethylene glycol) (PEGA), polyglycolide (PGA) 25, and poly(L/DL lactide) (PLDL) 2,27.
More recently hydrogel microfiber fabrication has been explored for tissue engineering approaches 2,7,28–34. These systems can be adapted to create cell-laden fibers, wherein the material provides immunoprotection and surrounds the cell in a `native-like microenvironment. Hydrogel microfiber materials can be loaded with growth factors and therapeutics to promote material integration and functionality 2,7. Further versatility can be achieved morphologically, where hybrid approaches allow fabrication with multiple polymer solutions and cell types 2,31,32,35,36. The most common hydrogel microfiber materials use natural extracellular matrix (ECM) components, or naturally derived biopolymers such as alginate and chitosan, collagen, fibrin, or combinations thereof, to produce hybrid materials 6,7,28,29,31,33–35,37–45. For fibers capable of mechanical analysis, tensile properties for alginate hydrogel fibers revealed modulus, ultimate strain and ultimate stress ranging 0.18–0.53 MPa 28, 13–100%, and 0.09–0.6 MPa 10,33,46. While the field of hydrogel microfiber processing has progressed, challenges remain to provide consistent and versatile microfiber fabrication outputs. Options remain limited for fibers that provide suitable and reproducible mechanics and production of fibers with a high degree of uniformity 7,28,33,37,38,44.
Silk has emerged as an interesting material for biomedical applications 15. Native silk fibers exhibit desirable mechanical properties, where morphology and tensile properties are reflected by the source of the silk; Bombyx mori silkworms 7,15,48, spider silk 7,49 and Hyalophora cecropia moths 7,50. Upon removal of sericin through extraction in alkaline solution, biocompatibility of silk fibers is achieved 15,51,52. Silk has affords excellent physical and chemical properties, such as stability in salts and various pHs, while also allowing for chemical modification 15 Attempts to recapitulate native mechanical properties have been investigated with regenerated silk fibroin (RSF) via electrospinning 14,16, wetspinning 55,56, dry spinning 18, and microfluidic silk spinning 4,20. Although these silk fabrication techniques can achieve crystallinity content in line with that of native silk, thus affording great strength, there remains a limitation with fabricating a single fiber that provides high strength and extensibility.
There remains a need for hydrogel microfiber fabrication that results in tunable and reproducible fiber features, from mechanics and dimensions, to cell compatibility, degradability, and reproducibility. Therefore, the objective of this work is to exploit the features of silk fibroin protein for the formation of tunable and controllable silk hydrogel microfibers. The goal is to combine the advantages of favorable biological, chemical, morphological, and mechanical design features inherent to silk fibroin with the elastomeric properties gained through enzymatic-mediated oxidative cross-linking 57. Variable post-processing techniques coupled with the polymer swelling state can be exploited to induce a range of physical and chemical cross-links in the microfibers fabricated; further modulating properties.
Methods
Preparation of Silk-HRP Fiber Precursor Solution
Silk aqueous solutions were prepared using previously established protocols58. Briefly, 10 grams of B. mori silkworm cocoons were extracted for 10, 30, or 60 minutes in a 0.02M Na2CO3 (Sigma-Aldrich, St. Louis, MO) aqueous solution and rinsed three times for 20 minutes to remove sericin. The degummed cocoons were dried in a fume hood for more than 24 hours and then dissolved in a 9.3 M LiBr (Sigma-St. Louis, MO) solution for 3–5 hours in 60 °C. The solution was dialyzed for 2 days against distilled water using regenerated cellulose membranes (3500 MWCO, Thermo Scientific, Rockford, IL). The solubilized protein solution was then centrifuged twice (9,700 RPM, 20 min, 4 °C) and the concentration was determined by placing a wet volume of solution in a 60 °C oven to measure the final dry weight, where the final solution was between 5–7 w/v %. Silk-HRP hydrogels were prepared following our previously established protocols57, where horseradish peroxidase (HRP), type VI (Sigma-Aldrich, St. Louis, MO) lyophilized powder was added to deionized water to prepare a stock solution of 500 U mL−1. The stock HRP solution was added to the silk solution at 10 Units of HRP (20 μl) per 1 mL of 5% silk solution (10, 30, or 60 minute degumming time (md)). Enzymatic cross-linking was induced with 10 μL of 165 mM of hydrogen peroxide (Sigma-Aldrich, St. Louis, MO) per 1 mL of silk solution and gentle pipetting of all three solutions was performed prior to fiber casting.
Hydrogel Fiber Fabrication
Upon mixing the silk-HRP hydrogel solution and before setting, a 3 mL syringe (Becton, Dickinson and Company, Franklin Lakes, New Jersey) equipped with either a 16 G or 21 G needle was used to extract the homogenously mixed solution from a 6-well plate. Prior to injection, silicone tubing (Dow Corning Corporation, Midland, MI) was prepared by rinsing, autoclaving and cutting the tubing into 20 cm long pieces. The syringe with the hydrogel solution was degassed and hydrogel solution was injected into 1 mm or 1.98 mm ID silicone tubing that was open at both ends (Figure 1A). Cast tubing was incubated at room temperature for 1 hour during gelation. Following gelation, the tubing was placed in an oven and incubated for 24 hours (1 mm) or 48 hours (1.98 mm) at 60 °C or room temperature (RT) (18–22° C) (Figure 1B). Upon dehydration, the fibers were removed from tubing using a 16 G needle (McMaster-Carr, Robinsville, NJ) and prepared for post-processing (Figure 1C). The 60 °C fibers were removed from tubing after 24 hours and the RT fibers required a week to dry prior to ejection.
Figure 1.

Process flow diagram for fabricating hydrogel microfibers. Silk properties are exploited to produce a hydrogel precursor solution (A1) and cast into silicon tubing of desired diameter (B2). Following gelation, the microfibers are placed to dry at 60 °C or room temperature (RT). After drying at the respective temperature, fibers are removed from the mold and undergo control (3a), pre-swelling (3b), or post-swelling (3c) processing (C).
Post-Processing
Fibers from both 60 °C and RT drying groups were assigned post-treatment pathways post-ejection (Figure 1C). A control fiber group was fabricated to compare effects of no post-treatment. Control fibers were directly transferred into swelling solution to reach equilibrium with no post-treatment (Figure 1C, 3a). Fiber post-processing consisted of autoclaving (121 °C, 15 psi, 20 min sterilization with 20 min drying time) or methanol treatment using either pre- or post- swelled fibers in deionized water (DI) or phosphate buffer solution (PBS). Pre-autoclave processing consisted of autoclaved fibers in PBS or DI prior to submersion in their respective swelling solution (PBS/DI) to reach 100% swelling capacity. Similarly, the pre-methanol treatment consisted of treating the extracted fibers in 100% methanol for 60 minutes and then placing them in DI or PBS solution after treatment (Figure 1C, 3b). Post- autoclave and post-methanol processed fibers were treated after 4 days of swelling in PBS or DI solution (Figure 1C, 3c). Fibers were placed back into swelling medium to reach equilibrium prior to further characterization.
Figure 3.

Total water content for each post-treatment for RT and 60 °C processing groups. Post-treatments above refer to no post-treatment (control), autoclave or methanol treatment prior to sample placement in DI water to reach swelling equilibrium (pre-autoclave, pre-methanol), autoclave or methanol treatment after sample reaches equilibrium (post-autoclave, post-methanol). Bold horizontal bars represent a significant difference between two groups for both total and unbound content, non-bolded bars represent a significant difference between two groups in total water content only. For all groups N=3. *** p<0.0005, ** p< 0.005, *p<0.05.
Characterization
Thermogravimetric Measurements
Water content in the silk microfibers was determined by thermogravimetric analysis (TGA) using a TA 500Q instrument (TA Instruments, New Castle, DE). Fibers were frozen with liquid nitrogen and directly placed into the TGA. Fibers were heated at a heating rate of 5 °C/minute to 600 °C. This ramp was used to assess the water content of the hydrated fiber, as well as the bound water within the fiber matrix.
Transmittance
Optical transparency of all drying rates and post-treatments was performed by using 400 μl precursor silk-HRP solution to fabricate cylindrical gels, which subsequently followed the same drying and post-treatment processes of the hydrogel microfiber system. Using the hydrogels instead of the microfibers provided relative comparisons of optical properties arising from different drying rates and post-treatments. To measure transparency, a plate reader (SpectraMax M2, Molecular Devices) was used and replicates were placed in 96-well plates and measured from 200–700 nm at 10 nm intervals. DI water (DI) was used as a control and all data were normalized with respect to the DI having 100% transmittance. Absorbance values obtained were converted to transmittance values using the following equation:
| (1) |
where A is absorbance, and T is transmittance.
Polarized Optical Microscopy
Birefringence data was inferred by placing fiber samples between two crossed polarizers with the fiber long axis at 45 degrees to the polarizer’s fast axis, which is the condition producing maximum brightness under conditions of uniaxial birefringence. Samples were analyzed using a Nikon Eclipse E600 Polarizing Optical Microscope (Nikon, Tokyo, Japan) connected to a CCD camera (Diagnostic Instruments Inc., Sterling Heights, MI) and images were obtained using Spot 5.2 Advanced Image Analysis Software and a 10X objective was used to image all samples. Birefringence as a function of strain was determined using a custom strain fixture, where a fiber was placed in the device with a 3 cm gauge length and placed under strain to 100 percent in 20 percent increments. The fixture was placed in a delrin bath that allowed for fiber hydration during straining. The fibers were first imaged at 0% strain under bright-field microscopy and also imaged under polarized light for birefringence. The fibers were subsequently strained at a rate of 1.27 mm/sec and both bright-field and birefringent images were acquired at 20, 40, 60, 80, and 100% strain.
In addition to experimental calculations, the theoretical change in diameter of each fiber tested was calculated. To approximate this change in diameter as a function of strain, a Poisson ratio of 0.3 ( , characteristic of fully amorphous polymers, was applied. This assumption is driven by the fact that the sorption characteristics of elastomeric materials in a hydrated medium is largely driven by the swelling of the amorphous component of fiber network 59. The Poisson ratio of 0.3 was used to determine theoretical end diameters at 20, 40, 60, 80 and 100% strain and the diameter at 0% strain was determined through bright-field imaging and ImageJ analysis. The following equations were applied to determine the theoretical values:
| (2) |
where , the strain in the transverse and axial directions, is given by:
| (3) |
| (4) |
and and represent the change in length and diameter (final-initial) respectively. and are the original diameter and length of the fiber. The length was determined by measuring the gauge length of each fiber prior to testing and the diameter was measured in ImageJ software using the 0% strain bright-field images acquired in the experimental section. Moreover, to calculate the theoretical final fiber lengths, the original length was multiplied by 1.2, 1.4, 1.6, 1.8 and 2, correlating to 20, 40, 60, 80 and 100% strain. The experimental diameter at 0–100% was compared to the theoretical diameters calculated and percent error between the two values was calculated to determine the percent that the experimental diameters deviated from theoretical at each increment.
Birefringence images taken under polarized light at each strain increment were used to assess the retardation at each strain increment. Further, a Michel-Levy chart was utilized to use the retardation color and fiber thickness to interpolate birefringence of each sample for each strain increment.
Fourier Transform Infrared Spectroscopy
Secondary structure was determined using Fourier transform infrared spectroscopy – attenuated total reflection (FTIR-ATR) (JASCO, Tokyo, Japan). Unstrained fiber samples from each drying rate and post-treatment category were tested. Additionally, fibers that were strained to 100% using the custom birefringence strainer were tested to compare secondary structure in non-strained and strained fibers. Samples were soaked three times for 30 minutes in deuterated water to eliminate interference of water in the amide I region. Each sample was tested with 32 scans with 4 cm−1 resolution. Fourier self-deconvolution (FSD) of the Amide I region (1590–1720 cm−1) was performed using Opus 5.0 software (Bruker Optics Corp., Billerica, MA) and deconvoluted spectra were fitted with Gaussian curves using previously reported methods 60, where the fraction of area under respective spectral curves was used to determine β-sheet content.
Tensile Properties
Tensile testing was performed using a TA Instruments RSA3 Dynamic Mechanical Analyzer (TA Instruments, New Castle, DE) in tension mode and in a solution bath to maintain hydration during testing. A fiber gauge length of 10 mm was placed between stainless steel clamps, where the top and bottom clamps were lined with electrical tape to prevent slipping and provide a cushioned grip during testing. Tensile testing at a rate of 0.045 mm second−1 for 900 seconds, or until failure, was carried out to determine tensile modulus, ultimate strain, and ultimate stress. Light microscopy images were obtained for the pre-swelled (t= 0) and post-swelled fibers (t=5 days). For pre-swelling post-processing, fibers were imaged for the starting diameter (t=0) before and after processing conditions. Post-swelling post-processed fibers were placed back into swelling solution at t=4 days for 24 hours prior to final diameter measurements. To assess mechanical stability over time, fibers were stored in DI at room temperature and tensile mechanics were performed using the same method above at 0, 1, and 2 months.
Statistical Analysis
Unless otherwise noted, two-way analysis of variance (ANOVA) and Sidak post-hoc analysis were used to test statistical significance using GraphPad Prism Software v7.0 (GraphPad Software Inc., San Diego, USA). P values < 0.05 were determined as statistically significant and are reported as **** p< 0.0001, *** p<0.0005, ** p< 0.005, *p<0.05. All data are presented as mean ± standard deviation (SD).
Results
Water Content
TGA runs of silk/HRP gel and silk/HRP gel placed in 60 °C overnight provided a control confirming that the temperature ramp utilized was successful at detecting unbound and bound water content (Figure 2, A–B) in the hydrogel fibers (Figure 2C). The water content was the least for both 60 °C and RT control groups, revealing the importance for post-processing in order to drive water into the fiber matrix (Figure 3, Table 1). Overall, RT groups revealed the greatest amount of total water content ranging from about 22–28%, whereas 60 °C ranged between 10–21%. RT total content was predominately attributed to more unbound water content when compared to 60 °C (Figure 3, Table 1), with RT unbound ranging between 15–23% and only 5–14% for the 60 °C group (Figure 3, Table 1). Interestingly, both RT and 60 °C post-treatment groups revealed bound water ranging between 3–7%. In both groups, the pre-autoclave treatments had the greatest amount of total water content, at about 21% for 60 °C and 28% for RT (Figure 3, Table 1). However, the pre-autoclave post-treatment revealed the greatest amount of bound water for all 60 °C and RT post-treatments at a value of about 7% (Figure 3, Table 1).
Figure 2.
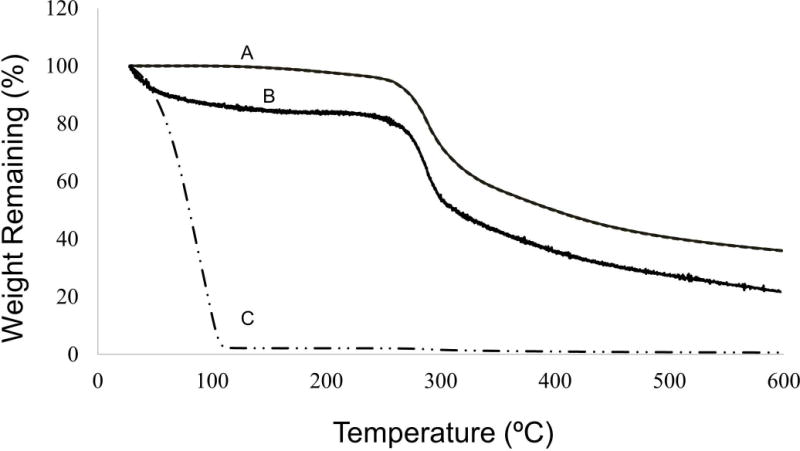
Water content determined using TGA. Gel dried in 60 °C overnight (A) and Silk-HRP gel (C) provided controls to assess whether the TGA ramp accurately infers overall fiber water content, as well as the bound water in the fiber matrix. Representative graph for the hydrogel microfiber (B) reveals loss of unbound water content between 25 °C and 50 °C, whereas loss of bound water occurs between 50 °C and 275 °C.
Table 1.
Comparison of fiber water content and bound water content for each drying rate and post-treatment (N=3). Both groups are representative of the 30md fiber group.
| 60 °C Drying Rate | RT Drying Rate | |||||
|---|---|---|---|---|---|---|
| Post-treatment | Total Water Content (%) | Unbound Water Content (%) | Bound Water Content (%) | Total Water Content (%) | Unbound Water Content (%) | Bound Water Content (%) |
| Control | 10.9 ± 3.53 | 5.21 ± 3.00 | 5.7 ± 1.87 | 20.8 ± 6.61 | 15.1 ± 5.13 | 5.71 ± 5.13 |
| Pre-Autoclave | 20.8 ± 6.67 | 14.4 ± 2.06 | 6.7 ± 4.65 | 27.9 ± 9.21 | 23.2 ± 10.0 | 4.67 ± 0.83 |
| Post-Autoclave | 15.8 ± 2.25 | 10.2 ± 1.65 | 5.6 ± 0.76 | 24.9 ± 7.83 | 19.1 ± 7.84 | 5.81 ± 1.33 |
| Pre-Methanol | 16.2 ± 4.46 | 12.4 ± 3.77 | 3.7 ± 0.70 | 22.70 ± 1.82 | 17.1 ± 1.25 | 5.60 ± 0.57 |
| Post-Methanol | 16.0 ± 2.37 | 10.9 ± 2.52 | 5.1 ± 0.15 | 22.7 ± 1.82 | 17.1 ± 1.25 | 5.60 ± 0.57 |
Transmittance
Optical properties of silk materials are of interest. Therefore, following post-treatments visual differences to infer structural alterations were assessed. Transmittance was compared for all post-treatments and both drying rates and to determine the least and most transparent post-treatments all transmittance values for the seven wavelengths in the visible range were averaged (Figure 4). Both 60 °C and RT had the same trend in post-treatment transmittance, with pre-autoclaving resulting in the least and post-methanol having the most transparency (Figure 4, A–B). The 60 °C group had more transmittance in the visible range compared to the RT drying rate, with the exception of wavelengths around 600 nm, suggesting that there are crystal structures that form on the order of 600 nm, but more broadly these structures are below the visible range (Figure 4A). Conversely, the lower transmittance observed across visible wavelengths for the RT group suggests structures existing on the order of 400–700 nm (Figure 4B). With regard to the most and least transparency, depicted by post-methanol and pre-autoclave treatments respectively, it is possible these differences are due to a combination of topological and molecular scattering (Figure 4C). Further, pre-autoclaving treatments allowed for increased chain mobility and physical cross-linking that produced larger crystals in the hydrogel fiber network, increasing light scattering in the visible range (Figure 4C). Additionally, it is plausible that the high temperatures experienced with autoclaving produced microstructural defects on the surface of the fibers that increased light scattering 61,62.
Figure 4.

Transmittance of post-treatments for each drying rate (A, B). Post-treatments above refer to no post-treatment (control), autoclave or methanol treatment prior to sample placement in DI water to reach swelling equilibrium (pre-autoclave, pre-methanol), autoclave or methanol treatment after sample reaches equilibrium (post-autoclave, post-methanol). The highest (post-methanol) and lowest transmittance (pre-autoclave) was consistent in both drying groups and plotted to reveal differences in extremes for 60 °C versus RT (C, N=7). Post-treatments for each drying rate (60 °C or RT) resulting in the highest and lowest transmittance were plotted separately. For all post-treatment groups N=3. **** p< 0.0001, *** p<0.0005, ** p< 0.005, *p<0.05
Optical Insight into Mechanics: Birefringence
Optical characterization was used to assess birefringence as a function of strain to determine effects of fabrication and post-treatments on chain mobility (Figure 5). Birefringence is a useful tool to infer molecular rearrangement and macroscopic alignment, as higher orders are attributed to improved fiber orientation. At 0% strain, all fiber groups were between 1st and 2nd order birefringence (n > 0.011), but exhibited 4th order birefringence (n > 0.033) at 100% strain (Figure 5, C–D). Overall, there was a greater significant change in birefringence between 0% and 100% strain for the 60 °C group compared to the RT group, revealing that the 60 °C fibers were capable of cycling through a broader range of order compared to the RT group (Figure 5, C–D). Example fibers under polarized light from the RT pre-auto and 60 °C pre-auto groups visually represents how the 60 °C fibers were capable of cycling through different orders ranging from 2nd order cyan to 4th order green, while the RT samples remained at 2nd order cyan for 40% strain before being able to cycle to a higher 3rd order orange (Figure 5, A–B).
Figure 5.

Fibers strained at 20% increments using a custom strain device were imaged using polarized light (A, B) and birefringence was interpolated using a Michel-Levy birefringence chart. Birefringence at 0 and 100% strain was compared for each drying rate (60 °C or RTC) and all post-treatments (C, D). Post-treatments above refer to no post-treatment (control), autoclave or methanol treatment prior to sample placement in DI water to reach swelling equilibrium (pre-autoclave, pre-methanol), autoclave or methanol treatment after sample reaches equilibrium (post-autoclave, post-methanol). Red dashed lines represent transition from 1st to 2nd order and 3rd to 4th order birefringence. For all groups N=3. **** p< 0.0001, *** p<0.0005, ** p< 0.005, *p<0.05
Light-microscopy images were taken in concert with polarized images throughout 0–100% strain to provide images for dimensional ImageJ and for analyzing birefringence of each treatment group. Diameters determined by ImageJ at each 20% strain increment were then compared to theoretical calculations that were performed using equations 1–3 above. Theoretical and experimental diameters were compared at 100% strain, providing insight into changes in secondary structure as a function of strain. By using 0.3 Poisson ratio, the deviation (percent error) found between experimental and theoretical diameters at 100% provided a standard for comparison. The Poisson ratio of 0.3 is based on the assumption that swelling in the fiber network would be attributed to amorphous regions. Therefore, larger deviation of experimental diameter from theoretical suggests swelling of regions other than amorphous. Overall, 60 °C fibers deviated from theoretical diameter more than RT fibers, suggesting there was water intake in more than just amorphous regions (Figure 6, Table 2).
Figure 6.

Post-treatments from each drying rate group that resulted in the highest percent deviation from the theoretical diameter are plotted to reveal the path of change in diameter with strain (A, B). Highest percent deviation from theoretical calculations for the RT drying rate group was the pre-autoclave post-treatment (A), where fibers were autoclave treated prior to reaching swelling equilibrium. Maximum diameter deviation in the 60 °C drying group was the control group, corresponding to fibers that had undergone no post-treatment and directly placed in DI to reach swelling equilibrium (B). For all groups N=3. *** p<0.0005, ** p< 0.005, *p<0.05.
Table 2.
Experimental diameters were compared to theoretical calculations and percent error determined. Values are reported as the percentage that the experimental deviates from the theoretical diameter values at 100% strain (N=3).
| Post-treatment | RT Diameter Deviation (%) | 60 °C Diameter Deviation (%) |
|---|---|---|
| Control | 16.1 ± 14.4 | 24.8 ± 0.28 |
| Pre-Autoclave | 19.6 ± 17.0 | 23.3 ± 5.8 |
| Post-Autoclave | 6.0 ± 4.9 | 23.7 ± 7.42 |
| Pre-Methanol | 16.9 ± 19.6 | 16.6 ± 16.6 |
| Post-Methanol | 13.0 ± 4.0 | 8.90 ± 15.0 |
Secondary Structure
To infer changes in secondary structure with strain, FTIR and FSD were used to compare the secondary structure at 0 and 100% strain. Overall, 60 °C fibers had the highest β-sheet content (>30%), while RT fibers remained ≤35% region (Figure 7, Table 3). Interestingly, for 60 °C there was uniformity of β-sheet content with strain. For example, at 0% strain the 60 °C group had greater variation than RT, but at 100% both RT and 60 °C showed similar variations in β-sheet content for each post-treatment group (Figure 7, Table 3).
Figure 7.

FTIR spectra of fibers processed using RT and 60 °C drying rates with all post-treatments at 0 and 100% strain (A, B, C). Respective beta-sheet comparisons for each group plotted to reveal changes occurring between 0 and 100% strain (D, E). For all groups N=3
Table 3.
β-sheet content of 6°C and RT processed fibers for each post-treatment method at 0 and 100% strain (N=3).
| 60°C Drying Rate | RT Drying Rate | |||
|---|---|---|---|---|
| Beta Sheet (%) | 0% strain Beta sheet (%) |
100% strain Beta sheet (%) |
0% strain Beta sheet (%) |
100% strain Beta sheet (%) |
| Post-treatment | ||||
| Control | 41 ± 12.4 | 36 ± 1.40 | 32 ± 1.80 | 31 ± 1.87 |
| Pre-Autoclave | 36 ± 7.38 | 36 ± 2.24 | 31 ± 1.39 | 35 ± 2.90 |
| Post-Autoclave | 45 ± 0.99 | 40 ± 0.65 | 42 ± 3.51 | 40 ± 0.65 |
| Pre-Methanol | 39 ± 4.35 | 32 ± 2.24 | 38 ± 0.09 | 40 ± 3.42 |
| Post-Methanol | 38 ± 2.00 | 34 ± 2.82 | 41 ± 1.70 | 38 ± 2.25 |
Mechanical and Dimensional Tunability
The polymer-solvent interactions driven by fabrication and post-processing resulted in mechanical (Figure 8, C–D) and dimensional tunability (Figure 8, A–B). Fibers cast in 1mm ID silicon tubing had diameters between 200–300 μm. Fibers cast in 1.98 mm ID tubing had larger microfibers 500–700 μm in diameter, with only 30 md fibers in DI swelling medium and 10 md in PBS medium with significant.
Figure 8.
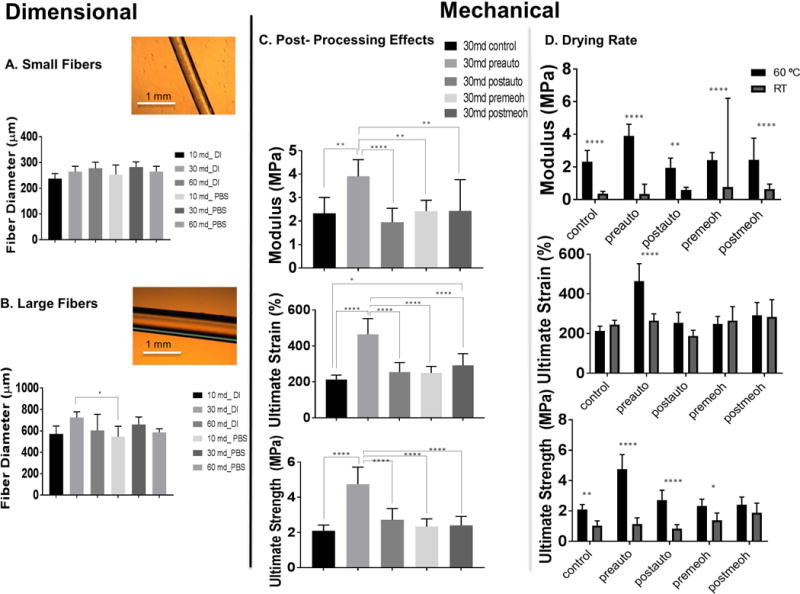
Tunability, repeatability, and handling is inferred from dimensional (A, B) and mechanical analysis (C, D) of elastic microfibers. Versatile cast- ejection fabrication enables small (A) and large (B) diameter fiber formation from 200–700 μm. Light microscopy images are provided as examples used for ImageJ analysis (A, B). Post-treatment and fabrication versatility lends to fibers able to be handled for in-depth mechanical testing (C, N=9), (D, N=6 (RT), N=9 (60 °C)). Fiber tunability is revealed through mechanical data: tensile modulus, ultimate tensile strain, ultimate tensile strength (C, D). Inherent silk properties of enzyme-mediated cross-linking, in combination with post-processing (C) and drying rate (D), enabled microfibers with a range of mechanical properties. One-way ANOVA with a post-hoc Tukey anaylsis was performed and p<0.05 was determined statistically significant (A, B, C) **** p<0.0001, *** p<0.0005, ** p< 0.005, * p<0.05.
Tunability of fiber mechanics was assessed for post-processing effects alone, as well as in combination with drying rate and degumming time. The 30 md silk fabricated at 60 °C produced the broadest range of mechanical properties (Figure 8C) and was therefore utilized to examine fabrication and post-processing effects through molecular and optical characterization (Figure 2–7). Depending on the drying rate (60 °C, RT) and post-treatment method, the tensile modulus of the fibers ranged from 2–4 MPa, strain from 150–300%, and ultimate tensile strength (UTS) from 1–4 MPa. The pre-autoclave post-processing treatment resulted in significantly improved mechanical properties in comparison to the control, pre-methanol, post-methanol and post-autoclave treatments
Exploiting silk molecular weight through silk fiber degumming time, 10 and 60 minute treatments were also examined and revealed an additional outlet of tunabiltiy (Figure S1). The results show that comparison between the two extreme molecular weights tested, ultimate tensile strength was most impacted (Figure S1). UTS ranged from about 0.1 to 3.5 MPa with silk fiber degumming time (Figure S1). Therefore, the higher molecular weight of the 10 md group resulted in greater chain entanglements acting as temporary cross-links under strain, resulting in a network of greater ultimate strength (Figure S1).
Additionally, fabrication temperature (60 °C, RT) effected overall mechanics (Figure 8D). The tensile modulus ranged from about 1 to 4 MPa and ultimate strain between about 100 to 250%. Significant difference was revealed between RT and 60 °C tensile modulus of the pre-methanol group and tensile modulus and ultimate strain of the pre-autoclave groups (Figure 8D).
Although fabrication at 60 °C resulted with more repeatable and homogenous fibers, the mechanics of these fibers had a higher variation within each group compared to the RT fibers (Figure 8D). This higher variability could be due to the increased temperature causing faster concentration protein, driving faster crystal nucleation and growth, particularly with the borader molecular weight range (31–268 kDa) attributed to 30 md 63. Overall, the fabrication steps provided repeatable fabrication of homogenous fibers for subsequent post-processing and characterization.
Mechanical Stability
Mechanical stability was assessed for both drying rates and all post-treatments for a two-month period (Figure S2). With the exception of a decreased ultimate strain at 2 months in the RT pre-autoclave group, there were no significant changes in mechanics (Figure S2B). The decrease in strain for RT pre-autoclave could be due to a lower overall β-sheet content at t=0 (Figure S2, Table 3).
Discussion
Biomaterial-based fibers with robust and tunable mechanics will provide options for bottom-up design of 3D tissue scaffolds with new modes of functionalization. To achieve such outcomes, new biopolymer processing strategies are required, which provides motivation for the present research.
This work demonstrates a silk hydrogel microfiber fabrication protocol to generate reproducible fibers handleable for various characterization techniques. This fiber platform provided morphological and structural tunability to achieve a range of mechanical properties. By exploiting silk properties and enzymatic cross-linking methods, hydrogel fibers were fabricated with superior strength, extensibility, and long-term stability compared to previously established hydrogel microfibers 6,7,28,29,31,33–35,37–45.
Fabrication and post-processing methods affected the overall water content in the fibers, ultimately driving changes in mechanical properties (Figure 1–3, Table 1). Post-processing for 60 °C and RT fabrication groups was necessary to drive water into the network (Figure 3, Table 1). The combination of drying rate and swelling dependent post-processing techniques, impacted the bound and unbound water content in the fiber network (Figure 3, Table 1).
Fabrication drying rate contributed to overall water content due to the effects of temperature on crystal growth and aggregation. The free volume determined by crystallinity and microstructural defects from the drying step and the swelling state upon post-treatment influenced diffusion pathways and total water entrapped post-processing steps. The larger amount of water in the RT groups was driven by a greater amount of free volume in the network due to less β-sheet content (Figure 7). Microstructural defects originating from slower drying and greater stress in the network increased the free volume and promoted water diffusion into the fiber(Figure 3, 7, Table 1, 3).
The uniformity observed with strain suggests polymer-solvent interactions drive arrangement of secondary structure with fiber deformation (Figure 3, 7, Table 1, 3). These fiber properties with strain suggests there is a difference in the type of bound water in 60 °C versus RT groups (Figure 5–7). Previous work has reported bound water in the form of non-freezing and freezing bound, where non-freezing is tightly bound to β-sheet content in the form of hydrogen bonds and acts as a plasticizer 64,65 Therefore, the uniformity of β-sheet content coupled with significant change to 4th order orientation between 0 and 100% strain in 60 °C groups suggests there is more non-freezing bound water in the network (Figure 5–7). The higher non-freezing bound water enhances β-sheet alignment along the fiber axis with strain and exposes amorphous regions for water intake (Figure 6–7, Table 2–3).
Mechanical and dimensional tunability was achieved through process design. First, dimensional versatility was provided with casting solution in 1 mm or 1.98 mm inner diameter tubing, resulting in fiber diameters of 200–300 μm and 500–700 μm (Figure 8, A–B). Mechanical tunability was achieved through variables such as raw fiber degumming time to alter molecular weight 66, and fabrication drying rate which impacted β-sheet formation and microstructure (Figure S1, 8 C–D). The degumming time had the greatest effect on the ultimate strength of the fibers. Comparing high (10 md) and low (60 md) molecular weight ranges, the 10 md had improved ultimate tensile strength compared to 60 md in all conditions except the pre-autoclave post-treatments. The improved mechanics revealed with higher molecular weight (10 md) is attributed to chain entanglements that act as temporary cross-links. Although 10 and 60 md provided another means of tunability, 30 md was most impacted by post-processing treatments and therefore characterized further.
These mechanical properties were stable long-term due to the high β-sheet content (35–45%) in all fiber groups. RT pre-autoclave was the only group to reveal a significant difference in mechanical properties between 1 and 2 months (Figure S2B). Interestingly, the β-sheet content of this group was the lowest at 0% strain compared to all other 60 °C and RT processing treatments (Table 3).
This new silk hydrogel microfiber platform provides a versatile fiber system with tunable mechanical and dimensional features. The tunability of mechanical properties through fabrication and post-treatment manipulation provides a promising method for bottom-up scaffold approaches, textile design and composite combinations. Further, since the methods described are generally amenable to biological functions, embedding bioactive components into the fibers during fabrication, such as enzymes, cells, drug, allow for functionalization during fabrication of devices from these fibers.
Supplementary Material
Figure S1. Fiber tunability is revealed through examining mechanical properties of two extreme extraction times 10md and 60 md. Tensile modulus, ultimate strain, and ultimate strength measurements are reported for both extraction times. One-way ANOVA with a post-hoc Tukey test (A, B, C) were performed and p<0.05 was determined statistically significant. **** p<0.0001, *** p<0.0005, ** p< 0.005, * p<0.05. For all groups N=3.
Figure S2. Stability of fiber mechanics at 0, 1, and 2 months for each drying rate (60°C or RT) and post-treatment. Post-treatments above refer to no post-treatment (control), autoclave or methanol treatment prior to sample placement in DI water to reach swelling equilibrium (pre-autoclave, pre-methanol), autoclave or methanol treatment after sample reaches equilibrium (post-autoclave, post-methanol). For all groups N=3, *p<0.05.
Acknowledgments
We thank the NIH (U01EB014976, R01NS092847), the NSF (DGE-1144591, DMR-1608125), and DoD (AFIRM, AFOSR -FA9550-14-1-0015, DTRA) for support of this research.
We thank Dave Thomas for assistance with TGA.
References
- 1.Onoe H, Takeuchi S. Cell-laden microfibers for bottom-up tissue engineering. Drug Discov Today. 2015;20(2):236–246. doi: 10.1016/j.drudis.2014.10.018. [DOI] [PubMed] [Google Scholar]
- 2.Tamayol A, Najafabadi AH, Aliakbarian B, et al. Hydrogel Templates for Rapid Manufacturing of Bioactive Fibers and 3D Constructs. Adv Healthc Mater. 2015;4(14):2146–2153. doi: 10.1002/adhm.201500492. [DOI] [PMC free article] [PubMed] [Google Scholar]
- 3.Hirayama K, Okitsu T, Teramae H, Kiriya D, Onoe H, Takeuchi S. Cellular building unit integrated with microstrand-shaped bacterial cellulose. Biomaterials. 2013;34(10):2421–2427. doi: 10.1016/j.biomaterials.2012.12.013. [DOI] [PubMed] [Google Scholar]
- 4.Kinahan ME, Filippidi E, K??ster S, et al. Tunable silk: Using microfluidics to fabricate silk fibers with controllable properties. Biomacromolecules. 2011;12(5):1504–1511. doi: 10.1021/bm1014624. [DOI] [PMC free article] [PubMed] [Google Scholar]
- 5.Zuo Y, He X, Yang Y, et al. Microfluidic-based generation of functional microfibers for biomimetic complex tissue construction. Acta Biomater. 2016;38:153–162. doi: 10.1016/j.actbio.2016.04.036. [DOI] [PubMed] [Google Scholar]
- 6.Chae SK, Kang E, Khademhosseini A, Lee SH. Micro/nanometer-scale fiber with highly ordered structures by mimicking the spinning process of silkworm. Adv Mater. 2013;25(22):3071–3078. doi: 10.1002/adma.201300837. [DOI] [PubMed] [Google Scholar]
- 7.Tamayol A, Akbari M, Annabi N, Paul A, Khademhosseini A, Juncker D. Fiber-based tissue engineering: Progress, challenges, and opportunities. Biotechnol Adv. 2013;31(5):669–687. doi: 10.1016/j.biotechadv.2012.11.007. [DOI] [PMC free article] [PubMed] [Google Scholar]
- 8.Mandal BB, Kundu SC. Biospinning by silkworms: Silk fiber matrices for tissue engineering applications. Acta Biomater. 2010;6(2):360–371. doi: 10.1016/j.actbio.2009.08.035. [DOI] [PubMed] [Google Scholar]
- 9.Schiffman JD, Schauer CL. A Review: Electrospinning of Biopolymer Nanofibers and their Applications. Polym Rev. 2008;48(2):317–352. doi: 10.1080/15583720802022182. [DOI] [Google Scholar]
- 10.Lee KB, Lee S, Shin S, et al. On the Fly. Continuous Generation of Alginate Fibers Using a Microfluidic Device. 2015 Oct;1:9104–9108. doi: 10.1021/la700818q. [DOI] [PubMed] [Google Scholar]
- 11.Chen JL, Yin Z, Shen WL, et al. Efficacy of hESC-MSCs in knitted silk-collagen scaffold for tendon tissue engineering and their roles. Biomaterials. 2010;31(36):9438–9451. doi: 10.1016/j.biomaterials.2010.08.011. [DOI] [PubMed] [Google Scholar]
- 12.Jin H, Fridrikh SV, Rutledge GC, Kaplan DL. Electrospinning Bombyx mori Silk with Poly (ethylene oxide) 2002:1233–1239. doi: 10.1021/bm025581u. [DOI] [PubMed] [Google Scholar]
- 13.Peh RF, Suthikum V, Goh CH, Toh SL. Novel Electrospun-Knitted Silk Scaffolds for Ligament Tissue Engineering. World Congr Med Phys Biomed Eng 2006. 2007;14(Pts 1–6) 14:3287–3290\n4219. <Go to ISI>://000260855901313. [Google Scholar]
- 14.Sahoo S, Lok Toh S, Hong Goh JC. PLGA nanofiber-coated silk microfibrous scaffold for connective tissue engineering. J Biomed Mater Res – Part B Appl Biomater. 2010;95(1):19–28. doi: 10.1002/jbm.b.31678. [DOI] [PubMed] [Google Scholar]
- 15.Vepari C, Kaplan DL. Silk as a biomaterial. Prog Polym Sci. 2007;32(8–9):991–1007. doi: 10.1016/j.progpolymsci.2007.05.013. [DOI] [PMC free article] [PubMed] [Google Scholar]
- 16.Wang M, Jin H-J, Kaplan DL, Rutledge GC. Mechanical Properties of Electrospun Silk Fibers. Macromolecules. 2004;37(18):6856–6864. doi: 10.1021/ma048988v. [DOI] [Google Scholar]
- 17.Wang M, Yu JH, Kaplan DL, Rutledge GC. Production of submicron diameter silk fibers under benign processing conditions by two-fluid electrospinning. Macromolecules. 2006;39(3):1102–1107. doi: 10.1021/ma0517749. [DOI] [Google Scholar]
- 18.Wei W, Zhang Y, Zhao Y, Shao H, Hu X. Studies on the post-treatment of the dry-spun fibers from regenerated silk fibroin solution: Post-treatment agent and method. Mater Des. 2012;36:816–822. doi: 10.1016/j.matdes.2011.01.060. [DOI] [Google Scholar]
- 19.Zhang F, Zuo B, Fan Z, et al. Mechanisms and control of silk-based electrospinning. Biomacromolecules. 2012;13(3):798–804. doi: 10.1021/bm201719s. [DOI] [PMC free article] [PubMed] [Google Scholar]
- 20.Luo J, Zhang Y, Huang Y, Shao H, Hu X. A bio-inspired microfluidic concentrator for regenerated silk fibroin solution. Sensors Actuators, B Chem. 2012;162(1):435–440. doi: 10.1016/j.snb.2011.12.093. [DOI] [Google Scholar]
- 21.Pins GD, Christiansen DL, Patel R, Silver FH. Self-assembly of collagen fibers. Influence of fibrillar alignment and decorin on mechanical properties. Biophys J. 1997 Oct;73:2164–2172. doi: 10.1016/S0006-3495(97)78247-X. [DOI] [PMC free article] [PubMed] [Google Scholar]
- 22.Berry SM, Warren SP, Hilgart DA, et al. Endothelial cell scaffolds generated by 3D direct writing of biodegradable polymer microfibers. Biomaterials. 2011;32(7):1872–1879. doi: 10.1016/j.biomaterials.2010.11.023. [DOI] [PubMed] [Google Scholar]
- 23.Gupta B, Revagade N. Development and structural evaluation of poly (lactic acid) based knitted scaffold for human urinary bladder reconstruction. 2009 Jun;34:115–121. [Google Scholar]
- 24.Sahoo S, Toh SL, Goh JCH. A bFGF-releasing silk/PLGA-based biohybrid scaffold for ligament/tendon tissue engineering using mesenchymal progenitor cells. Biomaterials. 2010;31(11):2990–2998. doi: 10.1016/j.biomaterials.2010.01.004. [DOI] [PubMed] [Google Scholar]
- 25.Moutos FT, Guilak F. Composite scaffolds for cartilage tissue engineering. Biorheology. 2008;45(3–4):501–512. doi: 10.3233/BIR-2008-0491. [DOI] [PMC free article] [PubMed] [Google Scholar]
- 26.Rentsch B, Hofmann A, Breier A, Rentsch C, Scharnweber D. Embroidered and surface modified polycaprolactone-co-lactide scaffolds as bone substitute: In vitro characterization. Ann Biomed Eng. 2009;37(10):2118–2128. doi: 10.1007/s10439-009-9731-0. [DOI] [PubMed] [Google Scholar]
- 27.Pulliainen O, Vasara AI, Hyttinen MM, et al. Poly-L-D-lactic acid scaffold in the repair of porcine knee cartilage lesions. Tissue Eng. 2007;13(6):1347–1355. doi: 10.1089/ten.2006.0347. [DOI] [PubMed] [Google Scholar]
- 28.Cuadros TR, Skurtys O, Aguilera JM. Mechanical properties of calcium alginate fibers produced with a microfluidic device. Carbohydr Polym. 2012;89(4):1198–1206. doi: 10.1016/j.carbpol.2012.03.094. [DOI] [PubMed] [Google Scholar]
- 29.He Y, Zhang N, Gong Q, et al. Alginate/graphene oxide fibers with enhanced mechanical strength prepared by wet spinning. Carbohydr Polym. 2012;88(3):1100–1108. doi: 10.1016/j.carbpol.2012.01.071. [DOI] [Google Scholar]
- 30.Hu M, Deng R, Schumacher KM, et al. Hydrodynamic spinning of hydrogel fibers. Biomaterials. 2010;31(5):863–869. doi: 10.1016/j.biomaterials.2009.10.002. [DOI] [PubMed] [Google Scholar]
- 31.Hu X, Lu L, Xu C, Li X. Mechanically tough biomacromolecular IPN hydrogel fibers by enzymatic and ionic crosslinking. Int J Biol Macromol. 2015;72:403–409. doi: 10.1016/j.ijbiomac.2014.08.043. [DOI] [PubMed] [Google Scholar]
- 32.Jun Y, Kang E, Chae S, Lee S-H. Microfluidic spinning of micro- and nano-scale fibers for tissue engineering. Lab Chip. 2014;14(13):2145–2160. doi: 10.1039/c3lc51414e. [DOI] [PubMed] [Google Scholar]
- 33.Lee BR, Lee KH, Kang E, Kim DS, Lee SH. Microfluidic wet spinning of chitosan-alginate microfibers and encapsulation of HepG2 cells in fibers. Biomicrofluidics. 2011;5(2):1–9. doi: 10.1063/1.3576903. [DOI] [PMC free article] [PubMed] [Google Scholar]
- 34.Sakai S, Liu Y, Mah EJ, Taya M. Horseradish peroxidase/catalase-mediated cell-laden alginate-based hydrogel tube production in two-phase coaxial flow of aqueous solutions for filament-like tissues fabrication. Biofabrication. 2013;5(1):15012. doi: 10.1088/1758-5082/5/1/015012. [DOI] [PubMed] [Google Scholar]
- 35.Jun Y, Kang AR, Lee JS, et al. 3D co-culturing model of primary pancreatic islets and hepatocytes in hybrid spheroid to overcome pancreatic cell shortage. Biomaterials. 2013;34(15):3784–3794. doi: 10.1016/j.biomaterials.2013.02.010. [DOI] [PubMed] [Google Scholar]
- 36.Zhang S, Liu X, Barreto-Ortiz SF, et al. Creating polymer hydrogel microfibres with internal alignment via electrical and mechanical stretching. Biomaterials. 2014;35(10):3243–3251. doi: 10.1016/j.biomaterials.2013.12.081. [DOI] [PMC free article] [PubMed] [Google Scholar]
- 37.Lee KH, Shin SJ, Kim C-B, et al. Microfluidic synthesis of pure chitosan microfibers for bio-artificial liver chip. Lab Chip. 2010;10(10):1328–1334. doi: 10.1039/b924987g. [DOI] [PubMed] [Google Scholar]
- 38.Oh J, Kim K, Won SW, et al. Microfluidic fabrication of cell adhesive chitosan microtubes. Biomed Microdevices. 2013;15(3):465–472. doi: 10.1007/s10544-013-9746-z. [DOI] [PMC free article] [PubMed] [Google Scholar]
- 39.Yamada M, Utoh R, Ohashi K, et al. Controlled formation of heterotypic hepatic micro-organoids in anisotropic hydrogel microfibers for long-term preservation of liver-specific functions. Biomaterials. 2012;33(33):8304–8315. doi: 10.1016/j.biomaterials.2012.07.068. [DOI] [PubMed] [Google Scholar]
- 40.Capretto L, Mazzitelli S, Zhang X, Nastruzzi C. Preparation of Alginate Microfibers for Cell Entrapment Using a Microfludic Device. 2010 Oct;:2029–2031. [Google Scholar]
- 41.Liu Y, Sakai S, Taya M. Production of endothelial cell-enclosing alginate-based hydrogel fibers with a cell adhesive surface through simultaneous cross-linking by horseradish peroxidase-catalyzed reaction in a hydrodynamic spinning process. J Biosci Bioeng. 2012;114(3):353–359. doi: 10.1016/j.jbiosc.2012.04.018. [DOI] [PubMed] [Google Scholar]
- 42.Onoe H, Okitsu T, Itou A, et al. Metre-long cell-laden microfibres exhibit tissue morphologies and functions. Nat Mater. 2013;12(6):584–590. doi: 10.1038/nmat3606. [DOI] [PubMed] [Google Scholar]
- 43.Onoe H, Gojo R, Tsuda Y, Kiriya D, Takeuchi S. Core-shell gel wires for the construction of large area heterogeneous structures with biomaterials. Proc IEEE Int Conf Micro Electro Mech Syst. 2010:248–251. doi: 10.1109/MEMSYS.2010.5442518. [DOI] [Google Scholar]
- 44.Pham UHT, Hanif M, Asthana A, Iqbal SM. A microfluidic device approach to generate hollow alginate microfibers with controlled wall thickness and inner diameter. J Appl Phys. 2015;117(21) doi: 10.1063/1.4919361. [DOI] [Google Scholar]
- 45.Raof NA, Padgen MR, Gracias AR, Bergkvist M, Xie Y. One-dimensional self-assembly of mouse embryonic stem cells using an array of hydrogel microstrands. Biomaterials. 2011;32(20):4498–4505. doi: 10.1016/j.biomaterials.2011.03.011. [DOI] [PMC free article] [PubMed] [Google Scholar]
- 46.Onoe H, Gojo R, Matsunaga Y, et al. Living cell fabric. Proc IEEE Int Conf Micro Electro Mech Syst. 2011:908–911. doi: 10.1109/MEMSYS.2011.5734573. [DOI] [Google Scholar]
- 47.Hu M, Kurisawa M, Deng R, et al. Cell immobilization in gelatin-hydroxyphenylpropionic acid hydrogel fibers. Biomaterials. 2009;30(21):3523–3531. doi: 10.1016/j.biomaterials.2009.03.004. [DOI] [PubMed] [Google Scholar]
- 48.Viney C, Llorca J, Elices M, Pe J. Mechanical Properties of Single-Brin Silkworm Silk. 1999:1270–1277. [Google Scholar]
- 49.Cunniff Philip M, Fossey Stephen A, Auerback Margaret A, Song John W, Kaplan David L, Adams W Wade, Eby Ronald K, David Mahoney DLV. Mechanical and thermal properties of dragline silk from the spider Nephila clavipes. Polym Adv Technol. 1994;5:401–410. [Google Scholar]
- 50.Reddy N, Yang Y. Structure and properties of cocoons and silk fibers produced by Hyalophora cecropia. J Mater Sci. 2010;45(16):4414–4421. doi: 10.1007/s10853-010-4523-3. [DOI] [Google Scholar]
- 51.Acharya C, Ghosh SK, Kundu SC. Silk fibroin protein from mulberry and non-mulberry silkworms: Cytotoxicity, biocompatibility and kinetics of L929 murine fibroblast adhesion. J Mater Sci Mater Med. 2008;19(8):2827–2836. doi: 10.1007/s10856-008-3408-3. [DOI] [PubMed] [Google Scholar]
- 52.Cao Y, Wang B. Biodegradation of silk biomaterials. Int J Mol Sci. 2009;10(4):1514–1524. doi: 10.3390/ijms10041514. [DOI] [PMC free article] [PubMed] [Google Scholar]
- 53.Martel A, Burghammer M, Davies RJ, Di Cola E, Vendrely C, Riekel C. Silk Fiber Assembly Studied by Synchrotron Radiation SAXS/WAXS and Raman Spectroscopy Silk Fiber Assembly Studied by Synchrotron Radiation SAXS/WAXS and Raman Spectroscopy. 2008;(20):17070–17074. doi: 10.1021/ja806654t. [DOI] [PubMed] [Google Scholar]
- 54.Tanaka T, Kobayashi M, Inoue SI, Tsuda H, Magoshi J. Biospinning: Change of water contents in drawn silk. J Polym Sci Part B Polym Phys. 2003;41(3):274–280. doi: 10.1002/polb.10377. [DOI] [Google Scholar]
- 55.Ha SW, Tonelli AE, Hudson SM. Structural studies of Bombyx mori silk fibroin during regeneration from solutions and wet fiber spinning. Biomacromolecules. 2005;6(3):1722–1731. doi: 10.1021/bm050010y. [DOI] [PubMed] [Google Scholar]
- 56.Trabbic K, Yager P. Comparative Structural Characterization of Naturally- and Synthetically-Spun Fibers of Bombyx mori Fibroin. Macromolecules. 1998;31(97):462–471. doi: 10.1021/ma9708860. [DOI] [Google Scholar]
- 57.Partlow BP, Hanna CW, Rnjak-Kovacina J, et al. Highly tunable elastomeric silk biomaterials. Adv Funct Mater. 2014;24(29):4615–4624. doi: 10.1002/adfm.201400526. [DOI] [PMC free article] [PubMed] [Google Scholar]
- 58.Rockwood DDN, Preda RRC, Yücel T, Wang X, Lovett ML, Kaplan DL. Materials fabrication from Bombyx mori silk fibroin. Nat Protoc. 2011;6(10):1–43. doi: 10.1038/nprot.2011.379.Materials. [DOI] [PMC free article] [PubMed] [Google Scholar]
- 59.Viney C, Llorca J, Elices M. Mechanical properties of silkworm silk in liquid media. 2000;41:8433–8439. [Google Scholar]
- 60.Kaplan Hu X, Cebe DP. Determining Beta-Sheet Crystallinity in Fibrous Proteins by Thermal Analysis and Infrared Spectroscopy. 2006:6161–6170. [Google Scholar]
- 61.George KA, Shadforth AMA, Chirila TV, et al. Effect of the sterilization method on the properties of Bombyx mori silk fibroin films. Mater Sci Eng C. 2013;33(2):668–674. doi: 10.1016/j.msec.2012.10.016. [DOI] [PubMed] [Google Scholar]
- 62.Kim UJ, Park J, Li C, Jin HJ, Valluzzi R, Kaplan DL. Structure and properties of silk hydrogels. Biomacromolecules. 2004;5(3):786–792. doi: 10.1021/bm0345460. [DOI] [PubMed] [Google Scholar]
- 63.Pritchard EM, Hu X, Finley V, Kuo CK, Kaplan DL. Effect of Silk Protein Processing on Drug Delivery from Silk Films. Macromol Biosci. 2013;13(3):311–320. doi: 10.1002/mabi.201200323. [DOI] [PMC free article] [PubMed] [Google Scholar]
- 64.Lee K, Ha W. DSC Studies on Bound Water in Silk fibroin/S-Carboxymethyl Kerateine Blend Films. 1999;40 doi: 10.1016/S0032-3861(98)00611-9. [DOI] [Google Scholar]
- 65.Hu X, Kaplan D, Cebe P. Effect of water on the thermal properties of silk fibroin. Thermochim Acta. 2007;461(1):137–144. doi: 10.1016/j.tca.2006.12.011. [DOI] [Google Scholar]
- 66.Wray LS. 1, Hu, Xiao1Gallego, Jabier1Georgakoudi, Irene1Omenetto, Fiorenzo G.1Schmidt D, Kaplan DL, 1. NIH Public Access. 2012:1–23. doi: 10.1002/jbm.b.31875.Effect. [DOI] [Google Scholar]
- 67.Zarzycki J, Prassas M, Phalippou J. Synthesis of glasses from gels: the problem of monolithic gels. J Mater Sci. 1982;17(11):3371–3379. doi: 10.1007/BF01203507. [DOI] [Google Scholar]
- 68.Hofmann S, Stok KS, Kohler T, Meinel AJ, M??ller R. Effect of sterilization on structural and material properties of 3-D silk fibroin scaffolds. Acta Biomater. 2014;10(1):308–317. doi: 10.1016/j.actbio.2013.08.035. [DOI] [PubMed] [Google Scholar]
Associated Data
This section collects any data citations, data availability statements, or supplementary materials included in this article.
Supplementary Materials
Figure S1. Fiber tunability is revealed through examining mechanical properties of two extreme extraction times 10md and 60 md. Tensile modulus, ultimate strain, and ultimate strength measurements are reported for both extraction times. One-way ANOVA with a post-hoc Tukey test (A, B, C) were performed and p<0.05 was determined statistically significant. **** p<0.0001, *** p<0.0005, ** p< 0.005, * p<0.05. For all groups N=3.
Figure S2. Stability of fiber mechanics at 0, 1, and 2 months for each drying rate (60°C or RT) and post-treatment. Post-treatments above refer to no post-treatment (control), autoclave or methanol treatment prior to sample placement in DI water to reach swelling equilibrium (pre-autoclave, pre-methanol), autoclave or methanol treatment after sample reaches equilibrium (post-autoclave, post-methanol). For all groups N=3, *p<0.05.