

Summary
Pima Indians have the highest incidence of insulin resistance (IR) and type-2 diabetes mellitus (T2DM) of any reported population, but the pathophysiologic mechanism is unknown. Genetic studies in Pima Indians have linked ACAD10 gene polymorphisms, among others, to this predisposition. The gene codes for a protein with a C-terminus region that is structurally similar to members of a family of flavoenzymes, the acyl-CoA dehydrogenases (ACADs), that catalyze α,β-dehydrogenation reactions, including the first step in mitochondrial fatty acid oxidation (FAO), and intermediary reactions in amino acids catabolism. Dysregulation of FAO and an increase in plasma acylcarnitines are recognized as important in the pathophysiology of IR and T2DM. To investigate the deficiency of ACAD10 as a monogenic risk factor for T2DM in human, an Acad deficient mouse was generated and characterized. The deficient mice exhibit an abnormal glucose tolerance test and elevated insulin levels. Blood acylcarnitine analysis shows an increase in long-chain species in the older mice. Non-specific variable pattern of elevated short terminal branch-chain acylcarnitines in a variety of tissues was also observed. Acad10 mice accumulate excess abdominal adipose tissue, develop an early inflammatory liver process, and exhibit fasting rhabdomyolysis and have abnormal skeletal muscle mitochondria. Our results identify Acad10 as a genetic determinant of T2DM in mice and provide a model to further investigate genetic determinants for insulin resistence in humans.
Keywords: ACAD10, type 2 diabetes mellitus, acyl-coA dehydrogenases, Pima Indians, Recurrent rhabdomyolysis
Introduction
In the last half of the 20th century, the incidence of T2DM, previously unrecognized in the Pima Indians, began to rise. Multiple factors were postulated to be responsible including environmental and genetic factors (Lillioja et al 1993, Prochazka et al 1993, Pratley 1998, Bennett 1999, Valencia et al 1999, Baier and Hanson 2004). ACAD10 was one of 30 genes further examined after demonstrating a significant signal for diabetes in a genome-wide association study (GWAS). In these studies, a single nucleotide polymorphism (SNP), rs632650, was found to map within intron 2 of ACAD10 (Bian et al 2010). The ACAD10 protein C-terminus region, ~400 amino acids, is homologous to the acyl-CoA dehydrogenases (ACADs) family of mitochondrial flavoproteins that catalyze the α,β-dehydrogenation of various acyl-CoA substrates (Swigoňová et al 2009). At least five ACADs catalyze the α,β-dehydrogenation of fatty acids acyl-CoA esters, the first step in mitochondrial fatty acid oxidation. Four other ACADs are involved amino acid catabolism, utilizing various branched-chain acyl-CoA substrates. While ACAD10 was reported to have weak activity towards the branched-chain substrates R and S, 2-methyl-C15-CoA and is highly expressed in fetal but not adult brain (He et al 2011), its physiological role remains unknown.
Skeletal muscle patterns of fatty acid utilization during fasting have been shown to be associated with obesity-related insulin resistance and altered mitochondrial energy metabolism. These abnormalities have also been shown to be present in the context of T2DM (Kelley et al 1999, Adams et al 2009, Goodpaster 2013, Aguer et al 2015). It has also been shown that the pattern of acylcarnitines (ACNs), key alternate metabolic intermediates of fatty acid oxidation (FAO), in the blood of obese and T2DM participants fall into two distinct patterns (Mihalik et al 2010). First, the T2DM and obese participants had similar accumulation of long-chain ACNs that arise from activity in the initial rounds of β-oxidation, consistent with reduced capacity to handle an increased flux at entry into mitochondrial β-oxidation. Subjects with diabetes also displayed an accumulation of various shorter chain ACNs suggestive of inefficient FAO or interactions between β-oxidation and electron transport chain (ETC). They also showed an inability to efficiently switch from fat metabolism during insulin clamp, as reflected in their inability to lower their ACNs as effectively as either the lean or obese subjects (Mihalik et al 2010).
Pima Indians in the US have higher rates of T2DM than their counterparts in Mexico as well as the general US population, and genetic studies have identified a non-coding polymorphism in the ACAD10 gene (Bian, et al 2010), as possibly being causative. In this study, an Acad10 deficient mouse model was characterized to elucidate the physiologic role of ACAD10 gene product in intermediary metabolism and its hypothetical link to T2DM.
Materials and Methods
Generation of Mutant Mice
A heterozygote Acad10 gene trap knockout mouse model in a SvEv129/BL6 mixed background generated in a total genome knockout mouse project was purchased from Taconic Biosciences (Hudson, NY). Homozygous mice were viable and fertile. Genotyping was done by tail tipping, followed by PCR with primers designed to specifically amplify an Acad10 containing DNA fragment. Tissue expression was examined with primers across the predicted coding region of the gene and ACAD10 antigen presence (Figure 1). Wild type mice and homozygous mice lines were maintained by breeding to the same SvEv129/BL6 mixed background strain.
Figure 1.
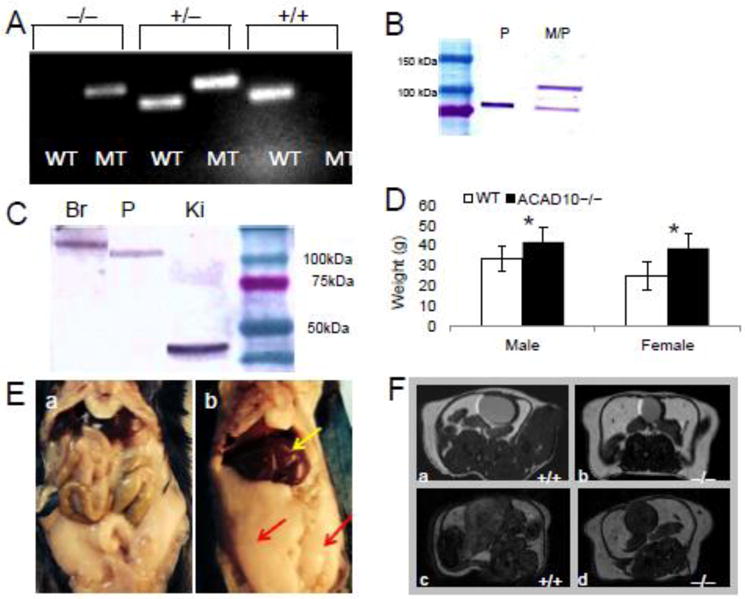
Clinical presentation of Acad10 deficiency in a mouse model. A. PCR genotyping of mutant animals. The larger fragment (195 bp) represents the mutant (MT) Acad10 allele and the smaller (154 bp) the wild type allele (WT). Wild type (+/+), heterozygous (+/−), or homozygous mutant (−/−) could be distinguished. B. Subcellular fractionation of wild type liver. Liver tissue was freshly harvested and a peroxisomal fraction (P) and a mixed peroxisomal/mitochondrial fraction (M/P) were prepared, separated by SDS-PAGE, transferred to a membrane, and visualized with ACAD10 antiserum. C. Western blot survey of ACAD10 in mouse brain, pancreas, and kidney. Western blot survey of ACAD10 in mouse tissue (pancreas, kidney and brain are shown) of a 4–15% SDS-PAGE gel. 100 μg of tissue extract were applied per lane. D. Acad10 deficient and wild type mice average body weight measured in grams (g). The difference between male wild type and mutant was statistically significant (two-tailed p-value=0.0006), as was the difference between the female genotypes (two-tailed p-value=0.0007). E. Intraabdominal fat accumulating in mutant mice. F. Micro-MRI imaging of ACAD10 mouse abdominal cavity. The Acad10 deficient mice show a significant increase in adipose accumulation over time as compared to wild type control mice of the same background. The top and bottom panels represent different coronal cross s
Characterization of Mutant Mice
Visual observations and weight measurements were performed to monitor health of wild type and Acad10 deficient mice over time. Food consumption was determined by weighing the consumed food ad libitum weekly over a period of 5 weeks. Diet was a standard mouse chow [LabDiet (St. Louis, MO) Isopro RMH 3000 with 6.8 % long chain fat]. In general, male mice were used for all experiments since they typically exhibit a more severe phenotype when fatty acid oxidation deficient. However, some experiments were conducted on females as indicated in the text to show that the phenotype was not specifically sex limited.
Abdominal micro-MRI was performed with a horizontal bore 7-T MRI system from Bruker Biospin, (Billerica, MA), 70/30 with full vital monitoring system to assess accumulation of adipose tissue content in wild type and Acad10 deficient mice.
Blood was collected for analysis in serum separator tubes by cheek-stick. Following standard lung perfusion techniques, Acad10 deficient mouse tissues from young male (approximately 10–12 weeks old) and older male (approximately 25–26 weeks old) mice were isolated following cervical dislocation and flash frozen in liquid nitrogen for metabolic analysis, or preserved in 2.5% glutaraldehyde, or 4% paraformaldehyde for histopathology (Pociask et al 2013). After fixation, organs were embedded in paraffin and 10 μm sections collected and stained with hematoxylin and eosin according to standard protocols. Gomori trichrome staining was performed on muscle tissue samples using standard techniques. Serum isolated from whole blood was used immediately for analysis or flash frozen. Light microscopy was performed in the Mouse Histology Core Laboratory at the Rangos Research Center, the Children’s Hospital of Pittsburgh of UPMC. Transmission electron microscopy was performed at the Center for Biologic Imaging at the University of Pittsburgh.
For immunohistochemical and immunofluorescent staining, tissues were harvested and immersed in fixative overnight as above. Immunohistochemical staining was performed by incubation overnight at with primary antibodies, followed by incubation for 1 hour with fluorescently labeled secondary antibodies as described previously (He et al 2011). Primary antibodies included an ACAD10 polyclonal antibody generated at Cocalico Biologicals, Inc., (Reamstown, PA), against a recombinant human His-tagged ACAD10 Q635-I1059 expressed and purified from Escherichia coli, anti-MTCO1 antibody as a mitochondrial marker from Abcam (Cambridge, MA), and catalase (N-17) from Santa Cruz Biotechnology, Inc., (Dallas, TX) as a marker for peroxisomes. Primary antibodies were used at dilutions of 1:500. Slides were analyzed using standard confocal microscopy technique.
For biochemical analysis, mouse tissues including heart, liver, lung, muscle, kidney, spleen, pancreas flash frozen in liquid nitrogen were extracted and derivatized with pentafluorophenacyl trifluoromethanesulfonate. ACNs profiling by UHPLC MS/MS was performed as previously described (Houten and Wanders 2010). Values were quantified using 13-point calibration curves. Creatine kinase and glucose levels were determined using a standard clinical laboratory MS/MS technique at the Division of Pediatric Pathology, Children’s Hospital of Pittsburgh. Acyl-CoA profiling on tissue samples were performed and analyzed for acyl-CoA species as previously described (Palladino et al 2012).
C-Reactive Protein and Insulin ELISA were performed in triplicate using Mouse Insulin ELISA & Mouse C-Reactive Protein ELISA kits from ALPCO Diagnostics, (Salem, NH). A panel of 23 cytokines was analyzed using a Luminex immunoassay kit from Thermo Fisher Scientific (Grand Island, NY).
Blue native gel electrophoresis (BN-PAGE) was performed as previously described (Graves et al 2012). Catalytic activity of complexes I and V was visualized on BN-PAGE as previously described (Van Coster et al 2001).
Intraperitoneal Glucose Tolerance Test (IPGTT) was performed as previously described (Rehman et al 2005). Briefly, animals were fasted for 5.5 hours and basal glucose levels were measured. Sterile filtered D-glucose was then injected IP at 2 g/kg body weight, and blood samples for glucose measurement were taken at times points 15, 30, 60, 90, and 120 min post injection. Glucose was analyzed using a handheld Precision Xtra glucometer from Abbott Diabetes Care, (Alameda, CA).
For immunoblotting, white adipose and muscle tissues were homogenized in 50 mM Tris, pH 7.4, 150 mM NaCl, 1% Triton X-100, 0.1% SDS containing protease inhibitors from Roche (Branchburg, NJ). Thirty micrograms of protein were resolved on precast gradient 4–12% SDS-PAGE, and then transferred to polyvinylidene fluoride membranes. The membranes were blocked with 5% non-fat dry milk in Tris-buffered saline with Tween 20 for 1 h. Proteins were visualized with primary antibodies (Akt, pAkt ser473 and GAPDH from Cell Signaling Technologies, Cambridge, MA) diluted in TBS-T containing 5% of BSA incubated overnight at 4°C, and secondary horseradish peroxidase-conjugated secondary antibodies for 1 h. Signals were detected using the SuperSignal West Dura extended duration substrate from Thermo Fisher Scientific.
RNA extraction for real time qPCR was performed on tissue samples using RNeasy Fibrous Tissue Mini Kit for muscle, and RNeasy Lipid Tissue Mini Kit for liver and fat from Qiagen (Valencia, CA). For cDNA synthesis for use with the RT2 Profiler™ PCR Array Mouse Insulin Signaling Pathway from Qiagen gene panel, RT2 First Strand Kit from Qiagen was used. For the detection of PEPCK, liver RNA was extracted using RNeasy purification kit from Qiagen. First-strand cDNA was synthesized from 500 ng RNA using AMV First Strand cDNA Synthesis Kit from New England Biolabs Inc. (Ipswich, MA). RT-PCR was carried out in 10 μl reaction using SYBR green fast master mix from Applied Biosystems, Thermo Fisher Scientific, containing 1 μl of the diluted (1:10) first-strand cDNA. PEPCK was amplified using primers: forward 5′-CTTCTCTGCCAAGGTCATCC-3′ and reverse 5′-TTTTGGGGATGGGCAC-3′ and the results were normalized to 36B4 (forward: 5′-AACTTTGGCATTGTGGAAGG-3′ and reverse: 5′-ACACATTGGGGGTAGGAACA-3′) using ‘delta delta Ct’ (ΔΔCt).
Mouse Open Field Testing
To examine the locomotor function and behaviors of mutant mice in a new environment, animals were placed for 30 minutes in an open-field chamber testing chamber (28 × 28 × 40 cm) with a floor divided into equal-sized square fields, and the frequency of a variety of behaviors was determined as described in the Supplemental Figure legends.
Statistics
Data are presented as mean ± SD for replicates and analyzed using unpaired Student’s t-test (VassarStats software; www.vassarstats.net). Statistical significance is indicated in figures by the following annotation: *p <0.05.
Results
Generation of Mutant Mice
Mutant mice incorporating a gene trap vector in the Acad10 gene bred well and had normal survival. The genotypes of Acad10 deficient and strain matched wild type animals were confirmed by PCR (Figure 1A). Subcellular fractionation and western blotting of wild type mouse liver extracts was performed. The ACAD10 antigen-purified antibody identified the predicted 119 kDa ACAD10 protein in a combined mitochondrial/peroxisomal (M/P) fraction plus a smaller size protein in a more purified peroxisomal fraction (P) (Figure 1B). However, various protein sizes were seen in different tissues from mutant animals, raising the possibility that this might be a hypomorphic model (Figure 1C). Although the purified recombinant His-tagged ACAD10 Q635-I1059 C-terminus region used to generate the antibody confirmed the α–β–α tertiary fold of the ACAD-homologous region since it exhibited a visible-UV spectrum characteristic of a bound flavin, attempts to express and purify a recombinant form of the full 1059-amino acid protein were unsuccessful.
Characterization of mutant mice
ACAD10 Deficient Mice Become Obese with Age
Acad10 deficient animals exhibited excess weight gain compared to wild type control animals that became more pronounced with age (Figure 1D). This finding was seen in both males and females. Pathologic evaluation and micro-magnetic resonance imaging demonstrated greater accumulation of white adipose tissue in deficient mice, especially abdominal subcutaneous and visceral fat (Figure 1E and F). Using micro-MRI, Acad10 mice displayed excess adipose tissue at 2–3 months (Figure 1F, b) progressing to a more significant increase at 7–8 months (Figure 1F, d), as compared to wild type mice (Figure 1F, a and c, respectively). Both male and female Acad10 deficient mice demonstrated similar patterns and amounts of food consumption compared to controls, indicating that hyperphagia is not a significant factor (Supplemental Figure 1A). To evaluate for movement differences in mutant animals, open field testing was performed on mutant wild type mice. Overall, mutant animals demonstrated smaller measures of movement, consistent with animal hypoactivity (Supplemental Figure 2B and C).
Histopathology
A complete pathologic survey was performed on Acad10 deficient mouse tissues from young male (approximately 10–12 weeks old) and older male (approximately 25–26 weeks old) mice. Similar findings were seen in both ages. Hematoxylin and eosin staining revealed morphological abnormalities in deficient mice age 25–26 weeks (Supplemental Figure 2A), including small multifocal necroinflammatory lesions and early abscess formation in liver parenchyma (b), and extramedullary hematopoiesis with prominent megakaryocytes in spleen (c). Transmission electron microscopy (Supplemental Figure 2B) of wild type mouse liver (a), and skeletal muscle from the hind leg (c) was unremarkable, while Acad10 deficient liver (b) and muscle (d) showed subtle abnormalities with minimal accumulation of lipid droplets and occasional enlarged mitochondria. Alkaline phosphatase, Gomori trichrome, and NADH dehydrogenase staining was performed on wild type and mutant muscle tissues (Supplemental Figure 2C). Alkaline phosphatase staining showed peripheral nuclei indicative of chronic damage (a and b), Gomori trichrome staining demonstrated an increase in fat accumulation in deficient animals (c and d), and NADH dehydrogenase staining showed an increased number of poorly staining muscle fibers (e and f).
ACAD10 Tissue and Subcellular Localization
Immunohistochemical staining demonstrated the presence of ACAD10 antigen in mitochondria of muscle and kidney (Supplemental Figure 3A). ACAD10 signal was detected in mitochondria and peroxisomes of the lung and pancreas but was restricted to mitochondria in muscle and kidney (Supplemental Figure 3B).
Biochemical Phenotype
Recurrent rhabdomyolysis, especially under conditions of physiologic stress and fasting, is a common clinical finding in ACAD deficiencies in humans and is felt to reflect energy deficit (Vockley et al 2015). Acad10 deficient mice showed a dramatic increase in phosphocreatine kinase (CPK) upon overnight fasting (Figure 2A). Acad10 deficient mice had normal levels of C-reactive protein (Figure 2B), and normal or reduced cytokine levels (Figure 2C). However, TNFα, a marker of inflammation, was increased in deficient animals (Figure 2, inset).
Figure 2.
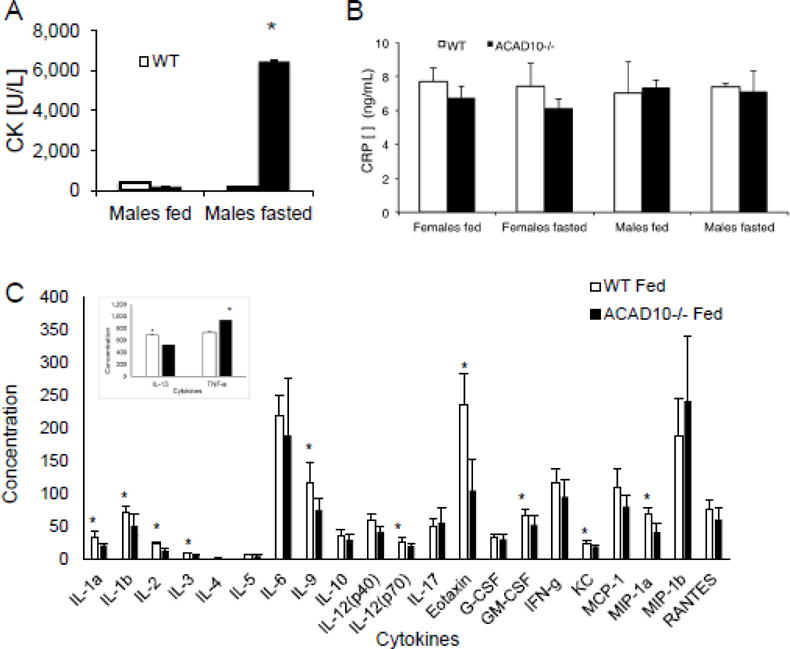
Acad10 deficient mice develop rhabdomyolysis with fasting. (A) Creatine kinase (CK) concentration in fasting Acad10 deficient male mice shows a statistically significant increase (3 animals were tested in each group, but the assays were performed only once due to the blood volume needed for the assay; two-tailed p-value=0.0135) compared with other fed and fasted animals at 8 months of age. Female animals had normal CK levels even when fasting. (B) C-reactive protein concentration in wild type and Acad10 deficient mice. Animals (~8 months old) were fed ad lib or food was removed from cages and blood was drawn after fasting overnight (~15 hours). The bars show the mean and standard deviation of 3 female mice and 3 male mice. CRP levels of each genotype and condition were compared to each other. Values between groups are not statistically significant, indicating lack of a generalize inflammation or infectious process in the Acad10 deficient animals. Each assay was performed in triplicate. (C) Cytokine levels in blood from wild type and Acad10 deficient male mice. Male animals were fed ad lib and blood was drawn. The bars show the mean and standard deviation of 7 male mice for each group. Cytokine levels of each genotype were compared to each other. Values between groups with an asterisk are statistically significant, indicating normal or reduced cytokine levels in the Acad10 deficient animals. The inset shows TNF-α and IL-13 levels. Note the different scale for the Y-axis. Female mice were not tested.
Acyl-CoA analysis of mouse blood and tissue extracts was performed using UHPLC linked to tandem mass spectrometry (Table 1) (Mihalik et al 2010, Michaliszyn et al 2012, Mihalik et al 2012, Palladino et al 2012). The overall pattern of metabolic abnormalities was similar to that seen in adult obese patients with T2DM (Table 1) (Adams et al 2009, Mihalik et al 2010). A variable pattern of elevated content of long-straight chain, and short, terminal branch chained acylcarnitines observed in a variety of tissues from Acad10 deficient animals failed to suggest the enzymatic function of ACAD10. The free acyl-CoA profile in liver extracts showed a minimally abnormal pattern with a predominance of short chain species (including some seen in ketosis), while muscle extract showed a mild increase of long-chain FAO intermediates (Table 1). In both liver and muscle, a novel pattern of elevated 3-hydroxy-short chain dicarboxylic acid species was observed, which was unique to Acad10 deficiency (Table 1). Acyl-CoAs not presented in the table did not differ between wild type and mutant mice. Acylcarnitine profiling reflected the acyl-CoA results and are not presented.
Table 1.
Acyl-CoA levels in wild type and Acad10−/− mouse tissues
| Acyl-CoA species (nmol/gm tissue) |
Wild type (mean +/− SD) |
Acad10−/− (mean +/− SD) |
|---|---|---|
| Liver | ||
|
| ||
| Oxalyl CoA (C2-DC) | 1.35±0.84 | 2.73±2.24 |
| 3-Keto-C4-CoA | 2.39±1.90 | 4.70±3.13 |
| Succinyl CoA (C4-DC) | 1.01±0.55 | 2.00±0.67 |
| Glutaryl CoA (C5-DC) | 0.69±0.28 | 1.26±0.46 |
| 3-OH-C6-CoA | 0.49±0.06 | 0.68±0.36 |
| Adipoyl CoA (C8-DC) | 0.34±0.21 | 0.62±0.04 |
| 3-OH-C8-CoA | 0.61±0.46 | 1.08±0.64 |
| 3-OH-C10 CoA | 0.10±0.02 | 0.24±0.08 |
| Sebacyl CoA (C12-DC) | 0.10±0.02 | 0.15±0.04 |
| 3-OH-C12-CoA | 0.19±0.07 | 0.26±0.11 |
| 3-OH-C14-CoA | 0.23±0.19 | 0.57±0.77 |
| 3-OH-C20:1-CoA | 1.10±0.35 | 1.54±1.33 |
|
| ||
| Muscle | ||
|
| ||
| Glutaryl CoA (C5-DC) | 0.06±0.06 | 0.51±1.00 |
| C8:1 CoA | 0.10±0.08 | 0.19±0.16 |
| C10:2 CoA | 0.19±0.10 | 0.71±1.02 |
| Suberyl CoA (C10-DC) | 0.06±0.16 | 0.16±0.17 |
| C14:2 CoA | 0.05±0.01 | 0.19±0.11 |
| C14 CoA | 0.17±0.09 | 0.21±0.12 |
| C20:1 CoA | 0.14±0.07 | 0.23±0.08 |
| C20-DC CoA | 0.06±0.09 | 0.18±0.12 |
ACAD10 Deficient Mice Are Insulin Resistant and Glucose Intolerant
Because of their striking obesity, Acad10 mutant mice were evaluated for insulin resistance. Deficient animals showed higher insulin levels at both fed and fasting conditions (Figure 3A) with normal random glucose levels (Figure 3B) suggesting that Acad10 deficient mice are insulin resistant. Deficient male mice showed impaired glucose tolerance in an IPGTT test (Figure 3C). Akt2 phosphorylation was decreased in both muscle and white adipose tissue (Figure 3D) in Acad10 deficient mice, demonstrating impaired insulin signaling.
Figure 3.
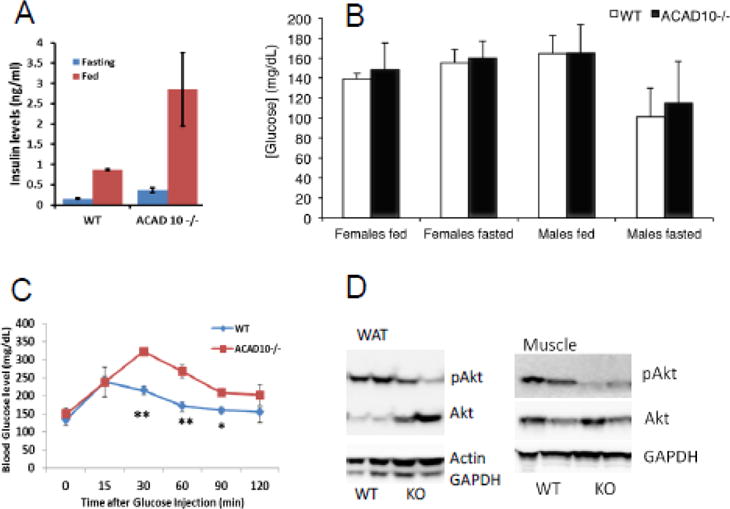
Acad10 deficient mice are insulin resistant. A. Insulin concentrations in male Acad10−/− mouse serum (n=3). The increased levels of insulin in fasting Acad10 knockout mice suggests insulin resistance in these mice. B. Glucose concentrations in wild type and Acad10−/− mouse serum. Animals (8 months old) were fed ad lib and random blood glucose measurements were taken. Food was then removed from cages and blood glucose levels were measured after overnight fasting (~15 hours). The bars show the mean and standard deviation of 3–4 female mice and 5–6 male mice. Glucose levels of each genotype and condition were compared to each other. While glucose concentration in fasted Acad10 deficient male mice was slightly higher than for wild type, the difference was not statistically significant using an unpaired t-test (two-tailed p-values). Acad10 deficient females had significantly higher glucose levels than wild type females. C. IPGTT on wild type and Acad10 deficient mice. The Acad10 deficient male mice show a statistically significant delay in glucose clearance (two-tailed p-value=0.0201 and 0.0122, respectively) at time 30 and 60 minutes as compared to wild type control mice of the same background. D. Insulin signaling in white adipose tissue and muscle from a male animal. The signaling pattern in white fat and muscles show a very similar pattern of high insulin resistance in peripheral tissues of the Acad10 deficient mice.
To further examine the insulin signaling pathway in the Acad10 deficient mice, an expression array panel of genes involved in insulin regulation and T2DM was tested for expression in fat, liver, muscle, and brain. Significant down regulation was seen in expression of Hnf1b, Glp1r, Hnf4a, Fbp1, and Aqp2 (Supplemental Table 1). Increased expression of PEPCK, a key enzyme for gluconeogenesis and an indicator of hepatic insulin sensitivity, was confirmed by real time PCR in Acad10 deficient mice (Supplemental Figure 4A).
Blue Native PAGE
Mitochondrial ETC abnormalities have previously been described in humans with obesity and T2DM (Kelley et al 1999, Mihalik et al 2010, Goodpaster 2013). To examine ETC function in Acad10 deficient mice, BN-PAGE was performed on heart, liver, muscle, and brain tissue (Supplemental Figure 4B). ETC complex I activity was elevated in liver, muscle, and brain from deficient animals, suggestive of mitochondrial proliferation. Complex V activity was elevated in heart, liver, and muscle, but decreased in brain, suggesting the possibility of yet unrecognized neurologic problems.
Discussion
The most interesting phenotype of Acad10 deficient mice is the development of impaired glucose tolerance, peripheral insulin resistance, and abnormal weight gain. In addition, they exhibit the classic features of an ACAD deficiency such as accumulation of metabolites consistent with abnormal mitochondrial metabolism and fasting induced rhabdomyolysis. The metabolite profile, the rhabdomyolysis, and histologic findings in muscle suggest impaired energy metabolism. In liver and muscle, there is a non-specific pattern of elevated short-chain 3-hydroxy-dicarboxylic acid common species in addition to novel ones unlike those seen in known ACAD deficiencies. Additionally, there is a non-specific variable pattern of elevated long-straight chain, and short terminal branch-chain ACNs in a variety of tissues. The significance of these abnormalities is unknown. An abnormal free acyl-CoA profile in liver with elevated short and medium chain acyl-CoAs, however, is not as consistent with impaired fatty acid oxidation, as it is to the metabolic phenotype as seen in obese T2DM patients (Kelley et al 1999, Mihalik et al 2010, Goodpaster 2013).
While mutant animals consumed the same amount of food as wild type animals, they exhibited considerably less movement in open field testing, presumably either due to weakness or muscle pain, which may explain the excessive weight gain. Analysis of insulin signaling pathways in the metabolically relevant tissues demonstrated decreased phosphorylation of Akt, one of the central mediators of the downstream insulin signaling pathway in both muscle and adipose tissue, as well as elevated expression level of PEPCK mRNA in the liver, a key regulatory enzyme of gluconeogenesis that is negatively regulated by insulin under normal circumstances. Insulin resistance seen in this model could be secondary to obesity as well as ectopic lipid accumulation, especially in skeletal muscle and liver (Mihalik et al 2010). Lipid accumulation in muscle and liver of Acad10 deficient animals along with impaired insulin sensitivity is consistent with observations that dysregulation of FAO is related to obesity and T2DM (Lowell and Shulman 2005). The association between increased adiposity (total body, visceral, or abdominal subcutaneous) and insulin resistance is well characterized (Lebovitz and Banerji 2005), and increased intra-myocellular lipid droplets has been shown to be a determinant of the insulin resistance in obese children and adolescents (Weiss et al 2003). Many pathophysiological mechanisms have been shown to contribute to insulin resistance in obesity including free fatty acids and cytokines released from the adipose tissue. Indeed, the Acad10 deficient mouse model did show an increase in the inflammatory marker TNFα in blood, which is an indicator of inflammation (Figure 2). Further analysis of the insulin signaling pathway and endoplasmic reticulum (ER) stress are necessary to unravel the specific abnormalities that contribute to impairment of insulin sensitivity in Acad10 deficient animals.
Fatty acids have multiple other functions besides cellular fuel for generating energy. Most notably, long-chain fatty acids constitute the scaffold for the synthesis of unsaturated complex fatty acids that are biologically active such as prostaglandins and leukotrienes that function in cellular signaling and regulation of inflammatory, immune, and other stress responses. ACAD10 may play a role in the metabolism of these compounds, whose metabolic pathways include acyl-CoA intermediates.
Modern day presentation of T2DM is overwhelmingly a lifestyle-associated disorder and is more strongly associated with nurture than nature. That said, the Pima Indians in America, are reported to have a 2–4 fold higher incidence of diabetes compared to the average American, and fivefold higher than Pima Indians in Mexico (Pratley 1998, Bennett 1999, Valencia et al 1999, Baier and Hanson 2004, Schulz, et al 2006). Thus it is clear that the T2DM is not solely related to ACAD10 dysfunction. Furthermore, it is not known how much the ACAD10 non-coding polymorphism found in the Pima Indians affects enzyme level or function. Nevertheless, our results add evidence supporting a link between ACAD10 dysfunction and T2DM. As in humans, it is likely that other genes and environmental factors contribute as well to the phenotype seen in these animals, a possibility that could further be evaluated by transferring the mutation into different mouse strains.
Finally, our results also provide clues to a possible clinical phenotype for ACAD10 deficiency in humans. We predict either early onset insulin resistant diabetes of the young, otherwise unexplained rhabdomyolysis, or both. Of note, both of these phenotypes can be seen independently in multiple genetic and metabolic disorders. Since many patients remain with an unrecognized genetic cause for their symptoms, in spite of complete evaluation for known causes, examination of this population for inactivating mutations in the ACAD10 gene becomes reasonable (Scalco et al 2015).
Supplementary Material
Synopsis.
ACAD10 is a monogenic cause of type 2 diabetes mellitus in mice.
Acknowledgments
Jonathan Franks and Ming Sun at the University of Pittsburgh’s Center for Biologic Imaging provided expertise in transmission electron microscopy. This work was supported in part by PHS Grant R01-DK 54936.
Abreviations
- ACADs
acyl-CoA dehydrogenases
- ACAD10
acyl-CoA dehydrogenase 10
- ACNs
acylcarnitines
- BN-PAGE
blue native polyacrylamide gel electrophoresis
- GWAS
genome-wide association study
- T2DM
type-2 diabetes mellitus
- FAO
fatty acids oxidation
Footnotes
All mouse experiments were approved by the University of Pittsburgh Animal Care and Use Committee
No conflicts of interest are declared
References
- Adams SH, Hoppel CL, Lok KH, Zhao L, Wong SW, Minkler PE, Hwang DH, Newman JW, Garvey WT. Plasma acylcarnitine profiles suggest incomplete long-chain fatty acid beta-oxidation and altered tricarboxylic acid cycle activity in type 2 diabetic African-American women. J Nutr. 2009;139(6):1073–1081. doi: 10.3945/jn.108.103754. [DOI] [PMC free article] [PubMed] [Google Scholar]
- Aguer C, McCoin CS, Knotts TA, Thrush AB, Ono-Moore K, McPherson R, Dent R, Hwang DH, Adams SH, Harper ME. Acylcarnitines: potential implications for skeletal muscle insulin resistance. FASEB J. 2015;29(1):336–345. doi: 10.1096/fj.14-255901. [DOI] [PMC free article] [PubMed] [Google Scholar]
- Baier LJ, Hanson RL. Genetic studies of the etiology of type 2 diabetes in Pima Indians: hunting for pieces to a complicated puzzle. Diabetes. 2004;53(5):1181–1186. doi: 10.2337/diabetes.53.5.1181. [DOI] [PubMed] [Google Scholar]
- Bennett PH. Type 2 diabetes among the Pima Indians of Arizona: an epidemic attributable to environmental change? Nutr Rev. 1999;57(5 Pt 2):S51–54. doi: 10.1111/j.1753-4887.1999.tb01788.x. [DOI] [PubMed] [Google Scholar]
- Bian L, Hanson RL, Muller YL, Ma L, Kobes S, Knowler WC, Bogardus C, Baier LJ. Variants in ACAD10 are associated with type 2 diabetes, insulin resistance and lipid oxidation in Pima Indians. Diabetologia. 2010;53(7):1349–1353. doi: 10.1007/s00125-010-1695-y. [DOI] [PMC free article] [PubMed] [Google Scholar]
- Goodpaster BH. Mitochondrial deficiency is associated with insulin resistance. Diabetes. 2013;62(4):1032–1035. doi: 10.2337/db12-1612. [DOI] [PMC free article] [PubMed] [Google Scholar]
- Graves JA, Wang Y, Sims-Lucas S, Cherok E, Rothermund K, Branca MF, Elster J, Beer-Stolz D, Van Houten B, Vockley J, Prochownik EV. Mitochondrial structure, function and dynamics are temporally controlled by c-Myc. PloS one. 2012;7(5):e37699. doi: 10.1371/journal.pone.0037699. [DOI] [PMC free article] [PubMed] [Google Scholar]
- He M, Pei Z, Mohsen A-W, Watkins P, Murdoch G, Van Veldhoven PP, Ensenauer R, Vockley J. Identification and characterization of new long chain Acyl-CoA dehydrogenases. Mol Genet Metab. 2011;102(4):418–429. doi: 10.1016/j.ymgme.2010.12.005. [DOI] [PMC free article] [PubMed] [Google Scholar]
- Houten SM, Wanders RJ. A general introduction to the biochemistry of mitochondrial fatty acid beta-oxidation. J Inherit Metab Dis. 2010;33(5):469–477. doi: 10.1007/s10545-010-9061-2. [DOI] [PMC free article] [PubMed] [Google Scholar]
- Kelley DE, Goodpaster B, Wing RR, Simoneau J-A. Skeletal muscle fatty acid metabolism in association with insulin resistance, obesity, and weight loss. Am J Physiol. 1999;277(6 Pt 1):E1130–1141. doi: 10.1152/ajpendo.1999.277.6.E1130. [DOI] [PubMed] [Google Scholar]
- Lebovitz HE, Banerji MA. Point: visceral adiposity is causally related to insulin resistance. Diabetes Care. 2005;28(9):2322–2325. doi: 10.2337/diacare.28.9.2322. [DOI] [PubMed] [Google Scholar]
- Lillioja S, Mott DM, Spraul M, Ferraro R, Foley JE, Ravussin E, Knowler WC, Bennett PH, Bogardus C. Insulin resistance and insulin secretory dysfunction as precursors of non-insulin-dependent diabetes mellitus. Prospective studies of Pima Indians. N Engl J Med. 1993;329(27):1988–1992. doi: 10.1056/NEJM199312303292703. [DOI] [PubMed] [Google Scholar]
- Lowell BB, Shulman GI. Mitochondrial dysfunction and type 2 diabetes. Science. 2005;307(5708):384–387. doi: 10.1126/science.1104343. [DOI] [PubMed] [Google Scholar]
- Michaliszyn SF, Sjaarda LA, Mihalik SJ, Lee S, Bacha F, Chace DH, De Jesus VR, Vockley J, Arslanian SA. Metabolomic profiling of amino acids and beta-cell function relative to insulin sensitivity in youth. J Clin Endocrinol Metab. 2012;97(11):E2119–2124. doi: 10.1210/jc.2012-2170. [DOI] [PMC free article] [PubMed] [Google Scholar]
- Mihalik SJ, Goodpaster BH, Kelley DE, Chace DH, Vockley J, Toledo FGS, DeLany JP. Increased levels of plasma acylcarnitines in obesity and type 2 diabetes and identification of a marker of glucolipotoxicity. Obesity. 2010;18(9):1695–1700. doi: 10.1038/oby.2009.510. [DOI] [PMC free article] [PubMed] [Google Scholar]
- Mihalik SJ, Michaliszyn SF, de las Heras J, Bacha F, Lee S, Chace DH, De Jesus VR, Vockley J, Arslanian SA. Metabolomic profiling of fatty acid and amino acid metabolism in youth with obesity and type 2 diabetes: evidence for enhanced mitochondrial oxidation. Diabetes Care. 2012;35(3):605–611. doi: 10.2337/DC11-1577. [DOI] [PMC free article] [PubMed] [Google Scholar]
- Palladino AA, Chen J, Kallish S, Stanley CA, Bennett MJ. Measurement of tissue acyl-CoAs using flow-injection tandem mass spectrometry: acyl-CoA profiles in short-chain fatty acid oxidation defects. Mol Genet Metab. 2012;107(4):679–683. doi: 10.1016/j.ymgme.2012.10.007. [DOI] [PMC free article] [PubMed] [Google Scholar]
- Pociask DA, Scheller EV, Mandalapu S, McHugh KJ, Enelow RI, Fattman CL, Kolls JK, Alcorn F. IL-22 is essential for lung epithelial repair following influenza infection. Am J Pathol. 2013;182(4):1286–1296. doi: 10.1016/j.ajpath.2012.12.007. [DOI] [PMC free article] [PubMed] [Google Scholar]
- Pratley RE. Gene-environment interactions in the pathogenesis of type 2 diabetes mellitus: lessons learned from the Pima Indians. Proc Nutr Soc. 1998;57(2):175–181. doi: 10.1079/pns19980029. [DOI] [PubMed] [Google Scholar]
- Prochazka M, Lillioja S, Tait JF, Knowler WC, Mott DM, Spraul M, Bennett PH, Bogardus C. Linkage of chromosomal markers on 4q with a putative gene determining maximal insulin action in Pima Indians. Diabetes. 1993;42(4):514–519. doi: 10.2337/diab.42.4.514. [DOI] [PubMed] [Google Scholar]
- Rehman KK, Wang Z, Bottino R, Balamurugan AN, Trucco M, Li J, Xiao X, Robbins PD. Efficient gene delivery to human and rodent islets with double-stranded (ds) AAV-based vectors. Gene Ther. 2005;12(17):1313–1323. doi: 10.1038/sj.gt.3302530. [DOI] [PubMed] [Google Scholar]
- Scalco RS, Gardiner AR, Pitceathly RD, Zanoteli E, Becker J, Holton JL, Houlden H, Jungbluth H, Quinlivan R. Rhabdomyolysis: a genetic perspective. Orphanet J Rare Dis. 2015;10(1):51. doi: 10.1186/s13023-015-0264-3. [DOI] [PMC free article] [PubMed] [Google Scholar]
- Schulz LO, Bennett PH, Ravussin E, Kidd JR, Kidd KK, Esparza J, Valencia ME. Effects of traditional and western environments on prevalence of type 2 diabetes in Pima Indians in Mexico and the US. Diabetes Care. 2006;29:1866–1871. doi: 10.2337/dc06-0138. [DOI] [PubMed] [Google Scholar]
- Swigoňová Z, Mohsen A-W, Vockley J. Acyl-CoA dehydrogenases: Dynamic history of protein family evolution. J Mol Evol. 2009;69(2):176–193. doi: 10.1007/s00239-009-9263-0. [DOI] [PMC free article] [PubMed] [Google Scholar]
- Valencia ME, Bennett PH, Ravussin E, Esparza J, Fox C, Schulz LO. The Pima Indians in Sonora, Mexico. Nutr Rev. 1999;57(5 Pt 2):S55–57. S57–58. doi: 10.1111/j.1753-4887.1999.tb01789.x. [DOI] [PubMed] [Google Scholar]
- Van Coster R, Smet J, George E, De Meirleir L, Seneca S, Van Hove J, Sebire G, Verhelst H, De Bleecker J, Van Vlem B, et al. Blue native polyacrylamide gel electrophoresis: a powerful tool in diagnosis of oxidative phosphorylation defects. Pediatr Res. 2001;50(5):658–665. doi: 10.1203/00006450-200111000-00020. [DOI] [PubMed] [Google Scholar]
- Vockley J, Marsden D, McCracken E, DeWard S, Barone A, Hsu K, Kakkis E. Long-term major clinical outcomes in patients with long chain fatty acid oxidation disorders before and after transition to triheptanoin treatment-A retrospective chart review. Mol Genet Metab. 2015;116(1–2):53–60. doi: 10.1016/j.ymgme.2015.06.006. [DOI] [PMC free article] [PubMed] [Google Scholar]
- Weiss R, Dufour S, Taksali SE, Tambortlane WV, Petersen KF, Bonadonna RC, Boselli L, Barbetta G, Alle K, Rife F, et al. Prediabetes in obese youth: a syndrome of impaired glucose tolerance, severe insulin resistance, and altered myocellular and abdominal fat partitioning. Lancet. 2003;362(9388):951–957. doi: 10.1016/S0140-6736(03)14364-4. [DOI] [PMC free article] [PubMed] [Google Scholar]
Associated Data
This section collects any data citations, data availability statements, or supplementary materials included in this article.