

SUMMARY
Blastocyst-derived embryonic stem cells (ESCs) and gonad-derived embryonic germ cells (EGCs) represent two classic types of pluripotent cell lines, yet their molecular equivalence remains incompletely understood. Here, we compare genome-wide methylation patterns between isogenic ESC and EGC lines to define epigenetic similarities and differences. Surprisingly, we find that sex rather than cell type drives methylation patterns in ESCs and EGCs. Cell fusion experiments further reveal that the ratio of X-chromosomes to autosomes dictates methylation levels, with female hybrids being hypomethylated and male hybrids being hypermethylated. We show that the X-linked MAPK phosphatase DUSP9 is upregulated in female compared to male ESCs, and its heterozygous loss in female ESCs leads to male-like methylation levels. Notably, male and female blastocysts are similarly hypomethylated, indicating that sex-specific methylation differences arise in culture. Collectively, our data demonstrate the epigenetic similarity of sex-matched ESCs and EGCs and identify DUSP9 as a regulator of female-specific hypomethylation.
Graphical abstract
INTRODUCTION
Pluripotent stem cell lines are typically derived from preimplantation embryos, yielding embryonic stem cells (ESCs), or from fetal germ cells, generating embryonic germ cells (EGCs) (Reik and Surani, 2015). Moreover, pluripotent stem cells can be produced from somatic cells upon forced expression of transcription factors, giving rise to induced pluripotent stem cells (iPSCs) (Takahashi and Yamanaka, 2006). While ESCs, EGCs and iPSCs are thought to be transcriptionally highly similar, EGCs exhibit epigenetic differences that have been suggested to reflect their origin from fetal germ cells. For example, EGCs derived from late-stage (E11.5–E12.5) germ cells show DNA hypomethylation at imprinted and non-imprinted genes, which mirrors epigenetic patterns in the fetal germline (Hajkova et al., 2010; Labosky et al., 1994; Popp et al., 2010; Tada et al., 1997). Furthermore, classic cell-cell fusion experiments between EGCs and somatic cells demonstrated loss of methylation at repetitive elements and imprinted loci in hybrids, suggesting that EGCs harbor dominant demethylation activity (Tada et al., 1997). Importantly, ESCs appear to lack this activity when fused to somatic cells (Tada et al., 2001). A recent study confirmed these findings and implicated TET1 in EGC-specific demethylation of imprinted genes in hybrids (Piccolo et al., 2013). However, a systematic comparison of global DNA methylation patterns between parental ESCs, EGCs and resultant hybrids has not yet been performed.
Accumulating evidence suggests that culture conditions can dramatically alter DNA methylation patterns in pluripotent cell lines (Ficz et al., 2013; Habibi et al., 2013; Hackett et al., 2013; Leitch et al., 2013). While ESC lines maintained in conventional culture media (“serum/LIF”) show normal methylation levels that globally resemble somatic tissues, exposure to both MAPK and GSK3 inhibitors in the presence of LIF (“2i/LIF”) triggers an up to 4-fold reduction of global methylation patterns and the concomitant acquisition of a more naïve pluripotent state (Ficz et al., 2013; Habibi et al., 2013; Leitch et al., 2013; Ying et al., 2008). 2i/LIF culture-induced demethylation reportedly involves direct transcriptional silencing of the de novo methyltransferase genes Dnmt3a and Dnmt3b as well as transcriptional upregulation of the dioxygenase genes Tet1 and Tet2 by the pluripotency regulators PRDM14 and NANOG, resulting in both passive and active demethylation of the genome within a few passages (Ficz et al., 2013; Habibi et al., 2013; Hackett et al., 2013; Yamaji et al., 2013). More recently, downregulation of the DNMT1 cofactor UHRF1 was suggested to contribute to 2i/LIF-induced hypomethylation as well (Meyenn et al., 2016).
In addition to culture conditions, the sex of ESC lines may influence methylation patterns. Female mouse ESC lines cultured in serum/LIF exhibit a reduction of global methylation levels and a decrease in imprinted gene methylation when compared to male ESCs (Habibi et al., 2013; Hackett et al., 2013; Ooi et al., 2010; Zvetkova et al., 2005). Hypomethylation in XX ESCs was directly linked to the presence of two activate X chromosomes (XA) and reduced expression levels of DNMT3A/B (Zvetkova et al., 2005) or DNMT3L (Ooi et al., 2010) since XO subclones regained DNMT3A/B expression and global methylation patterns, similar to XX somatic cells. More recently, Schulz et al. (2014) discovered that female ESCs grown in serum/LIF exhibit reduced MAPK and GSK3 signaling, elevated Prdm14, Nanog and Tet1/2 mRNA levels and reduced Dnmt3a/b mRNA levels relative to male ESCs, indicating that the presence of two XAs recapitulates certain phenotypes of ESCs maintained in a naïve pluripotent state. However, the mechanisms and X-linked regulators underlying female-specific hypomethylation remain elusive.
Here, we revisit the previous observation that late-stage EGCs exhibit widespread DNA hypomethylation and dominant demethylation activity over ESCs with the goal of identifying possible mechanisms and mediators underlying this phenotype. Previous comparisons between ESCs and EGC lines were limited by a small number of cell lines (Sharov et al., 2003), developmental stages of germ cells with a variable degree of epigenetic reprogramming (E8.5) (Leitch et al., 2013) and differences in genetic background (Sharova et al., 2007), sex (Hatano et al., 2005; Tada et al., 1997) or culture conditions (Hackett et al., 2013). We therefore derived multiple isogenic E3.5 ESC and E11.5–E12.5 EGC lines under equivalent growth conditions in order to compare and contrast (i) global transcription, (ii) genome-wide DNA methylation, and (iii) the ability to induce DNA demethylation in fusion hybrids.
RESULTS
Generation of isogenic ESCs and EGCs
We crossed female 129S6 mice (abbreviated as 129) to male C57B6/6J mice carrying a constitutive G418 resistance gene (abbreviated as B6) to derive isogenic, 129xB6 F1 ESC and EGC lines. Specifically, ESC lines were established from the inner cell masses (ICMs) of E3.5 blastocysts whereas EGC lines were produced from post-migratory primordial germ cells of E11.5 and E12.5 genital ridges (Figure 1A). We derived a total of 6 male and 4 female EGC lines as well as 3 male and 3 female ESC lines (Figure 1B). All cell lines were derived in 2i/LIF and maintained in serum/LIF on feeders. This modification allowed us to use equivalent culture conditions for ESCs and EGCs (Leitch et al., 2010), which is not feasible with classic derivation protocols.
Figure 1. Sex rather than cell type drives global DNA methylation patterns.
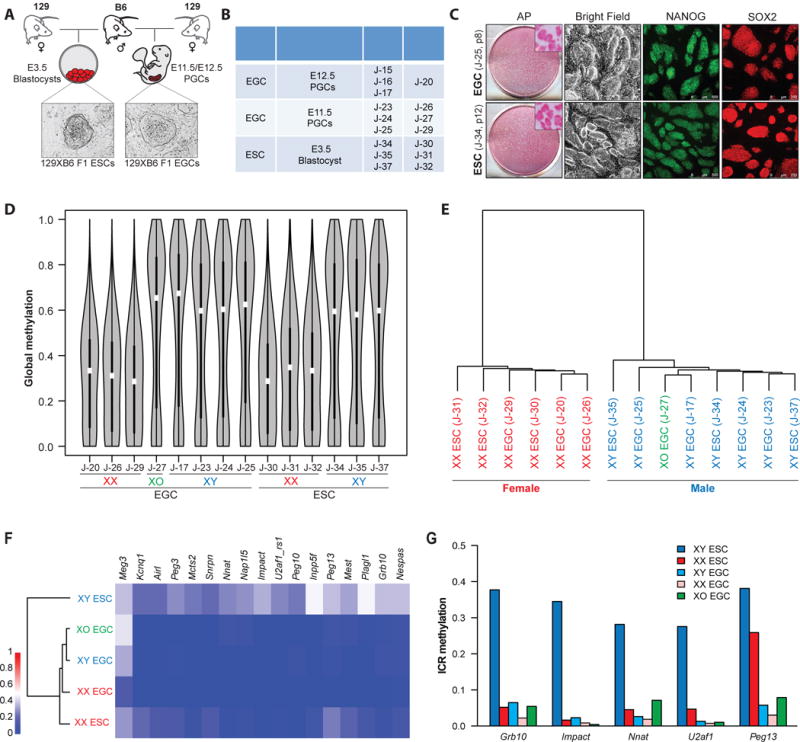
(A) Schematic of the generation of genetically matched ESCs and EGCs.
(B) Detailed information on the established ESCs and EGCs. ESCs and EGCs were collected between passages 4–6 for all experiments unless otherwise specified.
(C) EGCs (top panels) and ESCs (bottom panels) express alkaline phosphatase (AP), NANOG and SOX2. Insets show magnification of AP+ colonies.
(D) Global methylation analysis of isogenic ESC and EGC lines by reduced representation bisulfite sequencing (RRBS) using violin plot representations. Blue color represents XY cells, red color represents XX cells, green represents XO cell line.
(E) Unsupervised hierarchical clustering of RRBS samples shown in Figure 1D. Blue color represents XY cells, red color represents XX cells, green represents XO cell line.
(F) Dendrogram and heatmap representation of imprinted loci in isogenic ESC (n=6) and EGC (n=8) lines.
(G) Average methylation levels across imprinting control regions (ICRs) at indicated loci. Average values of methylation levels for 3 XY ESCs (dark blue), 3 XX ESCs (dark red), 4 XY EGCs (light blue), 3 XX EGCs (light red) and 1 XO EGC (green) line are shown, respectively, for each analysis.
See also Figures S1 and S2.
ESC and EGC lines could be propagated over multiple passages while maintaining pluripotency-associated markers such as alkaline phosphatase (AP) activity and endogenous NANOG and SOX2 expression, documenting their self-renewal potential (Figure 1C). Moreover, both ESCs and EGCs gave rise to differentiated teratomas comprising structures from all three germ layers (Figure S1A) and supported the development of coat color chimeras, demonstrating their pluripotency (Figure S1B and C). Critically, EGC lines but not ESC lines exhibited demethylation of the Peg3 locus, implying successful erasure of genomic imprints, which is a hallmark of late-stage germ cells and derivative EGCs (Figure S1D). Consistent with this observation, EGCs contributed to neonatal and adult chimeras less efficiently than ESCs (Figure S1B). Together, these results show that our newly derived ESC and EGC lines exhibit the expected growth behavior, pluripotency marker profiles, imprinting patterns and developmental potential.
Global methylation analysis distinguishes ESCs and EGCs by sex rather than cell type
To assess global methylation patterns in ESC and EGC lines, we first performed Southern blot analysis for repetitive elements and dot blot analysis for 5mC. We observed that both male ESC and EGC lines displayed a normally methylated genomic landscape while both female ESC and EGC lines were globally hypomethylated, suggesting that sex rather than cell type of origin is the main driver behind overall DNA methylation levels in these pluripotent cell lines (Figure S1E and F). To corroborate this result, we analyzed all cell lines by reduced representation bisulfite sequencing (RRBS), which measures methylation patterns at single-base resolution across the genome (Meissner et al., 2008). RRBS analysis confirmed these results, demonstrating that male ESC/EGC lines are globally hypermethylated relative to female ESC/EGC lines (Figure 1D). Accordingly, unsupervised hierarchical clustering separated these cell lines based on sex rather than cell type (Figure 1E). However, we noticed one exception: the female EGC line J-27 was normally methylated and clustered with male ESC and EGC lines (Figure 1D and E). Interphase FISH of this cell line using an X chromosome-specific probe showed that over 90% of cells were XO, explaining the elevated methylation levels (Zvetkova et al., 2005) (Figure S1G). Other male and female ESC/EGC cultures contained predominantly cells with one or two X chromosomes, respectively. We conclude, based on examining global DNA methylation patterns by three independent assays, that our genetically matched ESC and EGC lines maintained in serum/LIF are distinguished by sex rather than cell type of origin.
Hypomethylation in XX ESCs and EGCs occurs evenly across most genomic features
Although total DNA methylation levels were equivalent between ESCs and EGCs of the same sex, local distribution of methylation patterns could differ in the two cell types, as exemplified by demethylation of the Peg3 locus exclusively in EGCs (Figure S1D). We therefore compared methylation patterns by RRBS across several genomic features for both autosomes and the X chromosomes in ESCs and EGCs. This analysis confirmed that female ESC and EGC lines are similarly hypomethylated compared to male ESC and EGC lines at promoter regions (CpG islands and shores) and repetitive elements (LINEs, SINEs and LTRs) (Figure S2A and B). Specifically, we found that 1,516 autosomal and 63 X-linked promoters were less methylated in female ESCs and EGCs (Figure S2C and D). Moreover, female-specific methylation patterns at these promoter elements were more similar to those of a late-passage male Dnmt3a/3b double knock-out (DKO) ESC line (Liao et al., 2015) than to a male wild-type ESC line (Figure S2C–E).
In contrast to methylation patterns across promoters and repetitive elements, CpGs associated with imprinting control regions (ICRs) showed notable cell type and sex-dependent differences. For example, ICR methylation was generally absent or extremely low in EGC lines compared to male ESC lines, as expected (e.g. Peg13, U2af1, Snrpn) (Figure 1F and G). However, female ESCs also exhibited EGC-like hypomethylation at many ICR elements (e.g. Grb10, Impact, Nnat), confirming epigenetic similarities between EGC lines and female ESC lines (Hackett et al., 2013) (Figure 1F and G). In accordance, unsupervised hierarchical clustering of samples based on all captured imprinted genes grouped female ESCs with male and female EGCs but separately from male ESCs (Figure 1F). Collectively, these results show that, with the exception of a few imprinted genes such as Meg3, Peg3 and Peg13 (Figure 1F, G and Figure S1D), hypomethylation in female ESCs and female EGCs occurs evenly across the genome.
Methylation patterns are driven by the ratio of X chromosomes to autosomes
In light of our finding that sex correlates with DNA methylation patterns in both ESCs and EGCs, we next investigated whether the number of X chromosomes influences methylation levels using ESC-somatic and EGC-somatic hybrids (Figure 2A). Briefly, neomycin-resistant ESC and EGC lines of both sexes were fused to puromycin-resistant male or female MEFs carrying an EGFP reporter in the endogenous Pou5f1 locus (termed Oct4-GFP) using polyethyleneglycol (PEG), followed by dual selection for G418 and puromycin (Figure 2A). We confirmed that hybrid clones reactivated the somatically silenced Oct4-GFP reporter and carried a predominantly tetraploid genome before measuring DNA methylation patterns by RRBS analysis (Figure 2B, C and Figure S3A and B).
Figure 2. Ratio of X chromosomes to autosomes correlates with global methylation levels in pluripotent cell lines.
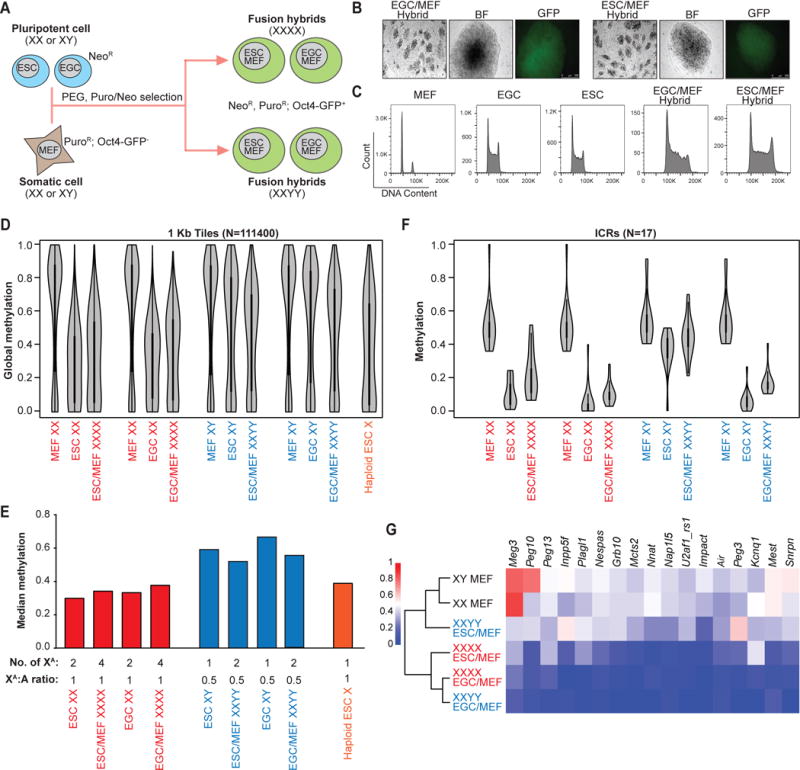
(A) Schematic of the generation of ESC/EGC-somatic hybrids.
(B) Representative ESC/MEF hybrids and EGC/MEF hybrids show activation of somatically silenced Oct4-EGFP reporter.
(C) Representative EGC/MEF and ESC/MEF hybrids show tetraploid DNA content compared to parental fusion partners using propidium iodide (PI) staining.
(D) Global methylation levels of 4n ESC-somatic and EGC-somatic hybrids and their respective 2n fusion partners as determined by RRBS analysis. One representative line for each cell type was shown. A haploid ESC (X) line was included as a control in D–E.
(E) (Top) Median global methylation levels of 4n hybrids and their respective 2n fusion partners from Figure 2D are shown. (Bottom) The number of presumed active X chromosomes (XA) for each line and the ratio of XA to autosomes (A) are shown.
(F) Methylation levels of all captured imprinted loci from ESC/EGC-somatic hybrids and their fusion partners from Figure 2D as measured by RRBS analysis.
(G) Dendrogram and heatmap representation of imprinted methylation in ESC/EGC-somatic hybrids and their somatic fusion partners. Average methylation levels across ICRs of 2 XXYY ESC/MEF hybrids, 2 XXYY EGC/MEF hybrids, 3 XXXX ESC/MEF hybrids, 3 XXXX EGC/MEF hybrids, 1 XY MEF and 1 XX MEF line are shown. XXYY, blue; XXXX, red; XX and XY MEF (black).
See also Figure S3.
Several important conclusions can be drawn from this analysis. First, overall methylation levels of male and female (4n) hybrids resembled those of the parental male and female (2n) pluripotent stem cell line, even though the (2n) somatic fusion partners of either sex (i.e. MEFs) were normally methylated (Figure 2D and Figure S2A and S3C). This result indicates that the female somatic genome in XXXX hybrids undergoes massive demethylation towards a female ESC/EGC-like state while the male somatic genome remains comparatively methylated in XXYY hybrids (Figure 2D and Figure S3C). Considering that cell fusion between MEFs and ESCs or EGCs leads to the reactivation of the somatically silenced X chromosome (Tada et al., 2001), this finding further implies that the ratio of XA chromosomes to autosomes rather than the absolute number of X chromosomes inside a pluripotent cell dictates DNA methylation levels (Figure 2E). In support of this notion, we found that a haploid female (X) ESC line (Elling et al., 2011) was similarly hypomethylated as a diploid female (XX) or tetraploid female (XXXX) ESC line (Figure 2D and E). Pluripotency loci such as Oct4 were equally demethylated in male and female hybrids, thus excluding the possibility that the observed sex-specific methylation differences were a consequence of incomplete reprogramming of the somatic genome or cellular differentiation (Figure S3A). We also confirmed the presence of either 2 or 4 X chromosomes in the majority of male or female hybrids using FISH, although we observed some variability (Figure S3B). We believe that slight distortions to the X-to-A ratio resulting from this variability may explain the reduced global methylation levels in male hybrids compared to male diploid ESCs and EGCs (Figure 2D).
Second, global methylation levels of ESC hybrids were comparable to those of EGC hybrids of the same sex (Figure 2D). Examination of methylation patterns at promoter regions, LTRs, LINEs and SINEs in ESC and EGC hybrids corroborated this conclusion (Figure S3C). Thus, sex rather than cell type determines global methylation levels in both ESC-somatic and EGC-somatic hybrids.
Third, imprinted gene methylation showed again cell type and sex dependent differences (Figure 2F, G and Figure S3D). For example, male ESC hybrids showed similar methylation patterns as the male parental MEFs or ESCs whereas female ESC hybrids exhibited a marked reduction of methylation levels across most imprinted loci, consistent with a sex-specific effect (Figure 2F and G). Additionally, we noticed a pronounced demethylation of imprinted genes in male EGC hybrids, which was absent in male ESC hybrids, implying erasure of somatic imprints by an EGC-specific, sex-independent demethylation mechanism (Piccolo et al., 2013; Tada et al., 1997) (Figure 2F and G). Imprinted methylation was also reduced in female EGC hybrids compared to female ESC hybrids, although this difference was less striking than in the male counterparts. In agreement with these results, unsupervised hierarchical clustering based on all imprinted genes separated male ESC hybrids (normally methylated) from female ESC hybrids and EGC hybrids of either sex (hypomethylated) (Figure 2G), phenocopying imprinting patterns of the parental pluripotent cell lines (Figure 1F). Altogether, these results show that global methylation patterns in ESC-somatic and EGC-somatic hybrids are dictated by the ratio of XA chromosomes to autosomes, regardless of the origin of the pluripotent fusion partner, whereas imprinted gene methylation is influenced by both sex and cell type.
Male and female blastocysts are similarly hypomethylated
The observation that sex correlates with methylation patterns in pluripotent cell lines regardless of cell type raises the important question of whether this reflects methylation differences in the ICM from which ESCs are derived. In order to prospectively identify male and female blastocysts, we crossed male mice carrying an X-linked GFP transgene (XGFPY) (Hadjantonakis et al., 2001) to wild-type female (XX) mice (Figure 3A). Isolated zygotes were flushed from the oviducts and cultured for 4 days in KSOM media until they formed expanded blastocysts with a discernible ICM. Approximately one half of the blastocysts were GFP-positive and female (XGFPX) while the other half of the embryos were GFP-negative and male (XY), as expected (Figure 3B). We noticed that significantly more GFP-negative blastocysts had already hatched by day 4 compared to GFP-positive blastocysts (Figure 3B and C), which is consistent with a slight acceleration of development in male relative to female preimplantation embryos (Burgoyne, 1993). We then dissected the ICM of each blastocyst by immunosurgery and subjected pools of male (n=20) and female (n=29) ICMs to RRBS analysis.
Figure 3. Male and female ICMs are similarly hypomethylated.
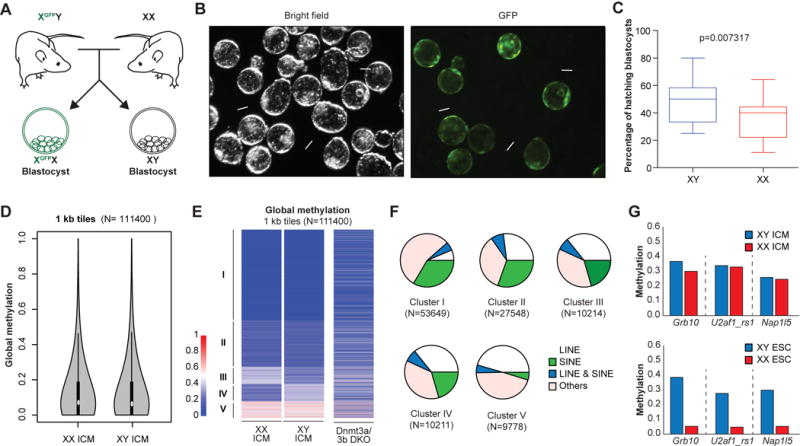
(A) Schematic of the generation of XGFPX and XY blastocysts.
(B) (Left) Representative bright field image of XGFPX and XY blastocysts and (right) GFP-positive XGFPX blastocysts are shown. White arrows indicate hatching XY blastocysts.
(C) The percentage of hatching XGFPX and XY blastocysts from the same litter is plotted. 123 XGFPX and 104 XY blastocysts from 11 independent litters were scored. Data is judged to be statistically significant when p < 0.05 by two-tailed Student’s T-TEST.
(D) Global methylation analysis of pooled XX (n=29) and XY (n=20) ICMs by RRBS using violin plot representation.
(E) Comparison of genome-wide DNA methylation patterns by RRBS in XX and XY ICMs. Global methylation patterns are classified into 5 clusters. Dnmt3a/b DKO cell line was included as a control.
(F) Compositions of each cluster from Figure 3E are shown as pie charts.
(G) Average methylation levels across imprinting control regions (ICRs) for indicated loci from ICM (top; 20 XY and 29 XX ICMs) and ESC (bottom; 3 XY and 3 XX lines) cells.
See also Figure S4.
In contrast to cultured ESC lines, both male and female ICMs were equally hypomethylated when considering 1kb tiles across the genome, reaching levels that were again similar to late-passage male Dnmt3a/b DKO ESCs (Figure 3D and E). We detected a small subset of loci with differential methylation patterns between male and female ICMs (Figure 3E, clusters III and IV). Closer inspection revealed that over two thirds of these loci are associated with repetitive elements including LINEs and SINEs (Figure 3F). Since repetitive elements undergo dynamic methylation changes during preimplantation development (Smith et al., 2014), we surmise that the apparent sex-specific methylation differences are due to the slight developmental asynchrony between male and female blastocysts (Burgoyne, 1993). Critically, male and female ICMs maintained methylation at ICRs that were eroded in cultured female ESC lines (Figure 3G and Figure S4). Altogether, these results show that male and female ICMs are equally hypomethylated and retain ICR methylation, pointing to profound sex and culture-dependent methylation differences between pluripotent cells in vivo and ex vivo.
Post-transcriptional regulation of epigenetic and pluripotency factors in female ESCs
To elucidate the mechanisms that may be responsible for global DNA hypomethylation in female stem cells, we compared transcriptional profiles of isogenic ESCs and EGCs from both sexes by RNA-sequencing analysis. Unsupervised hierarchical clustering showed that female stem cells are grouped separately from male stem cells, which is consistent with our methylation data (Figure 4A). We determined mRNA levels of known regulators of DNA methylation in our dataset, assuming that they would be differentially regulated in male and female stem cells. With the exception of Dnmt3l and Tet3, expression levels of Dnmt1, Uhrf1, Dnmt3a, Dnmt3b, Tet1 and Tet2 were not significantly different between male and female cell lines (Figure 4B and Figure S5A). However, we noticed striking differences at the protein level for these enzymes, with female cell lines showing substantially lower amounts of DNMT1, DNMT3A and DNMT3B and increased amounts of TET2 relative to male cell lines (Figure 4C,D and Figure S5B–E).
Figure 4. Post-transcriptional gene regulation in female ESCs.
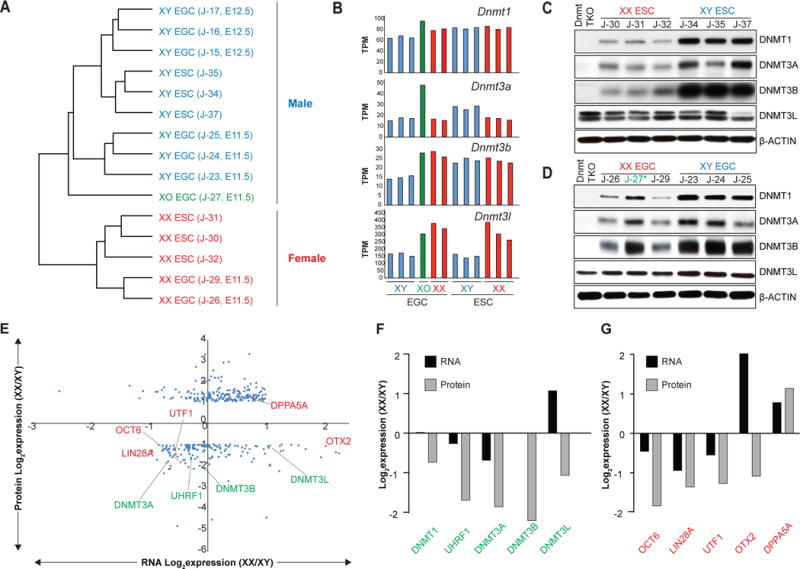
(A) Unsupervised hierarchical clustering of RNA-seq data obtained from isogenic ESC and EGC lines.
(B) mRNA levels for Dnmt1, Dnmt3a, Dnmt3b, and Dnmt3l in isogenic ESC and EGC lines.
(C–D) Western blot analyses for DNMT1, DNMT3A, DNMT3B, DNMT3L in isogenic XX and XY ESC (C) and EGC (D) lines. See Figure S5B and S5C for quantification. Blue color represents XY cells, red color represents XX cells, green (*) represents XO cell line
(E) Correlation between RNA-Seq (3 XX and 3 XY ESC lines) and proteomics (2 replicates per ESC line) data. 193 proteins were found to be upregulated in female ESCs compared to male ESCs even though corresponding RNAs did not change (n=189) or were downregulated (n=4). By contrast, 161 proteins were found to be downregulated in female ESCs compared to male ESCs even though corresponding RNAs did not change (n=143) or were upregulated (n=18). Differentially expressed proteins between male and female ESCs (> 2-fold) were plotted along the y-axis; corresponding differentially expressed RNAs were plotted along the x-axis. Expression levels of DNA methyltransferases and cofactors (green) as well as naïve and primed pluripotency markers (red) are highlighted.
(F) Differential expression of DNA methyltransferases and cofactors from Figure 4E (green) is shown at the RNA (black) and protein (grey) levels.
(G) Differential expression of naïve or primed pluripotency markers from Figure 4E (red) is shown at the RNA (black) and protein (grey) levels.
See also Figure S5 and Table S1–4 and 7.
To determine the scale of post-transcriptional gene expression differences between male and female ESCs, we performed proteomics analysis. We found that out of roughly 8,300 proteins detected by tandem mass-spectrometry, ~550 (7%) were differentially expressed between male (n=2) and female (n=2) ESCs (Table S1). A comparison of our RNA-Seq and proteomics data further showed that 143 proteins were downregulated and 189 proteins were upregulated in female ESCs relative to male ESCs even though associated RNA levels remained unchanged (Figure 4E and Table S2 and 3). This analysis confirmed reduced protein levels for DNMT1, DNMT3A and DNMT3B despite minor or no changes of RNA levels (Figure 4E and F). In addition, we identified UHRF1 among the downregulated proteins with constant RNA levels in female ESCs. We failed to detect differential RNA or protein expression for other factors that have previously been implicated in genomic methylation including KDM2B (Boulard et al., 2015), CXXC1 (Carlone et al., 2005) and HELLS (Dennis et al., 2001) (Figure S5F). Similar to the aforementioned post-transcriptional regulation of epigenetic regulators, we noticed reduced protein levels for several factors associated with primed pluripotency such as OTX2, LIN28A, OCT6, UTF1, and higher protein levels for DPPA5, a factor associated with naïve pluripotency in female ESCs (Figure 4E and G). Combined with the elevated expression of TET2, NANOG and SATB2 at the protein level (Figure S5D, E and G), this observation supports the view that female ESCs may be molecularly closer to a naive state than male ESCs. Altogether, these results show that female ESCs are distinguished from male ESCs by the post-transcriptional regulation of hundreds of genes including transcription factors and epigenetic regulators associated with naïve and primed pluripotency.
DUSP9 is a dose dependent modulator of female hypomethylation
We next searched for candidate modulators of female hypomethylation that are more abundantly expressed in female compared to male ESCs and X-linked based on the observation that XO stem cells regain DNA methylation (Zvetkova et al., 2005) (Figure 1D and Figure S2C–E). Using our RNA-Seq data, we identified 400 X-linked genes that were commonly upregulated in female EGCs and ESCs compared to male EGCs and ESCs, respectively (Figure 5A and Table S4 and 5). We further narrowed down these candidates by searching for transcription factors and signaling modulators previously implicated in ESC self-renewal including ERAS (Takahashi et al., 2003), DUSP9 (Li et al., 2012) and RHOX5 (also termed PEM) (Fan et al., 1999). We also selected KLF8 since other KLF family members were reported to support ESC self renewal (Jiang et al., 2008) (Figure 5B). We then cloned cDNAs encoding for the respective factors into lentiviral vectors carrying a constitutive GFP or Tomato reporter, infected male ESCs, sorted GFP- or Tomato-positive cells and harvested cultures before conducting 5mC dot blot analysis. While overexpression of ERAS, RHOX5 and KLF8 had no measurable effect on methylation levels, we detected a reduction of 5mC levels in DUSP9-overexpressing ESCs (Figure 5C). We confirmed elevated DUSP9 protein levels in female compared to male ESCs/EGCs using Western blot analysis and our proteomics data of ESCs (Figure 5D, E and Figure S6A). Of note, DUSP9 is a dual specificity phosphatase that inhibits MAP kinases (MAPKs) with preference for ERK, followed by p38 and JNK (Caunt and Keyse, 2013). This may explain the previous observation that MAPK signaling is reduced in female ESCs (Schulz et al., 2014). Moreover, the genes encoding for DUSP9’s known substrates (i.e., Erk1/2, p38α, Jnk1/2/3) are present on autosomes, which fits with our finding that the XA-to-autosome ratio is critical for DNA methylation levels in pluripotent cells.
Figure 5. X-linked Dusp9 gene regulates global DNA hypomethylation in female stem cells.
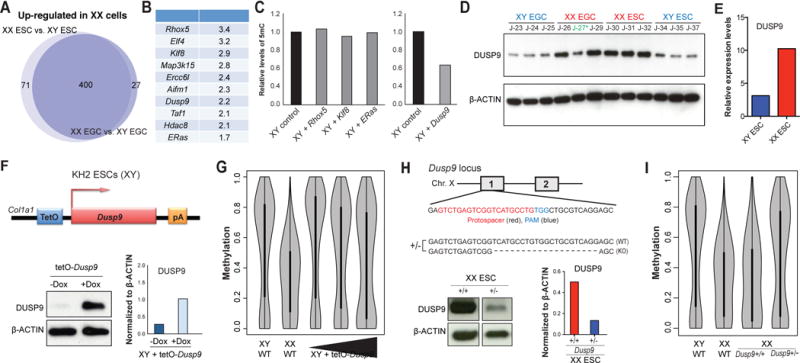
(A) Upregulated X-linked genes in XX EGC (n=2) and ESC (n=3) lines relative to XY counterparts (3 EGC and 3 ESC lines).
(B) List of candidate X-linked genes and their expression levels in XX stem cells compared to XY stem cells. FC, fold-change.
(C) Four candidate genes (Rhox5, Klf8, ERas; left) and (Dusp9; right) from Figure 5B were individually overexpressed in a XY ESC line and global DNA methylation levels were subsequently examined by 5mC dot blot analysis. Global DNA methylation levels of each line were normalized to parental, wild-type ESCs.
(D) Western blot analysis for DUSP9 in isogenic XX and XY ESCs/EGCs. See Figure S6A for quantification. Blue color represents XY cells, red color represents XX cells, green (*) represents XO cell line
(E) Mass-spectrometric quantification of DUSP9 protein levels in XY (blue; 2 replicates) and XX (red; 2 replicates) ESC lines.
(F) (Top) Schematic of doxycycline-inducible Dusp9 allele introduced into KH2 (male) ESCs; these cells also carry a ROSA26-M2rtTA allele. (Bottom) Western blot analysis for DUSP9 in Dusp9-overexpressing KH2 cells treated with or without doxycycline (left), plus quantification (right).
(G) Global methylation analysis of Dusp9-overexpressing KH2 cells (with or without additional Dusp9 lentiviral overexpression construct) by RRBS using violin plot representation. XX and XY ESCs were included as controls.
(H) (Top) Schematic of heterozygous deletion of Dusp9 alleles in a female 129xCast hybrid ESC line using CRISPR/Cas9 technology. Western blot analysis for DUSP9 in Dusp9+/+ and Dusp9+/− ESC lines (left), plus quantification (right).
(I) Global methylation analysis of the Dusp9+/+ and Dusp9+/− ESC lines by RRBS using violin plot representation. Wild-type 129xB6 XX and XY ESC lines were included as controls.
See also Figure S6 and Table S5.
To study the effects of DUSP9 expression on DNA methylation in a more defined and controllable system, we introduced a doxycycline-inducible single-copy transgene of Dusp9 into the Col1a1 locus of male KH2 ESCs (Beard et al., 2006) (Figure 5F). Exposure of this engineered cell line to doxycycline led to DUSP9 upregulation and a concomitant reduction of global methylation levels by ~15% (Figure 5G and Figure S6B). Notably, infection of this transgenic cell line with a dox-inducible virus expressing additional DUSP9 protein reduced 5mC levels by ~30%, indicating that DUSP9 modulates global methylation levels in a dose-dependent manner. We found that a female ESC line analyzed at the same time showed a similar reduction of methylation levels (~40%) relative to an isogenic male ESC control (Figure 5G).
Considering that overexpression of DUSP9 is sufficient to reduce methylation levels in male ESCs, we next tested whether Dusp9 may also be required to maintain hypomethylation in female ESCs. To this end, we deleted one Dusp9 allele in a 129xCastaneous (129xCast) hybrid ESC line using CRISPR/Cas9 technology before conducting RRBS; we chose 129xCast ESCs as they were previously shown to maintain both X chromosomes upon extended culture (Lee and Lu, 1999) (Figure 5H). While the unmodified 129xCast ESC line was hypomethylated to a similar extent as our 129xB6 hybrid ESC lines, Dusp9+/− derivatives approached male ESC-like methylation levels despite the presence of two X chromosomes (Figure 5I and Figure S6C). We note that elevated methylation levels in Dusp9+/− ESC lines were only detected after several rounds of passaging, implying a passive, replication-dependent process. Critically, we excluded that these increased methylation levels were due to differentiated cells by sorting cells for the ESC-specific marker SSEA1 before RRBS analysis and by confirming demethylation of endogenous pluripotency loci including Pou5f1, Zfp42 (Rex1) and Dppa4 in the Dusp9+/− sample (Figure S6D). Unsupervised hierarchical clustering of all RRBS samples based on promoter methylation further showed that male ESCs overexpressing DUSP9 were more similar to wild-type female ESCs whereas female ESCs lacking one Dusp9 allele were more similar to wild-type male ESCs (Figure S6E, F). We conclude that DUSP9 is a dose-dependent modulator of global methylation levels in pluripotent stem cell lines, whereby DUSP9 overexpression is sufficient to induce partial hypomethylation in male ESCs while heterozygous Dusp9 deletion normalizes methylation levels in female ESCs.
DUSP9 overexpression establishes a female-like proteome and signaling state in male ESCs
Female ESCs reportedly express lower levels of MAPK and GSK3 targets and higher levels of AKT targets compared to male ESCs, which is reminiscent of naïve culture conditions and may underlie the observed female-specific hypomethylation (Schulz et al., 2014). To determine whether DUSP9 overexpression in male ESCs is sufficient to recapitulate this female-like signaling state, we performed Western blot analysis for the activated forms of the MAPK kinases MEK1/2 (phospho-MEK1/2) and its downstream kinases ERK1/2 (phospho-ERK1/2). Like female ESCs, p-MEK1/2 and p-ERK1/2 levels were increased rather than decreased in DUSP9-overexpressing male ESCs, consistent with a compensatory feedback mechanisms due to downregulation of a downstream component(s) of the MAPK pathway (Schulz et al., 2014) (Figure 6A and Figure S7A). Indeed, proteomics analysis showed that expression of several downstream targets of the ERK and GSK3 pathways were reduced while targets of the AKT pathway were increased in DUSP9-overexpressing ESCs, mirroring the signaling state of female ESCs (Figure 6B). These results also suggest that DUSP9 overexpression inhibits the MAPK pathway downstream of, or in parallel to, MEK/ERK by a yet to be identified target (Figure 6C).
Figure 6. DUSP9 overexpression establishes a female-like proteome and signaling state in male ESCs.
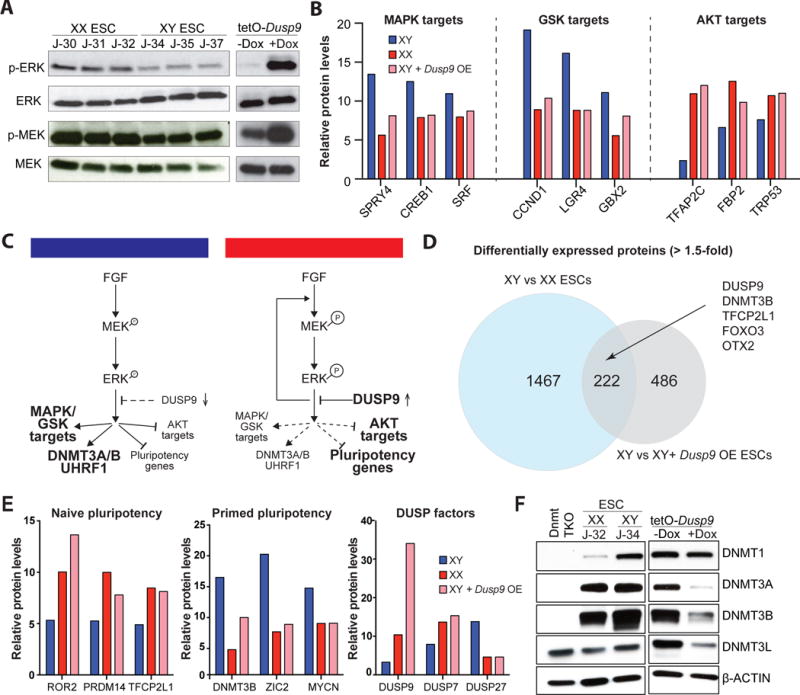
(A) Western blot analyses for p-ERK and ERK, p-MEK and MEK in isogenic XX and XY ESCs (left) and in Dusp9-overexpressing cells (right). See Figure S7A for quantification.
(B) Expression of targets of ERK, GSK and AKT pathways in XY (blue) and XX (red) ESCs as well as Dusp9-overexpressing KH2 cells treated with doxycycline (pink) using proteomics data (2 replicates per line).
(C) Model to explain dose-dependent regulation of MAPK/GSK/AKT pathways, pluripotency and epigenetic factors by DUSP9.
(D) Venn diagram of differentially expressed proteins (>1.5-fold) between male and female ESCs (blue) and between wild-type, male ESCs and Dusp9-overexpressing, male ESCs (grey). Examples of overlapping proteins are indicated by an arrow.
(E) Expression of ated by an arrow.
(E) Expression of proteins associated with naïve and primed pluripotency along with DUSP factors in XY (blue) and XX (red) ESCs as well as Dusp9-overexpressing KH2 ESCs treated with doxycycline (pink) using proteomics data (2 replicates per line).
(F) Western blot analysis for DNMT1, DNMT3A, DNMT3B and DNMT3L levels in Dusp9-overexpressing KH2 cells treated with or without doxycycline. A Dnmt1/3a/3b triple knock-out (TKO) male ESC line and wild-type XX and XY ESC lines were included as controls. See Figure S7B for quantification.
See also Figure S7 and Table S1 and 6.
Global analysis of proteomics data revealed that ~700 proteins were up-or downregulated in DUSP9-overexpressing ESCs compared to uninduced controls (Figure 6D and Table S6 and 7). About a third of these peptides (222) overlapped with proteins whose levels were different between male and female ESCs, suggesting that DUSP9 overexpression partially instates a female-like proteome in male ESCs. For example, we noticed reduced levels of the primed pluripotency markers DNMT3B, ZIC2 and MYCN but increased levels of the naïve pluripotency markers TFCP2L1, ROR2 and PRDM14 in both DUSP9-overexpressing male ESCs and female ESCs relative to untreated male ESCs (Figure 6E). Moreover, DUSP9 overexpression led to an increase of DUSP7 levels, yet a decrease of DUSP27 levels akin to female ESCs, suggesting complex cross-regulation among DUSP family members. Western blot analysis confirmed downregulation of DNMT3B and showed that DNMT3A and DNMT3L levels were also reduced upon DUSP9 overexpression, consistent with our observations in female ESCs (Figure 6F and Figure S7B). However, DNMT1 levels remained unchanged and UHRF1 levels only slightly decreased after DUSP9 overexpression, possibly explaining the less pronounced demethylation phenotype compared to female ESCs (Figure 6F and Figure S7C). Collectively, these findings show that DUSP9 overexpression partially phenocopies female-specific modulation of signaling pathways, epigenetic regulators and pluripotency-associated transcription factors, providing a mechanistic basis for the observed hypomethylation.
DISCUSSION
Here, we show that EGC and ESC lines are highly similar with regards to global transcriptional and DNA methylation patterns when comparing cell lines within the same sex (Figure 7A). Our results may explain previous observations, which suggested that late-stage EGCs, in comparison with ESCs, are globally less methylated, express higher levels of NANOG and induce more extensive demethylation of repetitive elements in fusion hybrids (Hatano et al., 2005; Tada et al., 1997; 2001). Indeed, re-examination of these prior studies reveals that methylation, protein and fusion assays were performed with female EGCs and female somatic cells whereas ESC controls were of male origin. It is noteworthy that earlier studies had already detected reduced methylation of repetitive elements or imprinted loci when comparing female to male EGC lines derived from either E8.5 or E11.5/E12.5 genital ridges using Southern blot analysis (Durcova-Hills et al., 2004; Shovlin et al., 2008; Tada et al., 1998). However, a subsequent, comprehensive comparison of E8.5 EGCs and genetically matched ESCs failed to find sex-specific methylation or expression differences using bisulfite sequencing (Leitch et al., 2013). We believe that variability due to culture methods and methylation assays or the use of early-stage (E8.5) vs. late-stage (E12.5) EGCs may account for the observed differences. It is further possible that some previously studied female cell lines were afflicted by X chromosome loss, which would mask methylation differences. Our use of 129/B6 hybrid cell lines may be another reason for differences observed between this study and previous studies that utilized inbred EGC and ESC lines. Although we were unable to detect methylation differences between ESCs and EGCs of the same sex when analyzing CpG islands and shores, LINEs, SINEs and LTRs, our data support the previous finding that imprinted genes are more susceptible to demethylation in male EGC hybrids compared to male ESC hybrids (Piccolo et al., 2013; Tada et al., 1997).
Figure 7. Effect of sex chromosomes and associated signaling pathways on DNA methylation in pluripotent cells.
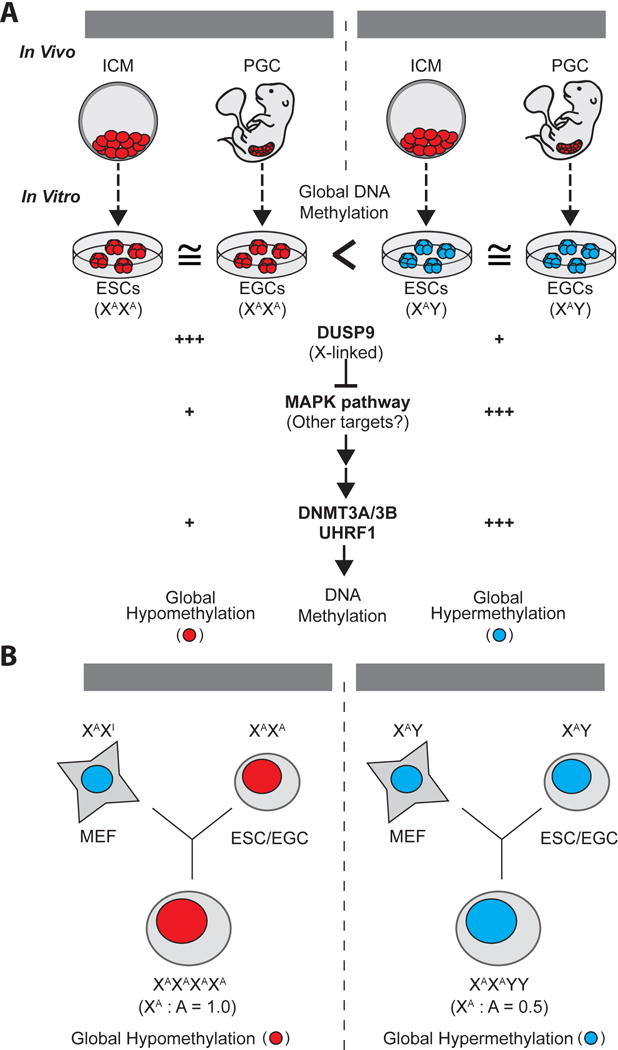
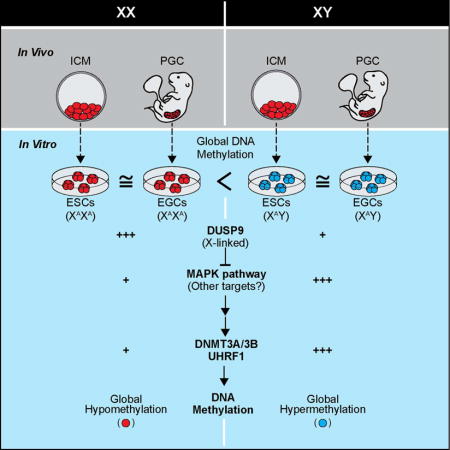
(A) Both ICM cells and PGCs are globally hypomethylated during development, regardless of sex. However, ESCs and EGCs, derived from explanted ICM and PGC cells, exhibit distinct DNA methylation status according to their sex. Female ESCs/EGCs maintain global hypomethylation, which is in part due to elevated expression of the X-linked Dusp9 gene. Upregulation of DUSP9 attenuates MAPK signaling and, directly or indirectly, leads to downregulation of DNMT3A/3B and UHRF1.
(B) Global DNA methylation levels in fusion hybrids between MEFs and either ESCs or EGCs are dictated by the ratio of active X chromosomes (XA) to autosomes (A) rather than the absolute number of XAs. (A–B) Red, global DNA hypomethylation; blue, global DNA hypermethylation.
Our data suggest that the ratio of XA chromosomes to autosomes dictates methylation levels in mouse pluripotent stem cells and we have ascribed this phenotype in part to the upregulation of DUSP9 in female ESCs (Figure 7B). We show that heterozygous deletion of the X-linked MAPK phosphatase Dusp9 in female ESCs leads to increased global methylation over time while its overexpression in male ESCs induces partial hypomethylation, providing a molecular link between X chromosome dosage, MAPK signaling and genomic methylation (Figure 7B). Our inability to fully recapitulate female-specific hypomethylation upon DUSP9 overexpression in male ESCs could be due to (i) poor activity of overexpressed DUSP9, (ii) insufficient time to (passively) demethylate the genome, or (iii) the involvement of other X-linked genes that act in parallel to DUSP9. We recognize that the mechanisms underlying female-specific hypomethylation may be similar but not identical to that of 2i-induced hypomethylation. While 2i-induced hypomethylation reportedly involves transcriptional repression of Dnmt3a/b and activation of Tet1/2 by the transcription factors PRDM14 and NANOG (Ficz et al., 2013; Hackett et al., 2013; Okashita et al., 2014; Yamaji et al., 2013), our results suggest that female-specific hypomethylation involves a mechanism that operates predominantly through post-transcriptional destabilization of DNMT1/3A/B and their cofactors UHRF1 and DNMT3L. The recent observation that reduced protein levels of UHRF1 are critical for 2i-induced hypomethylation (Meyenn et al., 2016) supports a mechanistic overlap between naive culture conditions and female-specific hypomethylation. Our finding that DUSP9 overexpression leads to the downregulation of MAPK/GSK3 targets and proteins associated with primed pluripotency but upregulation of factors associated with naïve pluripotency further underscores the molecular similarity to 2i culture, although these results do not show that female ESCs are in a bona fide naïve pluripotent state. While 2i directly inhibits MEK1/2 and GSK3, DUSP9 seems to suppress these pathways downstream of ERK1/2 by target proteins that remain to be identified.
Notably, the dramatic differences in global methylation between male and female pluripotent stem cell lines do not extend to the ICMs of male and female blastocysts, which showed equally low 5mC levels and stable retention of ICR methylation (Figure 7A). This unexpected finding underscores the profound effects that explantation and continuous propagation of pluripotent cells ex vivo can have on the epigenome of ESCs. Despite these differences between ICM cells and derivative ESCs, our observations in cultured stem cells may be relevant for understanding epigenetic processes in vivo. For example, while both male and female primordial germ cells (PGCs) are globally hypomethylated, female PGCs, like female pluripotent cell lines, carry two active X chromosomes and exhibit a more pronounced reduction of global methylation levels relative to male PGCs (Popp et al., 2010). Similar to our cultured female ESCs, human PGCs express reduced levels of UHRF1 and DNMT3A at the protein but not RNA level and this has been associated with global demethylation (Oliveros-Etter et al., 2015). Considering this association between female cells with two XAs and hypomethylation, it should also be interesting to explore whether relaxation of X chromosome inactivation in somatic cells affects DNA methylation patterns (Yang et al., 2016). Moreover, it would be informative to assess whether Dusp9-deficient embryos, which succumb to placental defects early in development (Christie et al., 2005), exhibit aberrant methylation patterns within the embryonic or extra-embryonic compartments.
In summary, our data provide new molecular insights into the role of sex chromosomes and associated signaling pathways on the epigenetic state of distinct pluripotent stem cells. Our data further clarify some of the discrepancies surrounding methylation differences between ESCs and (late-stage) EGCs and emphasize the importance of controlling for sex, genetic background and culture conditions when assessing the epigenome and transcriptome of pluripotent stem cell lines.
STAR Methods
CONTACT FOR REAGENT AND RESOURCE SHARING
Further information and requests for resources and reagents should be directed to and will be fulfilled by the Lead Contact, Konrad Hochedlinger (khochedlinger@mgh.harvard.edu).
EXPERIMENTAL MODEL AND SUBJECT DETAILS
Animal care and use
All mice used in the study were housed and bred in Specific Pathogen Free (SPF) rooms located in the AAALAC-accredited Center for Comparative Medicine vivarium at Massachusetts General Hospital. All mice were housed in ventilated cages on a standard 12:12 light cycle. All procedures involving mice adhered to the guidelines of the approved Massachusetts General Hospital Institutional Animal Care and Use Committee (IACUC) protocol no. 2006N000104. XGFP mice were generated in Dr. Andras Nagy’s laboratory and made available to us through Dr. Jeanie Lee’s laboratory at MGH. C57B6/6J-Tg(pPGKneobpA)3Ems/J and B6D2F1 mice were obtained from Jackson labs. Swiss Webster and 129S6 mice were obtained from Taconic Biosciences.
Mouse ESC generation
E3.5 blastocysts were retrieved from the uterine horns by flushing and collected under a dissection microscope. A whole blastocyst was plated onto MEF feeders (Globalstem) containing 2i-LIF medium, which is a 1:1 mixture of DMEM/F12 and Neurobasal media (Invitrogen) supplemented with N2 (Invitrogen), B27 (Invitrogen), 1X PenStrep, 103 IU LIF, 1 μM PD0325901 (Tocris), and 3 μM CHIR99021 (Tocris) (Ying et al., 2008). The cells were cultured for 4 days without changing medium. After that, the cells were cultured for an additional 3–4 days and fed every two days with fresh 2i-LIF medium until picking. Outgrowths from the cultures were picked, trypsinized, and re-plated onto MEF feeders in serum-LIF medium containing KO DMEM (Invitrogen) supplemented with 15% FBS (Hyclone), 1X Glutamax (GIBCO), 100 uM non-essential amino acids (GIBCO), and 0.1 mM beta-mercaptoethanol (GIBCO), 1X PenStrep (GIBCO) and 103 IU LIF.
Mouse EGC generation
Genital ridges containing primordial germ cells (PGCs) were retrieved from E11.5/12.5 mouse embryos according to a previous protocol (Matsui et al., 1992). PGCs were collected from the genital ridges by trypsinization and centrifugation. Subsequently, isolated PGCs were cultured on stem cell factor (SCF)-secreting MEF feeders containing 2i-LIF medium as described above, and supplemeted with 60 ng/ml exogenous SCF (Pepro Tech) and 10 ng/ml bFGF (Invitrogen). The cells were cultured for 3 days without changing medium. After that, the cells were cultured for additional 7–11 days and fed every other day with fresh 2i-LIF medium until picking. Outgrowth from the culture was picked, trypsinized, and re-plated onto MEF feeders containing serum-LIF medium as above.
METHODS DETAILS
Cell fusion
One million EGCs or ESCs were combined with one million MEFs in a 50 ml conical tube and then centrifuged at 1000 rpm for 5 min. After removal of the supernatant by gently decanting, the cell pellet was resuspended in the remaining medium by gently tapping the tube. 700 ul of PEG-1500 (Roche) was added in a drop-wise manner while gently stirring the tube after each drop. 10 ml of pre-warmed KO DMEM (Invitrogen) was added in a drop-wise manner at a rate of 1 ml per minute. The cells were incubated at 37°C for 5 min in the waterbath and centrifuged at 100 rpm for 5 min. The cell pellets were resuspended in serum-LIF medium and plated onto MEF feeders. Selection was initiated 24 hr post-fusion with puromycin (2 mg/mL) and neomycin (300 mg/mL). Cell-cycle analysis was performed on a FACSCalibur (BD) with propidium iodide; signal area was used as a measure of DNA content.
Teratoma assay
ESCs of the indicated type were grown to confluency in a single well of a confluent six well plate. Cells were then trypsinized and counted. Circa 2×10⁶ ESCs were brought up in 300 uL of ESC media and injected subcutaneously into the flank of a nu/nu immunocompromised mouse. Teratomas were monitored and removed once tumor size reached 1 cm or tumors became ulcerated, weighed, and processed for hemaytoxylin and eosin staining.
Blastocyst injection
Blastocyst injections were performed as previously described (Eggan et al., 2001). Briefly, female BDF1 mice were superovulated by intraperitoneal injection with 5 IU of PMSG and 48 hours later with 5 IU of hCG. Following hCG injection, the superovulated females were mated to BDF1 stud males. Zygotes were isolated from females with a vaginal plug 24 h after hCG injection. Zygotes were cultured in vitro for 3 d in KSOM medium (Millipore), and blastocysts were injected with ESCs or EGCs and transferred into pseudopregnant recipient females.
Immunosurgery
Immunosurgery was performed as previously described (Chen and Melton, 2007). Briefly, zygotes were isolated from a cross between male mice carrying an X-linked GFP reporter (Hadjantonakis et al., 2001) and female wild-type mice. Isolated zygotes were cultured in KSOM medium (Millipore) for 4 days. E4.5 blastocysts were transferred through a series of Acidic Tyrode’s Solution (Millipore) drops to dissolve the zona pellucida (usually 5–30 seconds) and then through a series of KSOM medium drops to rinse off Acidic Tyrode’s Solution. After the removal of the zona pellucida, blastocysts were transferred through a series of drops containing Rabbit polyclonal anti-mouse serum antibody (Rockland Immunochemicals) and left in the final drop for 30 minutes at 37°C. After incubation, blastocysts were transferred through series of KSOM medium drops to rinse off primary antibody and then transferred through a series of Gunea-pig complement serum (Sigma) drops until the lysis of trophectoderm cells. The trophectoderm was removed by repetitive mouth-pipetting.
AP Staining and immunostaining
Alkaline phosphatase staining was performed using the Vector Red substrate kit (Vector Labs). Immunostaining was done according to (Plath et al., 2003). Briefly, cells/tissues were fixed with 4% paraformaldehyde for 5 minutes and subsequently blocked with 1% BSA, 1% donkey serum and 0.5% Triton X-100. Following blocking, cells were incubated overnight with primary antibody at 4°C. Cells were then washed 3X with PBS and incubated with secondary antibody for 1 hour at room temp. Cells/tissues were then washed 3 times with PBS, mounted, and viewed with an inverted fluorescent scope. Antibodies used for this study were: anti-NANOG antibody (Abcam; ab80892), anti-SOX2 antibody (Santa Cruz; sc-17320), anti-GATA6 antibody (Cell signaling; #5851), anti-GFP antibody (Nobus; NB100-1614) and anti-OCT4 antibody (Santa Cruz; sc-5279).
Bisulfite Sequencing
DNA was bisulfite-converted using the EZ DNA Methylation kit (Zymo Research) and analyzed by EpigenDX using the following assays: Peg3 (ADS183) and Oct4 (ASY585).
Bisulfite treated DNA was purified according to the manufacturer’s protocol and eluted to a final volume of 46 μL. PCRs were performed using 1 μL of bisulfite treated DNA and 0.2 μM of each primer. One primer was biotin-labeled and HPLC purified in order to purify the final PCR product using sepharose beads. PCR product was bound to Streptavidin Sepharose HP (GE Healthcare Life Sciences), after which the immobilized PCR products were purified, washed, denatured with a 0.2 μM NaOH solution, and rewashed using the PyroMark Q96 Vacuum Workstation (Qiagen), as per the manufacturer’s protocol. Next, 0.5 μM of sequencing primer was annealed to the purified single stranded PCR products. 10 μL of the PCR products were sequenced by Pyrosequencing on the PSQ96 PyroMark System (Qiagen) following the manufacturer’s instructions.
The methylation status of each CpG site was determined individually as an artificial C/T SNP using PyroMark Q96 Advanced Software (Qiagen). The methylation level at each CpG site was calculated as the percentage of the methylated alleles (Relative Light Unit, RLU) divided by the sum of all methylated and unmethylated alleles (RLU). The mean methylation level was calculated using methylation levels of all measured CpG sites within the targeted region of each gene. Each experiment included non-CpG cytosines as internal controls to detect incomplete bisulfite conversion of the input DNA. In addition, a series of unmethylated and methylated DNA are included as controls in each PCR. Furthermore, PCR bias testing (preferential PCR amplification of C or T allele) was performed by mixing low methylated control DNA with high methylated DNA at different ratios (0%, 5%, 10%, 25%, 50%, 75%, and 100%), followed by bisulfite modification, PCR, and Pyrosequencing analysis.
Southern blot analysis for global DNA methylation
10–15 microgram of DNA was digested with HpaII and fragments were separated on a 0.8% agarose gel. The gel was rinsed in distilled water depurinated in 0.5 HCl for 25 min on a shaker and then washed in 1.5 M NaCl/0.5 M NaOH buffer for 45 min on a shaker. DNA was transferred onto HybondXL membrane (Amersham Biosciences) in transfer buffer containing 1.5 M NaCl/0.5 M NaOH overnight. The membrane was washed in 2X SCC, dried on paper towels and pre-hybridized in hybridization buffer containing 0.5 M NaPi (pH7.2), 7% SDS and 1 mM EDTA at 65°C for 3 hrs in the rotator. pMR 150 probe (Meissner et al., 2005) was labeled using Primer-It II Random Labeling Kit (Agilent) following the manufacturer’s instructions and hybridized to the membrane in a rotating tube using a hybridization oven at 65°C overnight. The m embrane was washed twice in washing buffer containing 40 mM sodium phosphate (pH7.2) and 0.1% SDS for 30 min at 65°C. The membrane was exposed to fi lm for 24 hrs or longer at room temperature before analysis.
Dot blot assay
Genomic DNA samples were diluted in TE buffer and then denatured in 0.4 M NaOH/10 mM EDTA at 95°C for 10 min and followed by adding an equal volume of cold 2 M ammonium acetate (pH 7.0). Denatured DNA samples were spotted on a nitrocellulose membrane (BIO-RAD) in an assembled Bio-Dot apparatus (BIO-Rad) according to manufacturer’s instruction. The membrane was washed with 2X SSC buffer and UV-cross linked for 10 min. Then the membrane was blocked with 5% non-fat milk for 1 hr and incubated with anti-5mC (Active Motif; 39649) for HRP-conjugated secondary antibodies and enhanced chemiluminescence detection. Quantification was performed using the ImageJ software.
Reduced representation bisulfite sequencing (RRBS)
Global, base pair-resolution measurements of DNA methylation was measured by Reduced Representation Bisulfite Sequencing (RRBS) as described in (http://genomebiology.com/2012/13/10/r92). Briefly, genomic DNA from ESCs was digested using the MspI enzyme which cuts at ĈCGG sites. Bisulfite treatment of DNA fragments was used to convert unmethylated cytosines to uracil, and this change was observed after sequencing and aligning library reads to the reference genome. Libraries were sequenced using the HiSeq 2500 platform, and aligned to an in-silico MspI-digested mm9 genome using MAQ (http://maq.sourceforge.net/) and the Picard Pipeline (http://broadinstitute.github.io/picard/faq.html).
The methylation at each covered CpG was calculated as the number of reads in which the CpG was methylated (no bisulfite conversion took place) divided by the number of total reads covering the CpG. Region analysis was performed using methods described in (http://dx.doi.org/10.1038/nmeth.1414) on promoters (2Kb centered at refSeq transcription start sites), 1Kb tiles, and imprinting control regions as defined in (http://www.ncbi.nlm.nih.gov/pubmed/18600261).
RNA-sequencing
Undifferentiated EGCs/ESCs were sorted for SSEA1+ to control for the homogeneity of cells before RNA extraction. The quality and quantity of total input mRNA was determined on an Agilent BioAnalyzer 2100 using Agilent RNA 6000 Nano kit. One microgram of total RNA from each sample was then used as input for library preparation using Illumina TruSeq RNA Sample Prep Kit, following manufacturer’s instructions. Each paired-end library was prepared with an adaptor with unique index sequence. The size profile and quantity of resulting libraries were than determined on the BioAnalyzer 2100 with Agilent High Sensitivity DNA kit. These libraries were then pooled together at equal molar concentration and sequenced on an Illumina HiSeq 2000.
RNA-seq data analysis
Unsupervised clustering for all samples was performed over expression values for genes with TPM (transcripts per million) > 1.0 in at least one of the 15 samples. For hierarchical clustering, Pearson correlation (r) between pairs of samples was computed on log(TPM+1) expression values and 1-r was used as the distance metric. Differential expression analysis was performed using the R package edgeR (Robinson et al., 2010) using the exactTest routine after normalizing read counts and excluding genes with low counts (TPM < 1.0 for 2 or more samples) (Anders et al., 2013). Differentially expressed genes were defined based on cutoffs of fold change ≥ 1.5 and FDR < 0.05.
Western blot analysis
In order to control for the homogeneity of the cells, differentiated EGCs/ESCs were removed by pre-plating for 1 hr at 37’C. Whole cell lysates from the cells were loaded to 4–20% gradient SDS-PAGE gels and then transferred to nitrocellulose membranes (BIO-RAD) by using Trans-Blot® Turbo™ Transfer System (BIO-RAD). Blocked membranes were incubated with antibodies against the protein of interest; anti-DNMT1 (Cell Signaling; 5119S), anti-DNMT3A (Santa Cruz; sc-20703), anti-DNMT3B (Abcam; ab13604), anti-DNMT3L (Cell Signaling; 12309S), anti-DUSP9 (Abcam; ab167080), anti-UHRF1 (Santa Cruz; sc-98817), anti-NANOG (Abcam; ab80892), anti-TET2 (Abcam; ab94580) and anti-β-ACTIN (Cell Signaling; 5125S). The intensity of each band was measured using the ImageJ software and normalized to the respective loading controls.
Gene targeting of ESCs
Dusp9 cDNA was cloned into the shuttle plasmid pBS31 using NotI and MfeI digestion. The resulting plasmid was electroporated into KH2 ESCs together with a plasmid driving expression of Flp recombinase (Beard et al., 2006). Correct targeted clones were screened for by hygromycin selection and confirmed by Southern blotting as previously described (Beard et al., 2006).
Viral production
Dusp9, Rhox5, Eras, and Klf8 cDNAs were obtained (see key resources table) and cloned into tet-inducible lentiviruses (Stadtfeld et al., 2008). Lentivirus was produced by transfecting the respective plasmids into 293T cells using Polyethylenimine (PEI) along with the packaging plasmids VSV-G and Δ8.9 in T75 flasks. Virus was collected in mES media and concentrated using an ultracentrifuge. Virus was then used to infect ESCs. After infection, the ESCs were induced with 2ug/mL of doxycycline for 72 hours, the cells were dissociated and sorted by expression of the fluorescent reporter that was cloned into the corresponding lentiviral plasmid.
Generation of Dusp9+/− M. musculus x M. castaneous ESCs
M. musculus x M. castaneus hybrid female ESCs were cotransfected with a construct containing an sgRNA targeting the first exon of Dusp9 and a Cas9 expression vector (Hwang et al., 2013) (see also key resources table). Individual clones were picked, and heterozygous knockout clones were identified by PCR amplification with primers flanking the Cas9 cut site (see key resources table) followed by deep sequencing to identify both alleles in each clone. Alleles containing frame shift indels (i.e. not divisible by 3) were considered to be null alleles. Expression of Dusp9 in heterozygous clones was confirmed via Western blot analysis.
X chromosome FISH
ESC lines were prepared for FISH analysis by cytogenetic direct preparation after trypsinzation from cells plated on gelatin. Cells were then exposed to hypotonic solution (0.075 M KCl) for 25 minutes at 37°C and fixed with 3:1 methanol:acetic acid. FISH was performed using a probe for murine X chromosome (DXMit190) labeled with Red fluorochrome (ID Labs, London, Ontario, Canada) and a probe for murine Y chromosome (Whole chromosome probe) labeled with Green fluorochrome (ID Labs, London, Ontario, Canada) according to manufacturer’s directions. After counterstaining with DAPI/antifade (Vectashield, Vector Laboratories, Burlingame, California), nuclei were scored for each sample by each of 2 independent scorers.
Proteomic sample preparation
Approximately 5 × 10⁷ cells were washed twice in PBS and harvested manually using cell scrapers. The cells were centrifuged at 500 × g, flash frozen using liquid nitrogen, and stored at −80 °C until lysis. Cell pellets were re-suspended in lysis buffer containing 50 mM HEPES (pH 8.5), 8 M urea, 150 mM NaCl, protease inhibitors (mini-Complete EDTA-free, Roche), and phosphatase inhibitors (PhosSTOP, Roche). Cells were then lysed via syringe lysis with 15 passes through a 22 gauge needle. Lysates were centrifuged to clear the lysate and the protein concentration was determined using a BCA assay (ThermoFisher Scientific). Equal amounts of protein (2 mg) was reduced for 45 min at 37 °C with 5 mM DTT, alkylated with 15 mM IAA for 30 min at room temperature in the dark, before final reduction with 5 mM DTT for 15 min at room temperature. Protein content was then extracted through methanol-chloroform precipitation, before re-suspension in 50 mM HEPES, 8 M urea, and 150 mM NaCl. For proteolytic digestion LysC (Wako, Japan) was added at a substrate:enzyme ratio of 100:1 and incubated for 2 hr at 37 °C. Samples were then diluted to 1.5 mM Urea with 50 mM HEPES before overnight digestion with Trypsin at room temperature with a substrate:enzyme ratio of 50:1. The peptide solutions were then acidified before solid-phase extraction via SepPak (Waters). Peptide samples were re-suspended in 450 μL 50% ACN, 2 M lactic acid and 100 μg of each sample was removed, desalted, and saved for protein-level measurements. Phosphopeptide enrichment was performed as previously described (Erickson et al., 2015).
Peptides saved prior to enrichment were then suspended in 100 μL of 200 mM EPPS pH 8.5 before the addition of 30 μL of anhydrous acetonitrile, and 10 μL of a 20 μg/μL stock of TMT reagent. Samples were incubated for 1 hr at room temperature before the addition of 10 μL 5% hydroxylamine. A small portion of each sample was mixed, desalted, and analyzed to determine relative protein abundance in each sample. The remaining sample was then mixed to ensure equal loading of protein content and acidified before solid-phase extraction via SepPak.
Mass spectrometry analysis
Mass spectrometry analyses were performed on an Orbitrap Fusion Lumos mass spectrometer (ThermoFisher Scientific) coupled to an Easy-nLC 1200 ultra-high pressure liquid chromatography (LC) pump (ThermoFisher Scientific). Peptides were separated at 300 nL/min using a self-packed analytical column (75 μm inner diameter) that was packed with 0.5 cm of Magic C18 resin (5 μm, 100 Å, Michrom Bioresources) followed by 35 cm of Sepax Technologies GP-C18 resin (1.8 μm, 120 Å). LC buffers consisted of 0.1% formic acid (buffer A) and 80% ACN with 0.1% formic acid and LC gradients were optimized to ensure equal elution of peptides throughout the analysis. Intact mass analysis of peptides (MS1) was performed in the Orbitrap (AGC target 1e6, 120,000 resolution, 100 ms maximum injection time) and used to select the 10 most abundant features for MS/MS (MS2) analysis. Candidate peaks were filtered based on charge sate ≥ 2 and monoisotopic peak assignment, and dynamic exclusion (60 second ± 7.5 ppm) was enabled. Each precursor was isolated with using a quadrupole mass filter (0.5 Th width) and then fragmented with collision-induced dissociation (CID, 35 NCE) ion the ion trap with distinct settings for peptides (AGC target = 2.5 × 10⁴, maximum injection time = 200 ms). To alleviate the effects of precursor ion interference multiple fragment ions were isolated using synchronous precursor selection (SPS) prior to HCD (55 NCE, SPS notches = 8, AGC target = 2.2 × 10⁵, maximum injection time of 150 ms) MS3 fragmentation and Orbitrap analysis (50,000 resolution).
Mass spectrometry data analysis
A compilation of in-house software was used to convert mass spectrometric data (Thermo “.raw” files) to mzXML format, as well as to correct monoisotopic m/z measurements and erroneous peptide charge state assignments (Huttlin et al., 2010). Assignment of MS/MS spectra was performed using the SEQUEST algorithm (Eng et al., 1994). Static modifications included TMT (229.16293 Da) on both the n-terminus of peptides and lysine residues and carbamidomethylation of cysteine residues (57.02146 Da). Peptide spectral matches were filtered to 1% false discovery rate (FDR) using the target-decoy strategy (Elias and Gygi, 2007), before being grouped into proteins which were then filtered to 1% FDR at the protein level as previously described (Huttlin et al., 2010). Proteins isoforms were quantified as previously described (Isasa et al., 2015). “Relative abundance” expression values for protein isoform and represent the signal-to-noise value of each sample divided by the sum of all samples for each analyte normalized to 100. All data analysis was performed using R (http://www.R-project.org). Heat maps and associated gene ontology enrichment were generated with Perseus (http://www.perseus-framework.org) (Tyanova et al., 2016).
QUANTIFICATION AND STATISTICAL ANALYSIS
Statistical parameters including the exact values of n and statistical significance are reported in the Figures and the Figure Legends. Data is judged to be statistically significant when p < 0.05 by two-tailed Student’s T-TEST where appropriate.
DATA AND SOFTWARE AVAILABILITY
Software
ImageJ software is available at https://imagej.nih.gov/ij/download.html
PyroMark Q96 Advanced Software is available at https://www.qiagen.com/ch/shop-old/automated-solutions/pyrosequencing/pyromark-q96-id/
edgeR software is a available at https://bioconductor.org/packages/release/bioc/html/edgeR.html
MAQ alignment software is available at http://maq.sourceforge.net/
The Picard pipeline software is available at https://github.com/broadinstitute/picard
R software suite is available at http://www.R-project.org
Perseus software is available at http://www.perseus-framework.org
Data resources
The accession number for the raw data files for the RNA-seq analysis is NCBI Gene Expression Omnibus: GSE94481
The accession number for the raw data files for the RRBS analysis is NCBI Gene Expression Omnibus: GSE68733
Supplementary Material
Acknowledgments
We thank members of the Hochedlinger and Meissner labs for helpful comments and critical reading of the manuscript. We thank K. Folz-Donahue, M. Weglarz, L. Prickett, A. Galvin, M. Gesner and A. Handley at the Massachusetts General Hospital/Harvard Stem Cell Institute flow cytometry core. We are grateful to A. L. Hawkins, S. Wang, A. Aggarwal and C.C. Morton at Brigham and Woman’s Hospital CytoGenomics Core Laboratory for FISH analysis. We thank J. Lee for providing the EL16.7 female ESC line and X-linked GFP mice. We also thank L. Yan at EpigenDx Inc. for bisulfite methylation sequencing. A.J.H. was supported by an American Cancer Society – New England Division – Ellison Foundation Postdoctoral Fellowship (PF-15-130-01-DDC). J.B. was supported by the NIH (1F32HD078029-01A1). A.M. was supported by the NIH (P01GM099117), the New York Stem Cell Foundation and a Center for Excellence in Genome Science from the NHGRI (1P50HG006193-01). A.M. is a New York Stem Cell Foundation Robertson Investigator. K.H. was supported by HHMI and the NIH (R01 HD058013).
Footnotes
Publisher's Disclaimer: This is a PDF file of an unedited manuscript that has been accepted for publication. As a service to our customers we are providing this early version of the manuscript. The manuscript will undergo copyediting, typesetting, and review of the resulting proof before it is published in its final citable form. Please note that during the production process errors may be discovered which could affect the content, and all legal disclaimers that apply to the journal pertain.
AUTHOR CONTRIBUTIONS
Conceptualization, J.C., K.C., A.M. and K.H.; Methodology, J.C.: Investigation, J.C., A.J.H., J.W., J.B., R.M.W. and J.E.; Formal Analysis, K.C., C.M.R., S.L. and A.S.; Resources, H.G., P.B and U.E.; Writing - Original Draft, J.C. and K.C.; Writing - Review & Editing, A.M. and K.H.; Visualization, J.C.; Supervision, R.M., R.S., P.J.P. and S.P.G., A.M. and K.H.; Funding Acquisition, A.M. and K.H.
References
- Anders S, McCarthy DJ, Chen Y, Okoniewski M, Smyth GK, Huber W, Robinson MD. Count-based differential expression analysis of RNA sequencing data using R and Bioconductor. Nature Protocols. 2013;8:1765–1786. doi: 10.1038/nprot.2013.099. [DOI] [PubMed] [Google Scholar]
- Beard C, Hochedlinger K, Plath K, Wutz A, Jaenisch R. Efficient method to generate single-copy transgenic mice by site-specific integration in embryonic stem cells. Genesis. 2006;44:23–28. doi: 10.1002/gene.20180. [DOI] [PubMed] [Google Scholar]
- Boulard M, Edwards JR, Bestor TH. FBXL10 protects Polycomb-bound genes from hypermethylation. Nat Genet. 2015;47:479–485. doi: 10.1038/ng.3272. [DOI] [PubMed] [Google Scholar]
- Burgoyne PS. A Y-chromosomal effect on blastocyst cell number in mice. Development. 1993;117:341–345. doi: 10.1242/dev.117.1.341. [DOI] [PubMed] [Google Scholar]
- Carlone DL, Lee JH, Young SRL, Dobrota E, Butler JS, Ruiz J, Skalnik DG. Reduced genomic cytosine methylation and defective cellular differentiation in embryonic stem cells lacking CpG binding protein. Molecular and Cellular Biology. 2005;25:4881–4891. doi: 10.1128/MCB.25.12.4881-4891.2005. [DOI] [PMC free article] [PubMed] [Google Scholar]
- Caunt CJ, Keyse SM. Dual-specificity MAP kinase phosphatases (MKPs): shaping the outcome of MAP kinase signalling. Febs J. 2013;280:489–504. doi: 10.1111/j.1742-4658.2012.08716.x. [DOI] [PMC free article] [PubMed] [Google Scholar]
- Chen AE, Melton DA. Derivation of human embryonic stem cells by immunosurgery. J Vis Exp. 2007;574 doi: 10.3791/574. [DOI] [PMC free article] [PubMed] [Google Scholar]
- Christie GR, Williams DJ, MacIsaac F, Dickinson RJ, Rosewell I, Keyse SM. The Dual-Specificity Protein Phosphatase DUSP9/MKP-4 Is Essential for Placental Function but Is Not Required for Normal Embryonic Development. Molecular and Cellular Biology. 2005;25:8323–8333. doi: 10.1128/MCB.25.18.8323-8333.2005. [DOI] [PMC free article] [PubMed] [Google Scholar]
- Dennis K, Fan T, Geiman T, Yan Q, Muegge K. Lsh, a member of the SNF2 family, is required for genome-wide methylation. Genes & Development. 2001;15:2940–2944. doi: 10.1101/gad.929101. [DOI] [PMC free article] [PubMed] [Google Scholar]
- Durcova-Hills G, Burgoyne P, McLaren A. Analysis of sex differences in EGC imprinting. Dev Biol. 2004;268:105–110. doi: 10.1016/j.ydbio.2003.12.018. [DOI] [PubMed] [Google Scholar]
- Eggan K, Akutsu H, Loring J, Jackson-Grusby L, Klemm M, Rideout WM, Yanagimachi R, Jaenisch R. Hybrid vigor, fetal overgrowth, and viability of mice derived by nuclear cloning and tetraploid embryo complementation. Proc Natl Acad Sci USa. 2001;98:6209–6214. doi: 10.1073/pnas.101118898. [DOI] [PMC free article] [PubMed] [Google Scholar]
- Elias JE, Gygi SP. Target-decoy search strategy for increased confidence in large-scale protein identifications by mass spectrometry. Nat Methods. 2007;4:207–214. doi: 10.1038/nmeth1019. [DOI] [PubMed] [Google Scholar]
- Elling U, Taubenschmid J, Wirnsberger G, O’Malley R, Demers S-P, Vanhaelen Q, Shukalyuk AI, Schmauss G, Schramek D, Schnuetgen F, et al. Forward and reverse genetics through derivation of haploid mouse embryonic stem cells. Cell Stem Cell. 2011;9:563–574. doi: 10.1016/j.stem.2011.10.012. [DOI] [PMC free article] [PubMed] [Google Scholar]
- Eng JK, McCormack AL, Yates JR. An approach to correlate tandem mass spectral data of peptides with amino acid sequences in a protein database. J Am Soc Mass Spectrom. 1994;5:976–989. doi: 10.1016/1044-0305(94)80016-2. [DOI] [PubMed] [Google Scholar]
- Erickson BK, Jedrychowski MP, McAlister GC, Everley RA, Kunz R, Gygi SP. Evaluating multiplexed quantitative phosphopeptide analysis on a hybrid quadrupole mass filter/linear ion trap/orbitrap mass spectrometer. Anal Chem. 2015;87:1241–1249. doi: 10.1021/ac503934f. [DOI] [PMC free article] [PubMed] [Google Scholar]
- Fan Y, Melhem MF, Chaillet JR. Forced expression of the homeobox-containing gene Pem blocks differentiation of embryonic stem cells. Dev Biol. 1999;210:481–496. doi: 10.1006/dbio.1999.9279. [DOI] [PubMed] [Google Scholar]
- Ficz G, Hore TA, Santos F, Lee HJ, Dean W, Arand J, Krueger F, Oxley D, Paul YL, Walter J, et al. FGF Signaling Inhibition in ESCs Drives Rapid Genome-wide Demethylation to the Epigenetic Ground State of Pluripotency. Cell Stem Cell. 2013:1–9. doi: 10.1016/j.stem.2013.06.004. [DOI] [PMC free article] [PubMed] [Google Scholar]
- Habibi E, Brinkman AB, Arand J, Kroeze LI, Kerstens HHD, Matarese F, Lepikhov K, Gut M, Brun-Heath I, Hubner NC, et al. Whole-Genome Bisulfite Sequencing of Two Distinct Interconvertible DNA Methylomes of Mouse Embryonic Stem Cells. Cell Stem Cell. 2013:1–10. doi: 10.1016/j.stem.2013.06.002. [DOI] [PubMed] [Google Scholar]
- Hackett JA, Dietmann S, Murakami K, Down TA, Leitch HG, Surani MA. Synergistic Mechanisms of DNA Demethylation during Transition to Ground-State Pluripotency. Stem Cell Reports. 2013;1:518–531. doi: 10.1016/j.stemcr.2013.11.010. [DOI] [PMC free article] [PubMed] [Google Scholar]
- Hadjantonakis AK, Cox LL, Tam PP, Nagy A. An X-linked GFP transgene reveals unexpected paternal X-chromosome activity in trophoblastic giant cells of the mouse placenta. Genesis. 2001;29:133–140. doi: 10.1002/gene.1016. [DOI] [PubMed] [Google Scholar]
- Hajkova P, Jeffries SJ, Lee C, Miller N, Jackson SP, Surani MA. Genome-wide reprogramming in the mouse germ line entails the base excision repair pathway. Science. 2010;329:78–82. doi: 10.1126/science.1187945. [DOI] [PMC free article] [PubMed] [Google Scholar]
- Hatano SY, Tada M, Kimura H, Yamaguchi S, Kono T, Nakano T, Suemori H, Nakatsuji N, Tada T. Pluripotential competence of cells associated with Nanog activity. Mech Dev. 2005;122:67–79. doi: 10.1016/j.mod.2004.08.008. [DOI] [PubMed] [Google Scholar]
- Huttlin EL, Jedrychowski MP, Elias JE, Goswami T, Rad R, Beausoleil SA, Villén J, Haas W, Sowa ME, Gygi SP. A tissue-specific atlas of mouse protein phosphorylation and expression. Cell. 2010;143:1174–1189. doi: 10.1016/j.cell.2010.12.001. [DOI] [PMC free article] [PubMed] [Google Scholar]
- Hwang WY, Fu Y, Reyon D, Maeder ML, Tsai SQ, Sander JD, Peterson RT, Yeh JRJ, Joung JK. Efficient genome editing in zebrafish using a CRISPR-Cas system. Nature Biotechnology. 2013;31:227–229. doi: 10.1038/nbt.2501. [DOI] [PMC free article] [PubMed] [Google Scholar]
- Isasa M, Rose CM, Elsasser S, Navarrete-Perea J, Paulo JA, Finley DJ, Gygi SP. Multiplexed, Proteome-Wide Protein Expression Profiling: Yeast Deubiquitylating Enzyme Knockout Strains. J Proteome Res. 2015;14:5306–5317. doi: 10.1021/acs.jproteome.5b00802. [DOI] [PMC free article] [PubMed] [Google Scholar]
- Jiang J, Chan YS, Loh YH, Cai J, Tong GQ, Lim CA, Robson P, Zhong S, Ng HH. A core Klf circuitry regulates self-renewal of embryonic stem cells. Nature Cell Biology. 2008;10:353–360. doi: 10.1038/ncb1698. [DOI] [PubMed] [Google Scholar]
- Labosky PA, Barlow DP, Hogan BL. Mouse embryonic germ (EG) cell lines: transmission through the germline and differences in the methylation imprint of insulin-like growth factor 2 receptor (Igf2r) gene compared with embryonic stem (ES) cell lines. Development. 1994;120:3197–3204. doi: 10.1242/dev.120.11.3197. [DOI] [PubMed] [Google Scholar]
- Lee JT, Lu N. Targeted mutagenesis of Tsix leads to nonrandom X inactivation. Cell. 1999;99:47–57. doi: 10.1016/s0092-8674(00)80061-6. [DOI] [PubMed] [Google Scholar]
- Leitch HG, Blair K, Mansfield W, Ayetey H, Humphreys P, Nichols J, Surani MA, Smith A. Embryonic germ cells from mice and rats exhibit properties consistent with a generic pluripotent ground state. Development. 2010;137:2279–2287. doi: 10.1242/dev.050427. [DOI] [PMC free article] [PubMed] [Google Scholar]
- Leitch HG, McEwen KR, Turp A, Encheva V, Carroll T, Grabole N, Mansfield W, Nashun B, Knezovich JG, Smith A, et al. Naive pluripotency is associated with global DNA hypomethylation. Nature Structural and Molecular Biology. 2013;20:311–316. doi: 10.1038/nsmb.2510. [DOI] [PMC free article] [PubMed] [Google Scholar]
- Li Z, Fei T, Zhang J, Zhu G, Wang L, Lu D, Chi X, Teng Y, Hou N, Yang X, et al. BMP4 Signaling Acts via dual-specificity phosphatase 9 to control ERK activity in mouse embryonic stem cells. Cell Stem Cell. 2012;10:171–182. doi: 10.1016/j.stem.2011.12.016. [DOI] [PubMed] [Google Scholar]
- Liao J, Karnik R, Gu H, Ziller MJ, Clement K, Tsankov AM, Akopian V, Gifford CA, Donaghey J, Galonska C, et al. Targeted disruption of DNMT1, DNMT3A and DNMT3B in human embryonic stem cells. Nat Genet. 2015;47:469–478. doi: 10.1038/ng.3258. [DOI] [PMC free article] [PubMed] [Google Scholar]
- Matsui Y, Zsebo K, Hogan BL. Derivation of pluripotential embryonic stem cells from murine primordial germ cells in culture. Cell. 1992;70:841–847. doi: 10.1016/0092-8674(92)90317-6. [DOI] [PubMed] [Google Scholar]
- Meissner A, Gnirke A, Bell GW, Ramsahoye B, Lander ES, Jaenisch R. Reduced representation bisulfite sequencing for comparative high-resolution DNA methylation analysis. Nucleic Acids Research. 2005;33:5868–5877. doi: 10.1093/nar/gki901. [DOI] [PMC free article] [PubMed] [Google Scholar]
- Meissner A, Mikkelsen TS, Gu H, Wernig M, Hanna J, Sivachenko A, Zhang X, Bernstein BE, Nusbaum C, Jaffe DB, et al. Genome-scale DNA methylation maps of pluripotent and differentiated cells. Nature. 2008;454:766–770. doi: 10.1038/nature07107. [DOI] [PMC free article] [PubMed] [Google Scholar]
- von Meyenn F, Iurlaro M, Habibi E, Liu NQ, Salehzadeh-Yazdi A, Santos F, Petrini E, Milagre I, Yu M, Xie Z, et al. Impairment of DNA Methylation Maintenance Is the Main Cause of Global Demethylation in Naive Embryonic Stem Cells. Molecular Cell. 2016;62:848–861. doi: 10.1016/j.molcel.2016.04.025. [DOI] [PMC free article] [PubMed] [Google Scholar]
- Okashita N, Kumaki Y, Ebi K, Nishi M, Okamoto Y, Nakayama M, Hashimoto S, Nakamura T, Sugasawa K, Kojima N, et al. PRDM14 promotes active DNA demethylation through the Ten-eleven translocation (TET)-mediated base excision repair pathway in embryonic stem cells. Development. 2014;141:269–280. doi: 10.1242/dev.099622. [DOI] [PubMed] [Google Scholar]
- Oliveros-Etter M, Li Z, Nee K, Hosohama L, Hargan-Calvopiña J, Lee SA, Joti P, Yu J, Clark AT. PGC Reversion to Pluripotency Involves Erasure of DNA Methylation from Imprinting Control Centers followed by Locus-Specific Re-methylation. Stem Cell Reports. 2015 doi: 10.1016/j.stemcr.2015.07.006. [DOI] [PMC free article] [PubMed] [Google Scholar]
- Ooi S, Wolf D, Hartung O, Agarwal S, Daley GQ, Goff SP, Bestor TH. Dynamic instability of genomic methylation patterns in pluripotent stem cells. Epigenetics Chromatin. 2010;3:17. doi: 10.1186/1756-8935-3-17. [DOI] [PMC free article] [PubMed] [Google Scholar]
- Piccolo FM, Bagci H, Brown KE, Landeira D, Soza-Ried J, Feytout A, Mooijman D, Hajkova P, Leitch HG, Tada T, et al. Different Roles for Tet1 and Tet2 Proteins in Reprogramming-Mediated Erasure of Imprints Induced by EGC Fusion. Molecular Cell. 2013:1–11. doi: 10.1016/j.molcel.2013.01.032. [DOI] [PMC free article] [PubMed] [Google Scholar]
- Plath K, Fang J, Mlynarczyk-Evans SK, Cao R, Worringer KA, Wang H, de la Cruz CC, Otte AP, Panning B, Zhang Y. Role of histone H3 lysine 27 methylation in X inactivation. Science. 2003;300:131–135. doi: 10.1126/science.1084274. [DOI] [PubMed] [Google Scholar]
- Popp C, Dean W, Feng S, Cokus SJ, Andrews S, Pellegrini M, Jacobsen SE, Reik W. Genome-wide erasure of DNA methylation in mouse primordial germ cells is affected by AID deficiency. Nature. 2010;463:1101–1105. doi: 10.1038/nature08829. [DOI] [PMC free article] [PubMed] [Google Scholar]
- Reik W, Surani MA. Germline and Pluripotent Stem Cells. Cold Spring Harbor Perspectives in Biology. 2015;7:a019422. doi: 10.1101/cshperspect.a019422. [DOI] [PMC free article] [PubMed] [Google Scholar]
- Robinson MD, McCarthy DJ, Smyth GK. edgeR: a Bioconductor package for differential expression analysis of digital gene expression data. Bioinformatics. 2010;26:139–140. doi: 10.1093/bioinformatics/btp616. [DOI] [PMC free article] [PubMed] [Google Scholar]
- Schulz EG, Meisig J, Nakamura T, Okamoto I, Sieber A, Picard C, Borensztein M, Saitou M, Blüthgen N, Heard E. The Two Active X Chromosomes in Female ESCs Block Exit from the Pluripotent State by Modulating the ESC Signaling Network. Cell Stem Cell. 2014;14:203–216. doi: 10.1016/j.stem.2013.11.022. [DOI] [PubMed] [Google Scholar]
- Sharov AA, Piao Y, Matoba R, Dudekula DB, Qian Y, VanBuren V, Falco G, Martin PR, Stagg CA, Bassey UC, et al. Transcriptome analysis of mouse stem cells and early embryos. PLoS Biol. 2003;1:E74. doi: 10.1371/journal.pbio.0000074. [DOI] [PMC free article] [PubMed] [Google Scholar]
- Sharova LV, Sharov AA, Piao Y, Shaik N, Sullivan T, Stewart CL, Hogan BLM, Ko MSH. Global gene expression profiling reveals similarities and differences among mouse pluripotent stem cells of different origins and strains. Dev Biol. 2007;307:446–459. doi: 10.1016/j.ydbio.2007.05.004. [DOI] [PMC free article] [PubMed] [Google Scholar]
- Shovlin TC, Durcova-Hills G, Surani A, McLaren A. Heterogeneity in imprinted methylation patterns of pluripotent embryonic germ cells derived from pre-migratory mouse germ cells. Dev Biol. 2008;313:674–681. doi: 10.1016/j.ydbio.2007.11.007. [DOI] [PubMed] [Google Scholar]
- Smith ZD, Chan MM, Humm KC, Karnik R, Mekhoubad S, Regev A, Eggan K, Meissner A. DNA methylation dynamics of the human preimplantation embryo. Nature. 2014;511:611–615. doi: 10.1038/nature13581. [DOI] [PMC free article] [PubMed] [Google Scholar]
- Stadtfeld M, Maherali N, Breault DT, Hochedlinger K. Defining molecular cornerstones during fibroblast to iPS cell reprogramming in mouse. Cell Stem Cell. 2008;2:230–240. doi: 10.1016/j.stem.2008.02.001. [DOI] [PMC free article] [PubMed] [Google Scholar]
- Tada M, Tada T, Lefebvre L, Barton SC, Surani MA. Embryonic germ cells induce epigenetic reprogramming of somatic nucleus in hybrid cells. Embo J. 1997;16:6510–6520. doi: 10.1093/emboj/16.21.6510. [DOI] [PMC free article] [PubMed] [Google Scholar]
- Tada M, Takahama Y, Abe K, Nakatsuji N, Tada T. Nuclear reprogramming of somatic cells by in vitro hybridization with ES cells. Curr Biol. 2001;11:1553–1558. doi: 10.1016/s0960-9822(01)00459-6. [DOI] [PubMed] [Google Scholar]
- Tada T, Tada M, Hilton K, Barton SC, Sado T, Takagi N, Surani MA. Epigenotype switching of imprintable loci in embryonic germ cells. Dev Genes Evol. 1998;207:551–561. doi: 10.1007/s004270050146. [DOI] [PubMed] [Google Scholar]
- Takahashi KK, Yamanaka SS. Induction of pluripotent stem cells from mouse embryonic and adult fibroblast cultures by defined factors. Cell. 2006;126:663–676. doi: 10.1016/j.cell.2006.07.024. [DOI] [PubMed] [Google Scholar]
- Takahashi K, Mitsui K, Yamanaka S. Role of ERas in promoting tumour-like properties in mouse embryonic stem cells. Nature. 2003;423:541–545. doi: 10.1038/nature01646. [DOI] [PubMed] [Google Scholar]
- Tyanova S, Temu T, Sinitcyn P, Carlson A, Hein MY, Geiger T, Mann M, Cox J. The Perseus computational platform for comprehensive analysis of (prote)omics data. Nat Methods. 2016;13:731–740. doi: 10.1038/nmeth.3901. [DOI] [PubMed] [Google Scholar]
- Yamaji M, Ueda J, Hayashi K, Ohta H, Yabuta Y, Kurimoto K, Nakato R, Yamada Y, Shirahige K, Saitou M. PRDM14 ensures naive pluripotency through dual regulation of signaling and epigenetic pathways in mouse embryonic stem cells. Cell Stem Cell. 2013;12:368–382. doi: 10.1016/j.stem.2012.12.012. [DOI] [PubMed] [Google Scholar]
- Yang L, Kirby JE, Sunwoo H, Lee JT. Female mice lacking Xist RNA show partial dosage compensation and survive to term. Genes & Development. 2016;30:1747–1760. doi: 10.1101/gad.281162.116. [DOI] [PMC free article] [PubMed] [Google Scholar]
- Ying QL, Wray J, Nichols J, Batlle-Morera L, Doble B, Woodgett J, Cohen P, Smith A. The ground state of embryonic stem cell self-renewal. Nature. 2008;453:519–523. doi: 10.1038/nature06968. [DOI] [PMC free article] [PubMed] [Google Scholar]
- Zvetkova I, Apedaile A, Ramsahoye B, Mermoud JE, Crompton LA, John R, Feil R, Brockdorff N. Global hypomethylation of the genome in XX embryonic stem cells. Nat Genet. 2005;37:1274–1279. doi: 10.1038/ng1663. [DOI] [PubMed] [Google Scholar]
Associated Data
This section collects any data citations, data availability statements, or supplementary materials included in this article.