Abstract
We demonstrate the use of high-throughput biodosimetry platforms based on commercial high-throughput/high-content screening robotic systems. The cytokinesis-block micro-nucleus (CBMN) assay, using only 20 μl whole blood from a fingerstick, was implemented on a PerkinElmer cell::explorer and General Electric IN Cell Analyzer 2000. On average 500 binucleated cells per sample were detected by our Fluor-QuantMN software. A calibration curve was generated in the radiation dose range up to 5.0 Gy using the data from 8 donors and 48,083 binucleated cells in total. The study described here demonstrates that high-throughput radiation biodosimetry is practical using current commercial high-throughput/high-content screening robotic systems, which can be readily programmed to perform and analyze robotics-optimized cytogenetic assays. Application to other commercial high-throughput/high-content screening systems beyond the ones used in this study is clearly practical. This approach will allow much wider access to high-throughput biodosi-metric screening for large-scale radiological incidents than is currently available.
INTRODUCTION
Currently, a major hurdle for cytogenetic biodosimetry laboratories is the development and implementation of strategies to cope with the large number of samples that they would be required to screen in case of a large-scale radiological emergency (1, 2). In response to such a large scale event, it is estimated that hundreds of thousands of samples would need to be screened per week (3). In contrast, the throughput of a large cytogenetics laboratory, implementing a bioassay manually, is estimated at a few tens of samples per day and even large cytogenetic laboratory networks can only analyze some hundreds of samples per day (4–7).
Over the past decade, the Columbia Center for High-Throughput Minimally-Invasive Radiation Biodosimetry has developed Rapid Automated Biodosimetry Tools (RABiT) based on custom-built robotic platforms (8–13).
More recently, we have been focusing on utilization of commercial next-generation platforms for high-throughput biodosimetry, which use robotic-friendly ANSI/SLAS2 standardized high-throughput microplate formats (14). High-throughput/high-content screening (HTS/HCS) has become a widely used technique in both academia and industry (15) and has evolved with sets of standardized tools and techniques. These systems generally include: robotic plate-handling systems, liquid-handling systems, an automated microscope and control software (16). Microplates, each of which consists of an array of wells, are moved through the system by robotic handling. The microplate wells are filled via the liquid-handling systems, and evaluated with the microscope, often after a period of incubation. Control software choreographs the interactions between the system components to ensure accuracy and repeatability throughout processing. Assay automation has become modular, creating systems that can be easily expanded and modified. The greatest advances have not been the introduction of more complex robotics but rather simplification and increased reliability (17).
In the pharmaceutical industry, HTS systems are used to rapidly screen large libraries of drug candidates for biochemical activity, on a specific cellular target or protein, whereas in a university setting, these systems allow parallelized investigation of more fundamental biological targets (15). In comparison to manual processing, HTS systems provide higher throughput and, importantly, reduced variations leading to better quality data (18).
As well as their increasing availability and throughput, a major advantage of using commercial HTS systems, such as employed in this work as the RABiT-II, over both manual systems and custom-built automated systems is improved quality control. In contrast to dedicated biodosimetry-specific devices, which will potentially be unused for long periods of time, HTS devices are typically in regular use and undergo regular testing and maintenance. These HTS systems also have a broad base of trained users and maintenance personnel, ensuring successful operation in time of crisis.
The main philosophy of the RABiT II approach is to make use of these, already deployed, systems for performing high-throughput biodosimetry. This would require development of assays optimized for common HTS/HCS configurations, with no modification of the HTS/HCS platforms.
In this article, we describe implementation, on a commercial HTS/HCS system, of the cytokinesis-block micronucleus (CBMN) assay using a fingerstick of whole blood. The CBMN assay (19, 20) is one of the simpler assays, in terms of both sample handling and scoring, in the field of radiation biodosimetry; it quantifies radiation-induced chromosome damage expressed as post-mitotic micronuclei. Lymphocytes are cultured to division but cytokinesis is blocked, preventing separation of the two daughter cells. Healthy lymphocytes form binucleated cells, while those with chromosome damage can form an additional micronucleus containing chromosomal fragments, with the yield of micronuclei per binucleated cell increasing monotonically with dose. We have previously reported on modifications to this assay allowing its performance in micro-culture in multiwell plates (21) thus making it suitable for a HTS/HCS system.
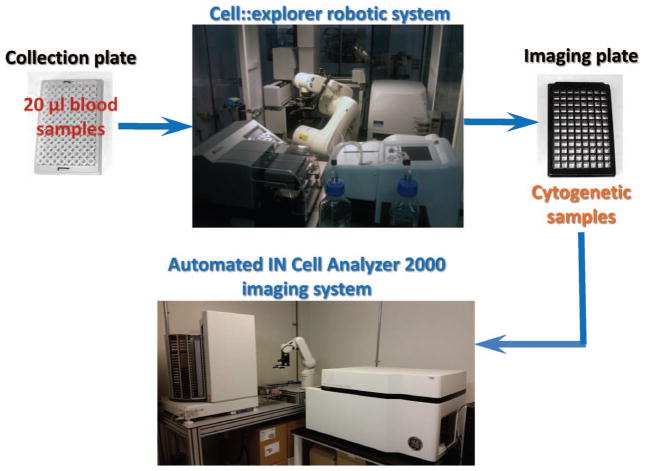
We demonstrate here a complete automation of sample preparation steps and complete automation of sample imaging for our miniaturized CBMN assay using commercial robotic systems, consisting of a PerkinElmer cell::explorer and General Electric IN Cell Analyzer 2000, both co-located at the Columbia Genome Center. The general workflow is shown in Fig. 1: 20 μl blood samples, collected in 96 2D-barcoded tubes are loaded into the cell::explorer system for cell culture and sample preparation in 96-well imaging plates. Plates are then transferred to the associated imaging system (IN Cell Analyzer 2000) and automatically scanned.
FIG. 1.
General scheme of the automated CBMN assay of peripheral human blood lymphocytes at Columbia Genome Center.
We note that this implementation can be easily translated to commercial platforms available from other vendors, such as Tecan or Labcyte, and from Thermo Scientific, PerkinElmer or BD Biosciences systems for wide-field high-content imaging.
MATERIALS AND METHODS
Blood Collection
Blood samples (0.5–1 ml) were collected into heparinized vacutainer tubes (BD, Franklin Lakes, NJ) from 8 healthy volunteers (6 females and 4 males; age: 24–50) following informed consent (IRB protocol #AAAF2671). For each donor, 20 μl aliquots were pipetted into 200 μl 2D-barcoded tubes (Matrix Storage Tubes; Thermo Fisher Scientific Inc., Waltham, MA), placed into a compatible 96-tube rack (8×12) and covered with the supplied top (Thermo Fisher Scientific Inc.). For each donor, duplicate samples were prepared.
Irradiation
The covered tubes in the racks were transported to a Gammacell 40 137Cesium irradiator (Atomic Energy of Canada, Ltd., Canada) and each tube exposed to 0 (control), 1.0, 2.0, 3.0, 4.0, 5.0 or 6.0 Gy of gamma rays at a dose rate of 0.82 Gy/min. After irradiation, 200 μl of PB-MAX™ karyotyping media (Life Technologies, Grand Island, NY) was added to the 20 μl human whole blood samples. This differs from the proposed use in an actual emergency scenario where exposure would occur in vivo and samples collected into tubes preloaded with anticoagulant and medium.
Automation of Sample Processing
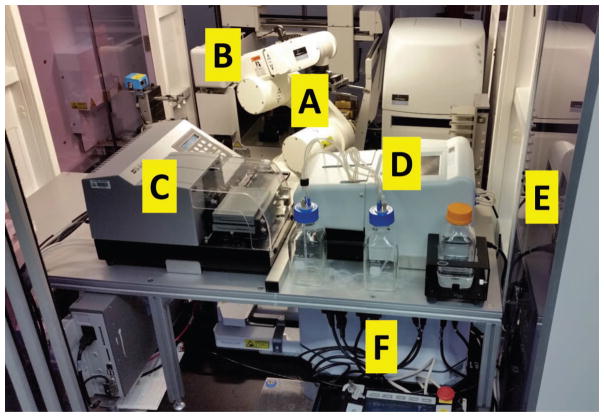
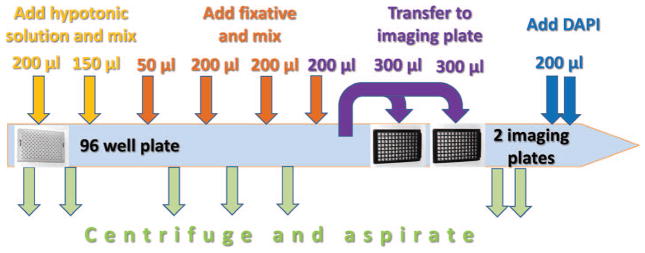
For the automation of sample processing we used a cell::explorer system [PerkinElmer, Waltham, MA (Fig. 2)]. Like most HTS/HCS systems the cell::explorer consists of sub-stations surrounding an anthropomorphic robotic arm [Denso Inc., Long Beach, CA (Fig. 2A)]. The stations used in this work were: Liquid handling: pipetting steps were performed on JANUS® platform [PerkinElmer (Fig. 2B)] with 96 channel multiple dispensing head, aspiration was done using an EL406™ microplate washer [BioTek, Winooski, VT (Fig. 2C)], liquid dispensing was done by FlexDrop [PerkinElmer (Fig. 2D)]. Automated incubator: an STX500 automated incubator [Liconic US Inc., Woburn, MA (Fig. 2E)], allows maintaining of up to 500 96-well plates in a humidified environment at 37°C, 5% CO2. Centrifuge: sedimentation of cells was performed using a V-Spin 96-well plate centrifuge [Agilent Technologies, Santa Clara, CA (Fig. 2F)]. Assay: the following assay (shown schematically in Fig. 3) was programmed using PerkinElmer’s plate::works automation control and scheduling software and performed entirely within the cell::explorer:
FIG. 2.
Layout of the cell::explorer™ at the Columbia Genome Center used as RABiT-II, showing the various subsystems: anthropomorphic robotic arm (A), the JANUS® liquid-handling system (B), EL406™ microplate washer (C), the FlexDrop dispenser (D), STX500 automated incubator (E), V-spin™ automated centrifuge (F).
FIG. 3.
Scheme of the automated peripheral human blood sample harvesting in cell::explorer after 70 h of cell culturing.
The rack of tubes containing blood and PB-MAX™ karyotyping media was placed into an incubator 37°C, 5% CO2. After 44 h of incubation, cytochalasin-B (Sigma-Aldrich, St. Louis, MO) was added to cultures to block cytokinesis of proliferating lymphocytes at a final concentration of 6 μg/ml. Cells were gently mixed five times by aspiration and dispensing in the JANUS workstation, to break up pellets. Samples were placed back into a 37°C, 5% CO2 incubator for an additional 26 h. After completion of cell culturing, the rack containing whole blood samples in 2D-barcoded tubes was removed from the automated incubator, and 200 μl of each sample was transferred into 96-well microplate (Greiner Bio-One, Austria) and processed as follows. The microplate was centrifuged at 1,200 rpm for 2 min and media above the settled cell pellet was aspirated. The following steps included addition on FlexDrop dispenser of 200 μl of hypotonic solution (0.075 M potassium chloride), 200 μl of fixative (3:1 methanol:acetic acid) followed by mixing three times on JANUS and centrifugation after each dispense step according to the scheme shown in Fig. 3. Next, samples were transferred to two imaging glass bottom 96-well plates (Brooks Automation Inc., Chelmsford, MA) preloaded with 300 μl of fixative (10:1 methanol:acetic acid), centrifuged, aspirated and allowed to dry for 10 min before staining. Finally, 200 μl of PBS containing 1.5 μg/ml DAPI (4′,6-diamidino-2-phenylindole) (Thermo Fisher Scientific Inc.) was added. Microplates were sealed and stored at 4°C until imaging and analysis.
Imaging and Image Analysis
Prepared imaging microplates were scanned on a commercial General Electric IN Cell Analyzer 2000 system (22). This automated imager is equipped with a large sensor CCD camera (2,048 × 2,048 pixel resolution) that is capable of whole-well imaging in 96- or 384-well microplates at high sensitivity. The IN Cell Analyzer 2000 is equipped with automation for filter, polychroic and objective changing for rapid multi-color imaging.
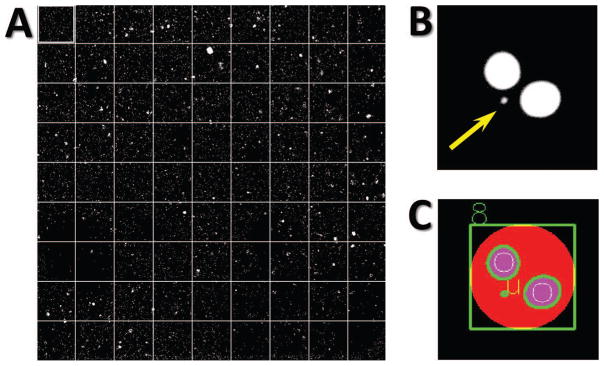
For this work, eighty-one 20× fields, covering an area of 60 mm2 were captured per well (Fig. 4A). Image analysis was performed using FluorQuantMN, a custom-designed software, written in Visual C++ (Microsoft Inc, Redmond, WA) using the OpenCV image analysis libraries. Image analysis is performed by locating all nuclei in the image by first binarizing the log-transformed image using an adaptive thresholding algorithm, which assigns each pixel a value of 1 if its value is significantly larger than pixels in its neighborhood and zero otherwise. Nuclei are then located as binary large objects (BLOBs), using the algorithm of Suzuki and Abe (23) (Fig. 4C). Nuclei are correlated to cells based on their proximity and the number of nuclei of different sizes within a cell is scored. Nuclei with serrated or abnormal morphology as well as overlapping or clumped cells are rejected from the analysis. After initial optimization of the software parameters for a specific cell preparation and staining protocol, the software analyzes sets of images, without human intervention, reporting the number of cells with a given number of main nuclei and micronuclei.
FIG. 4.
Imaging and image analysis. Panel A: A set of 81 images captured by IN CELL Analyzer using 20× objective lens representing one well of 96-well imaging plate with fixed and DAPI-stained sample. Panel B: Cropped image from a well of 96-well imaging plate with a cell with 2 nuclei and micronucleus (yellow arrow) and panel C: the same cell (green circle) with 2 nuclei (magenta circles with green border) and micronucleus (green dot), as delineated by FluorQuantMN.
RESULTS AND DISCUSSION
Sample Collection Kit
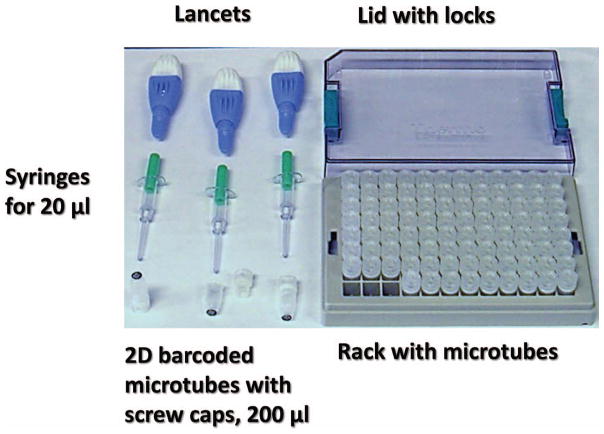
The sample collection kit described previously for the RABiT system (9, 13) was centered on capillary tubes, which are not appropriate for culturing blood. This kit has been updated to include components compatible with a commercial platform (Fig. 5). The custom engraved capillary tubes (9) were replaced with off-the shelf 2D-barcoded tubes organized in the form of 96-well plate ANSI/SLAS format. This use of a standard ANSI/SLAS platform at the stage of blood sample collection allows simplified introduction of the blood samples directly into a commercial robotic system, eliminating the need for a complex customized cell harvesting module (13). In the field, sample collection is performed using a commercial high-flow fingerstick. A measured amount of blood (20 μl) is metered using a micro syringe and loaded into a 2D-barcoded blood culture tube, which has been preloaded with an appropriate amount of cell culture medium. The tubes (96) are then loaded into an ANSI/SLAS footprint rack and transported to the RABiT-II system in a temperature controlled box.
FIG. 5.
Kit for blood sample collection developed for the implementation of the CBMN assay of peripheral human blood lymphocytes on commercial biotech robotic systems.
Sample Preparation
Automated preparation of 96 CBMN assay samples using RABiT-II approach was completed within 1 h starting from the end of cell culturing and ending with sample staining in two 96-well imaging microplates. It is considerably faster in comparison with one day needed for manual preparation of samples using the traditional method based on 5–10 ml blood cultures (21). The throughput of sample preparation for CBMN assay using RABiT-II approach corresponds to more than 2,000 samples per 24 h.
Imaging and Scoring
For high-speed triage purposes IAEA recommends scoring 200 binucleated cells (20), although it was demonstrated that 100 binucleated cells is sufficient to produce accurate dose estimations between 0 and 4.0 Gy (24). Our previously developed protocol (21), based on a 50 μl sample of blood, yielded a dose-dependent average number of binucleated cells between 300 to 1,100 per sample (1,875 mm2) using commercial Metafer 4 software. In contrast, the available area in a microwell of standard plate is much smaller and even a square-profile well only affords about 60 mm2 of surface. This requires increasing cell density while reducing the number of cells per sample. Cell distribution within the well was kept as uniform as possible by optimizing the parameters of the liquid dispensing (25).
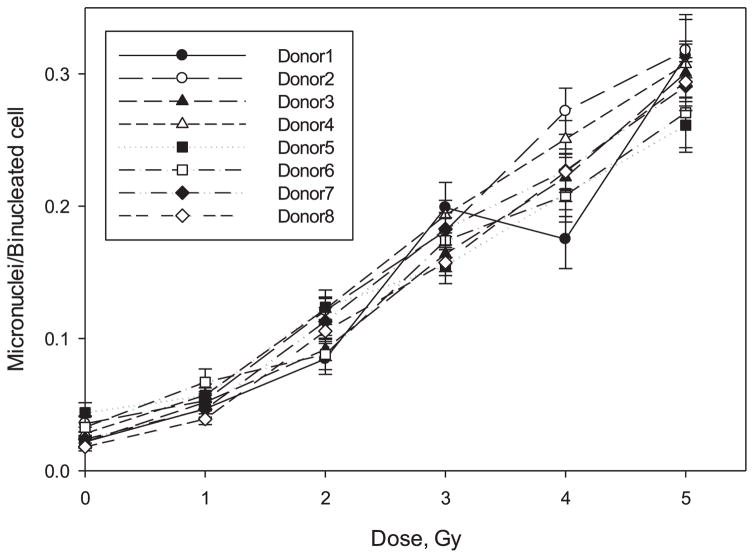
In our RABiT-II assay we reduced the initial blood volume to 20 μl and split the fixed cells between two imaging microplates (Fig. 3). Our software was able to identify on average 500 binucleated cells per sample with more than 100 binucleated cells identified in 95 of the 96 samples analyzed. That corresponds to the average number of detected binucleated cells from our previous work (21), taking into account the difference in the initial volume of blood. One sample (Donor 1, 4.0 Gy) yielded only 69 binucleated cells; however, 285 binucleated lymphocytes were detected by FluorQuantMN software in the duplicate sample. The number of detected binucleated cells in a single well varied from 29 (Donor 1, 4.0 Gy) to 668 (Donor 8, dose 1.0 Gy) with average number 250 binucleated lymphocytes. Dose dependence for all 8 volunteers is shown in Fig. 6.
FIG. 6.
Dose-response curves of the MN yields induced in human lymphocytes (from 8 donors) exposed to gamma rays produced by using automated RABiT-II approach. The error bars represent the upper and lower 95% confidence intervals.
Calibration Curve
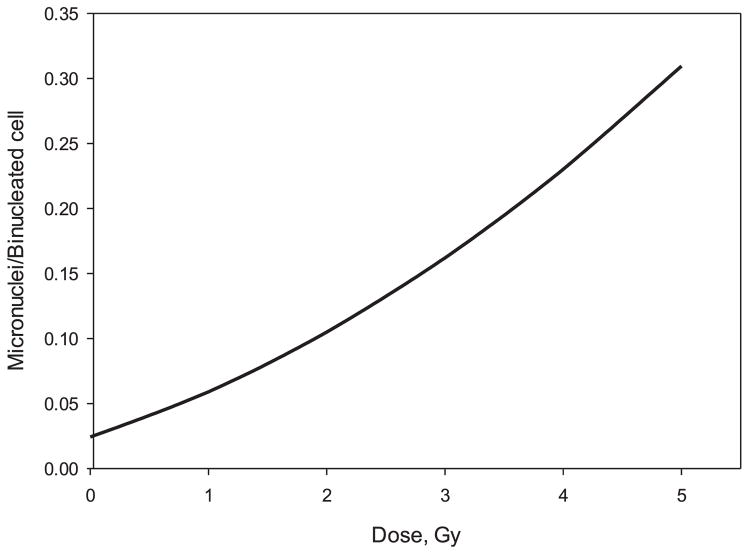
A calibration curve (Fig. 7) was generated based on the data from all donors by pooling the yields for each dose. Between 5,000 and 10,000 binucleated cells per dose and 48,083 cells in total were used to generate this calibration curve. Comparison of the calibration curve (Fig. 7) with the corresponding curve for manual preparation of samples and image analysis of slides using commercial Metafer 4 software (21) shows that the decreased level of micronuclei was detected by the FluorQuantMN software. This could be explained by the low level of false micronuclei (less than 3%) detected by the FluorQuantMN software. It should be noted that the absolute yields of micronuclei depicted in this curve are somewhat lower than the typical values for manual scoring. This is because the imaging and image analysis can miss: 1. Very small micronuclei, which end up as 1–2 pixel BLOBs and are ignored; 2. Micronuclei partially overlapping a nucleus, which a human scorer would identify but an automated system cannot; and 3. Micronuclei, which are out of the imaging plane and would be seen by a human scorer manually adjusting the focus knob, or by using a time consuming z-stack.
FIG. 7.
Fitted linear-quadratic dose-response calibration curve of the MN yields in human lymphocytes for pooled data from 8 healthy donor using our RABiT-II system.
These issues can in principle be alleviated by allowing a human scorer to review the images and override the identification of micronuclei and binucleated cells generated by the software (as is done in the Metasystems platform) but this would defeat the purpose of a fully automated scoring system. Rather, as long as a significant dose response can be obtained with a fully automatic system, the difference in scoring efficiency between the manual and automated systems is largely only of academic interest.
CONCLUSIONS
We have implemented a fully automated micronucleus assay on a commercial HTS/HCS platform. This approach increases the speed of sample processing due to high automation of simultaneous sample preparations during a CBMN assay. The use of full automation is expected to significantly reduce variability in the results as compared to manual processing by removing variations in sample handling and scoring.
The study described here demonstrates that high-throughput radiation biodosimetry is practical using current commercial robotic HTS and imaging systems, which can be readily programmed to perform and analyze robotics-optimized cytogenetic assays.
Application to other commercial HTS and imaging systems beyond the ones used in this study are clearly practical. There is the potential to improve the “time to result” by minimizing the culture time (26). Higher throughput is also possible, for example by using a 10× rather than 20× imaging objective (27) or by using a high-throughput imaging flow-cytometer approach for the imaging steps (26, 28). While the study here was performed for the CBMN assay, extension to other assays such as dicentric chromosomes or γ-H2AX is also practical.
The number of commercial HTS machines in universities, industry and CLIA certified laboratories is rapidly growing, as these systems become more affordable and more multi-functional. The present approach will allow much wider access to high-throughput biodosimetric screening for large-scale radiological incidents than is currently available. Thus, through the drafting of these HTS systems to be available to perform biodosimetry assays following a large scale radiological event, the need for the rapid triage/dosimetric assessment of hundreds of thousands of potentially exposed individuals can be readily met.
Acknowledgments
This work was supported by grant number U19 AI067773, the Center for High-Throughput Minimally-Invasive Radiation Biodosimetry, from the National Institute of Allergy and Infectious Diseases, National Institutes of Health. The content is solely the responsibility of the authors and does not necessarily represent the official views of National Institute of Allergy and Infectious Diseases of the National Institutes of Health. Some of the reagents and plastic ware used in this work were purchased through Fisher Scientific. At the time of writing this manuscript GG owns 90 shares of Thermo Fisher Scientific stock.
Footnotes
American National Standards Institute/Society for Laboratory Automation and Screening.
References
- 1.Beinke C, Port M, Abend M. Automatic versus manual lymphocyte fixation: impact on dose estimation using the cytokinesis-block micronucleus assay. Radiat Environ Biophys. 2015;54:81–90. doi: 10.1007/s00411-014-0575-0. [DOI] [PubMed] [Google Scholar]
- 2.Rothkamm K, Beinke C, Romm H, Badie C, Balagurunathan Y, Barnard S, et al. Comparison of established and emerging biodosimetry assays. Radiat Res. 2013;180:111–9. doi: 10.1667/RR3231.1. [DOI] [PMC free article] [PubMed] [Google Scholar]
- 3.Grace MB, Moyer BR, Prasher J, Cliffer KD, Ramakrishnan N, Kaminski J, et al. Rapid radiation dose assessment for radiological public health emergencies: roles of NIAID and BARDA. Health Phys. 2010;98:172–8. doi: 10.1097/01.HP.0000348001.60905.c0. [DOI] [PubMed] [Google Scholar]
- 4.Blakely WF, Carr Z, Chu MC, Dayal-Drager R, Fujimoto K, Hopmeir M, et al. WHO 1st consultation on the development of a global biodosimetry laboratories network for radiation emergencies (BioDoseNet) Rad Res. 2009;171:127–39. doi: 10.1667/RR1549.1. [DOI] [PubMed] [Google Scholar]
- 5.IAEA Response Assistance Network Incident and Emergency Center: EPR-RANET Technical Document. Vienna: International Atomic Energy Agency; 2006. [Google Scholar]
- 6.Miller SM, Ferrarotto CL, Vlahovich S, Wilkins RC, Boreham DR, Dolling JA. Canadian Cytogenetic Emergency Network (CEN) for biological dosimetry following radiological/nuclear accidents. Int J Radiat Biol. 2007;83:471–7. doi: 10.1080/09553000701370860. [DOI] [PubMed] [Google Scholar]
- 7.Wojcik A, Lloyd D, Romm H, Roy L. Biological dosimetry for triage of casualties in a large-scale radiological emergency:capac-ity of the EU member states. Radiat Prot Dosimetry. 2010;138:397–401. doi: 10.1093/rpd/ncp279. [DOI] [PubMed] [Google Scholar]
- 8.Garty G, Turner HC, Salerno A, Bertucci A, Zhang J, Chen Y, et al. The decade of the RABiT (2005–15) Radiat Prot Dosimetry. 2016;172:201–6. doi: 10.1093/rpd/ncw172. [DOI] [PMC free article] [PubMed] [Google Scholar]
- 9.Garty G, Karam PA, Brenner DJ. Infrastructure to support ultra high throughput biodosimetry screening after a radiological event. Int J Radiat Biol. 2011;87:754–65. doi: 10.3109/09553002.2011.583317. [DOI] [PMC free article] [PubMed] [Google Scholar]
- 10.Garty G, Chen Y, Salerno A, Turner H, Zhang J, Lyulko O, et al. The RABIT: a rapid automated biodosimetry tool for radiological triage. Health Phys. 2010;98:209–17. doi: 10.1097/HP.0b013e3181ab3cb6. [DOI] [PMC free article] [PubMed] [Google Scholar]
- 11.Turner HC, Brenner DJ, Chen Y, Bertucci A, Zhang J, Wang H, et al. Adapting the γ-H2AX assay for automated processing in human lymphocytes. 1. Technological aspects. Radiat Res. 2011;175:282–90. doi: 10.1667/RR2125.1. [DOI] [PMC free article] [PubMed] [Google Scholar]
- 12.Turner HC, Sharma P, Perrier JR, Bertucci A, Smilenov L, Johnson G, et al. The RABiT: high-throughput technology for assessing global DSB repair. Radiat Envir Biophys. 2014;53:265–72. doi: 10.1007/s00411-014-0514-0. [DOI] [PMC free article] [PubMed] [Google Scholar]
- 13.Garty G, Chen Y, Turner H, Zhang J, Lyulko OV, Bertucci A, et al. The RABiT: A rapid automated biodosimetry tool for radiological triage II. Technological developments. Int J Radiat Biol. 2011;87:776–90. doi: 10.3109/09553002.2011.573612. [DOI] [PMC free article] [PubMed] [Google Scholar]
- 14.Repin M, Turner HC, Garty G, Brenner DJ. Next generation platforms for high-throughput biodosimetry. Radiat Prot Dosimetry. 2014;159:105–10. doi: 10.1093/rpd/ncu161. [DOI] [PMC free article] [PubMed] [Google Scholar]
- 15.Dove A. High-throughput screening goes to school. Nat Meth. 2007;4:523–32. [Google Scholar]
- 16.Michael S. A Robotic platform for quantitative high-throughput screening. Assay Drug Development Tech. 2008;6:637–57. doi: 10.1089/adt.2008.150. [DOI] [PMC free article] [PubMed] [Google Scholar]
- 17.Janzen William P. Screening Technologies for small molecule discovery: The state of the art. Chem Biol. 2014;21:1162–70. doi: 10.1016/j.chembiol.2014.07.015. [DOI] [PubMed] [Google Scholar]
- 18.Macarron R, Banks MN, Bojanic D, Burns DJ, Cirovic DA, Garyantes T, et al. Impact of high-throughput screening in biomedical research. Nat Rev Drug Discov. 2011;10:188–95. doi: 10.1038/nrd3368. [DOI] [PubMed] [Google Scholar]
- 19.Fenech M. Cytokinesis-block micronucleus cytome assay. Nat Protoc. 2007;2:1084–104. doi: 10.1038/nprot.2007.77. [DOI] [PubMed] [Google Scholar]
- 20.IAEA, International Atomic Energy Agency. IAEA Emergency Preparedness and Response Series. Vienna: 2011. Cytogenetic dosimetry: applications in preparedness for and response to radiation emergencies. [Google Scholar]
- 21.Lue SW, Repin M, Mahnke R, Brenner DJ. Development of a high-throughput and miniaturized cytokinesis-block micronucleus assay for use as a biological dosimetry population triage tool. Radiat Res. 2015;184:134–42. doi: 10.1667/rr13991.1. [DOI] [PMC free article] [PubMed] [Google Scholar]
- 22.Radu C, Adrar HS, Alamir A, Hatherley I, Trinh T, Djaballah H. Designs and concept reliance of a fully automated high-content screening platform. J Lab Autom. 2012;17:359–69. doi: 10.1177/2211068212453311. [DOI] [PMC free article] [PubMed] [Google Scholar]
- 23.Suzuki S, Abe K. Topological structural analysis of digitized binary images by border following. Comp Vision Graphics Image Proc. 1985;29:396. [Google Scholar]
- 24.De Amicis A, De Sanctis S, Di Cristofaro S, Franchini V, Regalbuto E, Mammana G, et al. Dose estimation using dicentric chromosome assay and cytokinesis block micronucleus assay: comparison between manual and automated scoring in triage mode. Health Phys. 2014;106:787–97. doi: 10.1097/HP.0000000000000097. [DOI] [PubMed] [Google Scholar]
- 25.Bian D, Tsui JC, Repin M, Garty G, Turner H, Lawrence Yao Y, et al. Liquid handling optimization in high-throughput biodosimetry tool. J Med Devices. 2016;10:0410071–710. doi: 10.1115/1.4033600. [DOI] [PMC free article] [PubMed] [Google Scholar]
- 26.Rodrigues MA, Probst CE, Beaton-Green LA, Wilkins RC. The effect of an optimized imaging flow cytometry analysis template on sample throughput in the reduced culture cytokinesis-block micronucleus assay. Radiat Prot Dosimetry. 2016;89:653–62. doi: 10.1093/rpd/ncw160. [DOI] [PubMed] [Google Scholar]
- 27.Lyulko OV, Garty G, Randers-Pehrson G, Turner HC, Szolc B, Brenner DJ. Fast image analysis for the micronucleus assay in a fully automated high-throughput biodosimetry system. Radiat Res. 2014;181:146–61. doi: 10.1667/RR13441.1. [DOI] [PMC free article] [PubMed] [Google Scholar]
- 28.Rodrigues MA, Beaton-Green LA, Wilkins RC. Validation of the cytokinesis-block micronucleus assay using imaging flow cytom-etry for high throughput radiation biodosimetry. Health Phys. 2016;110:29–36. doi: 10.1097/HP.0000000000000371. [DOI] [PubMed] [Google Scholar]


