

Abstract
Background
Post-transcriptional control of gene expression mediated by small regulatory RNAs (sRNAs) is vital for growth and development of diverse organisms. The biogenesis of sRNAs is regulated by both positive and negative regulators known to regulate photomorphogenic development. Two microRNAs (miRNAs), miR157 and miR319, also regulate photomorphogenesis. However, genome-wide profiling of sRNAs and their regulation of target genes during photomorphogenesis has been missing. We provide a comprehensive view of sRNA-controlled gene expression in this developmental process.
Results
By profiling sRNAs and the 5′ ends of degraded mRNAs during the first 24 h of photomorphogenic development in Arabidopsis, we identified 335 sRNA-mediated mRNA cleavage events in de-etiolating seedlings. These cleavage events are primarily resulted from actions of highly expressed miRNAs and irrelevant to the abundance of target mRNAs. In the light, the expression of the slicer protein gene ARGONAUTE1 in the miRNA functioning pathway could be fine-tuned by miRNA168a/b. We also found that miR396a/b positively regulates de-etiolation by suppressing GROWTH REGULATING FACTORs. Our results suggest that the miRNAs are required to tune down the target mRNAs and regulate photomorphogenesis.
Conclusion
sRNAs may have a broad impact on gene expression regulation for optimized photomorphogenic development. With both positive and negative regulators under the control of sRNAs, young Arabidopsis seedlings can have a timely but not exaggerated developmental adaptation to light.
Electronic supplementary material
The online version of this article (doi:10.1186/s12864-017-3937-6) contains supplementary material, which is available to authorized users.
Keywords: Light, Small regulatory RNA, Post-transcriptional regulation, Photomorphogenesis
Background
Plants have evolved a plethora of morphological alterations to adapt to their surroundings. Photomorphogenesis, or de-etiolation, is one such process when seedlings first experience light irradiation. The rate of hypocotyl elongation decreases in seedlings under light exposure, which allows for the formation of firm structural support for seedlings emerging from the soil surface. Also, the cotyledons open and expand to maximize the area of light perception and to expose the shoot apical meristem for the development of true leaves. Light also triggers the development of chloroplasts for photosynthesis so that plants can utilize light energy for autotrophic growth and development [1–3].
In Arabidopsis, photomorphogenesis is under the control of at least three types of photoreceptors, including the red (R)–far-red (FR) light photoreceptor phytochromes (phys), blue light (B) photoreceptor cryptochromes (crys) and the UV-B photoreceptor, UVR8 [3–8]. The perceived light signals trigger signaling cascades that reprogram gene expression for photomorphogenic development. Transcriptional profiling for Arabidopsis seedlings exposed to B, FR, R light and the light–dark transition have revealed differential expression of approximately one-third of the genome [9]. The light-regulated genome-wide transcriptomic adjustment requires the actions of transcription factors. One of the most well-characterized transcription factors conveying light signals to changes of gene expression is ELONGATED-HYPOCOTYL 5 (HY5). HY5 is a light-regulated bZIP transcription factor that upregulates the expression of many light-responsive genes during de-etiolation [10]. In addition to activating transcription, light also enhances the translational efficiency of thousands of genes, especially those committed to the translation apparatus and chloroplast functions [11, 12].
Plant small regulatory RNAs (sRNAs) are 20 to 24 nt long and can be classified into microRNAs (miRNAs) and small interfering RNAs (siRNAs) primarily according to different modes of biogenesis. MiRNAs originate from stem-loop structures of primary transcripts, and siRNAs are mostly derived from double-stranded RNAs [13]. Phased siRNAs (phasiRNAs) are a special group of siRNAs generated from mRNAs cleaved by 22-nt miRNAs or siRNAs [14–16]. Plant miRNAs can mediate the cleavage or translation inhibition of target mRNAs, whereas siRNAs function via RNA-dependent DNA methylation (RdDM) for transcriptional gene silencing or post-transcriptional target mRNA cleavage [17–22].
Previous studies have implied that sRNAs are involved in gene expression regulation during de-etiolation. Mutants defective in genes for miRNA biogenesis and functions have altered light responses. For example, in Arabidopsis, light hypersensitive phenotypes have been observed to carry mutations in the miRNA processor HYPONASTIC LEAVES 1 (HYL1), the sRNA methyltransferase HUA ENHANCER1 (HEN1), the sRNA transporter HASTY (HST), and the slicer protein ARGONAUTE1 (AGO1) [23–25]. A negative regulator of photomorphogenesis, CONSTITUTIVE PHOTOMORPHOGENESIS 1 (COP1), can protect HYL1 against degradation, thereby leading to a stabilized miRNA pool [26]. Transcripts of the positive regulator HY5 and negative regulator TEOSINTE BRANCHED 1, CYCLOIDEA AND PCF TRANSCRIPTION FACTORs (TCPs) of photomorphogenesis were shown to be under regulation by miR157d and miR319, respectively [25]. In addition, HY5 was found to bind to promoter regions of at least 8 miRNAs (MIR) loci and required for the accumulation of miR156d, miR402, miR408, miR775 and miR858 [27]. These studies provide a glimpse into photomorphogenic development shaped by the actions of a few sRNAs. A global investigation of sRNAs and their targets would greatly help in assessing the impact of post-transcriptional regulation in photomorphogenic development. However, such information is currently missing in de-etiolating seedlings.
In this study, we profiled sRNAs at 6 times during the first 24 h of Arabidopsis photomorphogenic development. We also sequenced 5′ ends of degraded mRNAs (degradome) in both dark- and light-grown seedlings to reveal sRNA-mediated cleavage of mRNAs during de-etiolation. Pairwise studies of sRNAs and their target mRNAs indicated that a high sRNA-to-target ratio is a key determinant for successful mRNA target repression by sRNAs. The high ratio is mainly contributed by the abundance of sRNAs. A total of 335 sRNA-target mRNA regulatory pairs were identified in de-etiolating seedlings, with several sRNAs demonstrated to regulate photomorphogenesis. The action of miR168 leads to reduced expression of AGO1 under light, thereby offering a feedback regulation of miRNA functioning during de-etiolation. miR396 were identified to act as positive regulators of photomorphogenesis. In addition, we revealed that some 24-nt siRNAs had potential to cause target cleavage in de-etiolating seedlings. Our data indicate that sRNAs function in multiple regulatory circuits for optimized seedling growth under light illumination.
Results
The expression and actions of small RNAs in de-etiolating Arabidopsis seedlings
We first used deep sequencing to survey the sRNAs in de-etiolating Arabidopsis seedlings. The sRNAs were isolated from 4-d-old dark-grown (W0 h) seedlings and seedlings that were further treated with continuous white light irradiation for 1 to 24 h (W1 h to W24 h) and subjected to deep sequencing (Fig. 1). Approximately 18–22 million reads were obtained for each sample in 3 biological replicates. For each dataset, 94–98% of the filtered reads (see methods) could be mapped to the TAIR10 genome (Additional file 1: Table S1). We first analyzed miRNAs and phasiRNAs, as they are frequently studied groups of plant sRNAs. Among the 427 Arabidopsis miRNAs annotated in miRBase 21 [28], 207 (48.5%) are considered expressed (see methods for criteria) (Additional file 1: Table S2). Overall 58 phasiRNAs derived from 12 phasiRNA-generating loci (PHAS, or trans-acting siRNA-generating loci, TAS) [14] were expressed in de-etiolating seedlings (Table 1 and Additional file 1: Table S3). In addition to miRNAs and phasiRNAs, 4255 20–24 nt siRNAs were defined expressed in this developmental stage (Additional file 1: Table S4).
Fig. 1.

Pipeline for investigating sRNA-mediated regulation in de-etiolating Arabidopsis seedlings. Four-d-old dark-grown seedlings (W0 h) were exposed to continuous white light (W; 100 μE) for 1, 3, 6, 12 and 24 h; 18–22 million (M) reads per library were acquired. Degradome sequencing for dark- (Dark) and light- (equally pooled from the five light-treated time points) grown seedlings were used for identifying sRNA-mediated cleavage of target mRNA. Colored numbers in parentheses indicate the number of sRNAs/targets passing the corresponding filtering criteria
Table 1.
Expressed PHAS loci in de-etiolating seedlings
| PHAS locus | Gene | Chromosome | phasiR trigger | Start | End | n | k | p-value |
|---|---|---|---|---|---|---|---|---|
| At1g62910 | RFL9 (PPR) | 1 | TAS2 3′-D6 (−) | 23,299,624 | 23,299,875 | 77 | 14 | 2.0 × 10⁻⁷ |
| At1g63130 | RPF6 | 1 | ta-siR2140 | 23,413,391 | 23,413,642 | 13 | 7 | 7.3 × 10⁻⁷ |
| At1g50055 | TAS1B | 1 | miR173 | 18,549,441 | 18,549,692 | 60 | 12 | 9.7 × 10⁻⁷ |
| At1g63070 | PPR | 1 | ta-siR2140 | 23,386,420 | 23,386,671 | 50 | 11 | 1.3 × 10⁻⁶ |
| At1g63150 | * | 1 | TAS2 3′-D6 (−) | 23,420,003 | 23,420,254 | 80 | 12 | 2.7 × 10⁻⁵ |
| At1g62930 | RPF3 (PPR) | 1 | miR161.1 | 23,307,125 | 23,307,466 | 99 | 13 | 4.5 × 10⁻⁵ |
| At1g63080 | PPR | 1 | ta-siR2140 | 23,389,990 | 23,390,241 | 58 | 10 | 5.5 × 10⁻⁵ |
| At1g62590 | PPR-AC | 1 | TAS2 3′-D6 (−) | 23,178,438 | 23,178,689 | 27 | 7 | 7.1 × 10⁻⁵ |
| At2g39681 | TAS2 | 2 | miR173 | 16,539,919 | 16,540,170 | 12 | 9 | 1.9 × 10⁻⁹ |
| At2g39675 | TAS1C | 2 | miR173 | 16,537,860 | 16,538,111 | 10 | 7 | 1.5 × 10⁻⁸ |
| At2g27400 | TAS1A | 2 | miR173 | 11,722,009 | 11,722,260 | 21 | 8 | 6.2 × 10⁻⁷ |
| At3g17185 | TAS3 | 3 | miR390 | 5,682,143 | 5,682,394 | 80 | 14 | 3.4 × 10⁻⁷ |
n: Number of distinct alignments
k: Number of phased alignments, based on hypergeometric distribution
*: Reported PHAS locus
Loci with p < 10−4 are listed
Since both miRNAs and siRNAs can target mRNAs for cleavage [19, 29–31], we aimed to identify sRNA–target pairs that may be involved in photomorphogenic development. We performed degradome sequencing followed by CleaveLand analyses [32] to identify target mRNAs cleaved by expressed sRNAs in de-etiolating seedlings. The degraded mRNA samples were obtained from seedlings grown under dark (W0 h) or light (equally mixed from samples treated with W for 1, 3, 6, 12 and 24 h). Approximately 50 million reads for each of the libraries were obtained; 81–85% could be mapped to TAIR10 cDNAs (Additional file 1: Table S1). Our analyses suggested that 262 non-redundant sRNAs could mediate the cleavage of 306 Arabidopsis mRNAs (a total of 335 target cleavage sites). Among them, 142 cleavage events were mediated by miRNAs, 13 by phasiRNAs and 180 by other siRNAs (Fig. 1; Additional file 1: Table S5 and S6). These newly identified sRNA-target pairs are potential players in post-transcriptional gene expression regulation in Arabidopsis photomorphogenesis.
sRNA abundance determines the likelihood of target mRNA cleavage
When analyzing the mRNA degradomes, we noticed that although 90 miRNA families were expressed in de-etiolating seedlings (Additional file 1: Table S2), target cleavage was detected for only members of 49 miRNA families (Additional file 1: Table S5). The results prompted us to investigate factors affecting target cleavage or the identification of degradome signatures. Previous reports have shown that high target abundance will compromise the repression activity of miRNAs and siRNAs when introduced via transfection in animal cell lines [33]. A computational model based on fixed concentration of miRNAs and mRNAs implicated that the concentration of miRNAs has a greater effect on miRNA-mRNA interaction in Drosophila melanogaster and in human [34]. In contrast to the seed pairing seen in most animal miRNA-mRNA interactions, most plant miRNAs interact with their target mRNAs at high complementarity that leads to cleavage of target mRNAs [19]. The availability of transcriptome data for mRNAs [12], sRNAs and degradome signatures in this study allowed us to investigate whether miRNAs/siRNAs or target abundance is important for effective miRNA/siRNA-mediated target cleavage in de-etiolating Arabidopsis seedlings.
Our analysis indicated that miRNAs causing target cleavage tended to have higher abundance, as compared with miRNAs that failed to generate detectable target degradome signatures (Fig. 2a). The results were similar for miRNAs expressed in both the dark (p = 5.2 × 10⁻⁸, D = 0.4327 in Kolmogorov-Smirnov test, K-S test) and light (p = 3.0 × 10⁻⁸, D = 0.4394, K-S test) (Fig. 2a). In contrast, for mRNAs with predicted miRNA target sites, the transcript abundance was comparable for mRNAs with or without degradome signatures identified (Fig. 2b). Pair-wise examination of miRNA-to-target ratios revealed relatively higher ratios for miRNA-mRNA pairs with observed cleavage under both dark (p = 1.3 × 10⁻¹², D = 0.4108, K-S test) and light (p = 2.5 × 10⁻¹², D = 0.4067, K-S test) (Fig. 2c). Therefore, miRNAs with high abundance may give rise to high miRNA-to-target ratios, thereby leading to successful target mRNA cleavage.
Fig. 2.

The miRNA abundance, rather than target mRNA abundance, is the major determinant of target cleavage. a miRNAs causing target cleavage tend to have higher abundance. Kolmogorov-Smirnov (KS) plot showing the abundance of expressed miRNAs in dark and light (W3 h). + Degradome (red) indicates miRNAs with valid target cleavages identified; − degradome (black) indicates expressed miRNAs without target cleavage identified. Dashed lines indicate 50th percentile of sRNAs. b Target mRNA abundance was relatively unchanged regardless of being cleaved. KS plot showing the abundance of target mRNA with (green) or without (black) degradome signatures under dark or light (W4 h). Only expressed target genes with RPKM > 0.01 were plotted. c Degradome signatures were preferentially detected in mRNAs with high miRNA-to-target ratios. KS plot showing distribution of pairwise miRNA-to-target ratios in dark and light (W3 h/W4 h). + Degradome (orange) indicates miRNA–target pairs with target cleavage identified; − degradome (black) indicates miRNA–target pairs without target cleavage identified. d The abundance is relatively lower for siRNAs than expressed miRNAs. e Target mRNAs, but not miRNAs, are downregulated by light. Light/dark ratios indicate the relative levels of miRNAs (W3 h/W0 h) and mRNAs (W4 h/W0 h). + and – degradome indicate miRNAs/targets with or without identified degradome signatures, respectively. Data are the mean of all biological replicates (three replicates for sRNAs and two for mRNAs). * p < 0.01 by Student’s t-test. The bottom, middle, and top of the box represent the 25th, 50th, and 75th percentiles, and whiskers are the 10th and 90th percentiles, respectively
The above notion remains true when applied to siRNA-mediated mRNA cleavage (Additional file 2: Figure S1), although not as significant as for miRNAs (Fig. 2a). Among the 4255 expressed siRNAs, only 180 have degradome signatures identified for their target mRNAs (Additional file 1: Table S6), as compared with 155 targets resulting from 265 miRNA/phasiRNA-mediated cleavages (Additional file 1: Table S5), possibly because of the significantly lower expression of most siRNAs than miRNAs (Fig. 2d).
Although the expression of most of the miRNAs remained unchanged before and after light treatment, light appears to down-regulate the expression of target mRNAs with degradome signatures but not that of mRNAs without evidence of cleavage (Fig. 2e). Therefore, instead of regulating miRNA expression, light signals may potentiate the target-cleavage activities of miRNAs to tune down the expression of their target genes during de-etiolation. Whether this reduction is achieved by regulating the expression or enzymatic activities of slicer complexes remains to be investigated.
Light optimizes miRNA functioning via the action of miR168
Previously, we reported a feedback regulation between HY5 and HEN1, which indicates that an sRNA equilibrium is required during photomorphogenic development [25]. Here, we sought to identify whether light regulates steps in addition to HEN1 in sRNA biogenesis and functioning. In Arabidopsis, miR168 targets the sRNA slicer gene AGO1 [35]. Deep sequencing and northern blot results indicated that the expression pattern of miR168 only slightly fluctuated under light (Fig. 3a, b). However, the mean abundance of miR168a/b ranged from 880 to 1270 read per million reads (RPM) (Additional file 1: Table S2), which is more than 10 times greater than the median level of miRNAs overall (Fig. 2a). Thus, miR168a/b has high potential in mediating the cleavage of AGO1 transcript. Indeed, under light, AGO1 cleavage signatures could be detected (Additional file 1: Table S5), which led to the down-regulation of AGO1 (Fig. 3c). The detection of AGO1 cleavage signature only under light is also consistent with preferential light-mediated downregulation of miRNA target mRNAs (Fig. 2e). Thus, miR168a/b have potential to desensitize the sRNA actions by targeting AGO1 for degradation during photomorphogenesis.
Fig. 3.

The expression of miR168 and AGO1 in de-etiolating Arabidopsis. a Expression pattern of miR168. Data are mean ± SD from three biological replicates of sRNA sequencing. b Northern blot analysis of miR168 level during the times examined. Data are mean ± SD are calculated from three biological replicates. SYBR-gold stained rRNA/tRNA was a loading control. c Light down regulates AGO1. qRT-PCR results were shown as mean ± SD calculated from three technical repeats. Asterisks indicate p < 0.01 in Student’s t-test. Three biological replicates have shown similar results
Light regulates the expression of some miRNAs and phasiRNAs
Although most miRNA levels were unchanged before and after light treatment in young Arabidopsis seedlings (Fig. 2d; Additional file 1: Table S2), we still observed that 32% (67 of 207) of expressed miRNAs were regulated by light (Fig. 4; Additional file 1: Table S2). Only 8 of 58 expressed phasiRNAs were differentially regulated by light (Additional file 1: Table S3). Because sRNA abundance is a major determinant for target cleavage in seedlings (Fig. 2), any changes in sRNA levels under light may alter their target suppression capacity. Thus, the light regulation of miRNAs and phasiRNAs may provide a timely control of target mRNAs to shape photomorphogenic development. The light responsiveness of the 67 light-regulated miRNAs could be classified into 3 major clusters by k-mean clustering (Fig. 4; Table 2). miR163 belongs to cluster I, whose expression is barely detectable in the dark but is rapidly induced by light. miR163 has been shown to promote seed germination and primary root growth during early seedling development, but not involved in light-induced inhibition of hypocotyl elongation [36]. Cluster II miRNAs are also upregulated by light, and the up regulation is more prominent after prolonged light exposure. The miRNAs in cluster II include miR157d, reported to target HY5 during photomorphogenic development [25]. The miRNAs in cluster III were down regulated by light, especially after 6-h light exposure.
Fig. 4.
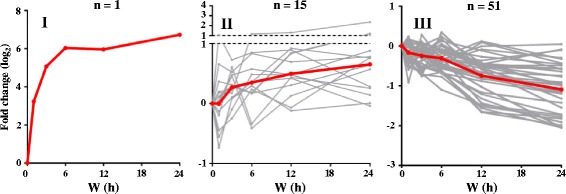
Cluster analysis of light-regulated miRNAs. Student’s t-test was performed to identify miRNAs with significant fold changes against dark (W0 h). The expression patterns of miRNAs in response to light treatments were classified into four clusters by use of k-mean clustering (by Euclidean distance). Gray lines indicate the average fold change of each miRNA from three biological replicates; red lines indicate average fold changes within the cluster
Table 2.
Differentially expressed miRNAs in de-etiolating Arabidopsis seedlings, with average log2 fold-change listed
| Cluster I | W0 h | W1 h | W3 h | W6 h | W12 h | W24 h |
| miR163 | 0 | 3.230582 | 5.070049 | 6.036598 | 5.963276 | 6.724631 |
| Cluster II | W0 h | W1 h | W3 h | W6 h | W12 h | W24 h |
| miR5026 | 0 | −0.19729 | 0.609021 | −0.33921 | 0.435821 | 0.256526 |
| miR825 | 0 | −0.55657 | −0.0974 | 0.484967 | 0.475439 | 0.143117 |
| miR869.2 | 0 | −0.44551 | −0.24714 | 0.236649 | −0.06937 | 0.766993 |
| miR156c-3p | 0 | 0.008901 | 0.458674 | −0.41258 | 0.129615 | 0.571201 |
| miR170-3p | 0 | 0.199128 | 0.233507 | 0.359504 | 0.420726 | −0.0398 |
| miR2933a | 0 | −0.73393 | 0.087544 | 0.296233 | −0.12048 | 0.00611 |
| miR2933b | 0 | −0.73393 | 0.087544 | 0.296233 | −0.12048 | 0.00611 |
| miR5642a | 0 | −0.12856 | 0.102902 | 0.354152 | 0.920248 | 0.760898 |
| miR157d | 0 | 0.366314 | 0.311192 | 0.17222 | 0.304513 | 0.640368 |
| miR167a-3p | 0 | 0.046902 | 0.474899 | 0.574704 | 0.480747 | 0.881156 |
| miR833b | 0 | 1.053165 | 0.727714 | 0.849033 | 0.892631 | 0.279323 |
| miR858a | 0 | 0.657713 | 0.522465 | 0.833586 | 0.69362 | 0.780516 |
| miR157a-3p | 0 | 0.119139 | 0.300398 | 0.181048 | 0.842913 | 1.197978 |
| miR157b-3p | 0 | 0.112265 | 0.292249 | 0.169389 | 0.833254 | 1.186319 |
| miR157c-3p | 0 | 0.18009 | 0.174448 | 1.165619 | 1.299035 | 2.35774 |
| Cluster III | W0 h | W1 h | W3 h | W6 h | W12 h | W24 h |
| miR158b | 0 | 0.068148 | −0.23119 | 0.046673 | −0.49671 | −0.77436 |
| miR162a-3p | 0 | 0.216902 | −0.35089 | −0.001 | −0.53321 | −1.32163 |
| miR390a-5p | 0 | 0.041912 | −0.24039 | −0.52191 | −0.83531 | −0.94731 |
| miR398c-3p | 0 | 0.233205 | −0.74225 | 0.337007 | −0.5905 | −1.54736 |
| miR399b | 0 | −0.32628 | −0.03547 | −0.57065 | −0.81218 | −1.16872 |
| miR399c-3p | 0 | −0.13086 | 0.021596 | −0.5015 | −0.75814 | −1.10903 |
| miR829-3p.1 | 0 | −0.19326 | −0.0353 | −0.14504 | −0.74384 | −0.90991 |
| miR829-5p | 0 | 0.017165 | −0.29223 | −0.32674 | −0.66067 | −0.74456 |
| miR162b-3p | 0 | 0.215734 | −0.35239 | −0.00193 | −0.53434 | −1.32203 |
| miR162b-5p | 0 | 0.057888 | −0.1911 | 0.175723 | −0.742 | −1.07194 |
| miR169a-3p | 0 | −0.35672 | −0.10399 | −0.09992 | −0.43079 | −0.99436 |
| miR173-5p | 0 | −0.04189 | −0.26578 | −0.30136 | −0.5118 | −0.95313 |
| miR390b-5p | 0 | 0.041759 | −0.2396 | −0.52135 | −0.83081 | −0.94673 |
| miR396b-3p | 0 | −0.19923 | −0.26739 | −0.52009 | −0.66862 | −1.11049 |
| miR398b-3p | 0 | 0.233205 | −0.74225 | 0.337007 | −0.5905 | −1.54736 |
| miR823 | 0 | −0.25067 | 0.109541 | −0.45625 | −0.76484 | −0.99271 |
| miR839-5p | 0 | −0.9158 | 0.276875 | −0.35478 | −0.56659 | −1.1664 |
| miR166a-3p | 0 | 0.141355 | 0.079493 | −0.11147 | −0.50323 | −0.56368 |
| miR166b-3p | 0 | 0.158125 | 0.078693 | −0.10249 | −0.52608 | −0.57401 |
| miR166c | 0 | 0.157754 | 0.078204 | −0.10279 | −0.52633 | −0.57431 |
| miR166d | 0 | 0.1578 | 0.078219 | −0.1028 | −0.52637 | −0.5743 |
| miR166e-3p | 0 | 0.157828 | 0.07835 | −0.10235 | −0.52615 | −0.57403 |
| miR166f | 0 | 0.157829 | 0.078349 | −0.10233 | −0.5261 | −0.574 |
| miR166g | 0 | 0.157513 | 0.077882 | −0.10266 | −0.52644 | −0.57431 |
| miR169b-3p | 0 | 0.046702 | 0.084603 | −0.51457 | 0.08493 | −0.43209 |
| miR169i | 0 | −0.21387 | 0.036407 | −0.3923 | −0.08524 | −0.29972 |
| miR171c-5p | 0 | −0.24785 | −0.51146 | −0.30205 | −0.45579 | −0.08671 |
| miR319b | 0 | 0.101478 | 0.007334 | 0.230599 | −0.43223 | −0.64435 |
| miR393b-3p | 0 | −0.22189 | −0.24646 | −0.14695 | −0.49096 | −0.49076 |
| miR408-3p | 0 | −0.24897 | −0.16535 | 0.122217 | −0.11517 | −0.57962 |
| miR5644 | 0 | −0.46437 | −0.21745 | −0.08393 | −0.26968 | −0.45617 |
| miR156h | 0 | −0.44634 | −0.37253 | −0.19148 | −0.36689 | −0.10394 |
| miR160c-3p | 0 | −0.17658 | −0.29051 | −0.33976 | −0.00825 | 0.041016 |
| miR169m | 0 | −0.12627 | 0.064869 | −0.27125 | 0.118007 | −0.32789 |
| miR166a-5p | 0 | −0.14566 | −0.30587 | −0.69082 | −1.16879 | −1.42452 |
| miR395e | 0 | −0.52798 | −0.63659 | −0.291 | −1.43631 | −1.91425 |
| miR5646 | 0 | −0.55674 | −0.18855 | −0.6301 | −1.65092 | −1.82573 |
| miR166b-5p | 0 | −0.14566 | −0.30587 | −0.69082 | −1.16879 | −1.42452 |
| miR166e-5p | 0 | −0.49789 | −0.68724 | −1.10023 | −1.47964 | −1.73891 |
| miR390b-3p | 0 | −0.32255 | −0.76324 | −0.65686 | −1.66625 | −1.99135 |
| miR395a | 0 | −0.52798 | −0.63659 | −0.29058 | −1.43631 | −1.91425 |
| miR395b | 0 | −0.30231 | −0.53107 | −0.43895 | −1.02895 | −2.04242 |
| miR395c | 0 | −0.30231 | −0.53107 | −0.43895 | −1.02895 | −2.04242 |
| miR395d | 0 | −0.52798 | −0.63659 | −0.29058 | −1.43631 | −1.91425 |
| miR395f | 0 | −0.30231 | −0.57998 | −0.43895 | −1.02895 | −2.04242 |
| miR396a-3p | 0 | −0.16376 | −0.71517 | −0.7776 | −1.56218 | −2.04976 |
| miR408-5p | 0 | −0.44974 | −0.17004 | −0.65167 | −1.20912 | −1.72316 |
| miR5012 | 0 | −0.37776 | −0.43595 | −0.68763 | −1.5225 | −1.78667 |
| miR5024-3p | 0 | −0.59768 | −0.10816 | −0.63027 | −1.32052 | −2.05354 |
| miR5634 | 0 | −0.19003 | −0.51725 | −0.68077 | −0.88666 | −1.19981 |
miR396 promote photomorphogenesis by tuning GRF levels
In de-etiolating seedlings, the degradome signatures were most frequently found for mRNAs targeted by members in the miR156/157 and miR396 families (Fig. 5a). miR157d directly targets HY5 to desensitize the light signals during photomorphogenesis [25], but the functions of miR396 in photomorphogenic development remain obscure.
Fig. 5.

miRNA families with identified targets and the expression patterns of miR396–GRF regulatory pairs in de-etiolating seedlings. a Expressed miRNA families with predicted (black) or identified (red) target cleavages in de-etiolating Arabidopsis. b Expression of miR396 is transiently upregulated and gradually decreased on W exposure. Data are mean ± SD from three biological replicates of sRNA sequencing. c Northern blot analyses confirmed the expression of miR396 in de-etiolating Arabidopsis. One representative gel image is shown. Data are mean ± SD for the relative expression from three biological replicates. SYBR-Gold-stained rRNA/tRNA was a loading control. d Degradome T-plot marked the miR396-mediated GRF1/GRF2/GRF3/GRF7 mRNA cleavage in de-etiolating seedlings. Red asterisks indicate the degradome signatures detected at expected cleavage sites for GRF1, GRF2, GRF3 and GRF7. e Light regulation of GRF1, GRF2, GRF3 and GRF7. Data are mean ± SD from three technical replicates of one representative qRT-PCR experiment. * p < 0.01 in Student’s t-test. Three biological replicates were performed with similar results
The expression of miR396 was slightly decreased upon light treatment (Fig. 5b and c). miR396 can target 7 GROWTH REGULATING FACTORs (GRFs) [37, 38], and the cleaved signatures of all 7 GRFs were detected in our degradome analysis (Additional file 1: Table S5). GRF1, GRF2, GRF3 and GRF7 showed relatively higher degradome signature reads amongst the GRFs (Fig. 5d), and all showed clear down regulation under light (Fig. 5e). GRF1, GRF2 and GRF3 cooperatively regulate leaf and cotyledon development [39], whereas GRF7 is a transcriptional repressor of abscisic acid and osmotic stress-responsive genes [40]. However, their functions in photomorphogenesis remain unknown.
To assay the regulatory roles of miR396–GRF pairs in photomorphogenesis, we first isolated and analyzed the mir396a single mutant (SALK_064047; Additional file 2: Figure S2a). Although overall miR396 levels were reduced, the phenotypes of the mir396a mutant were indistinguishable from that of the wild type under dark or light (Additional file 2: Fig. S2a and b). Possibly, the residual amount of miR396b in mir396a is sufficient for normal seedling development (Additional file 2: Figure S2a).
Because both miR396a and miR396b can suppress GRFs [38], we sought to simultaneously sequester these two miRNAs by generating target mimicry lines (MIM396) (Fig. 6a). The levels of GRF1, GRF2, GRF3 and GRF7 were indeed increased in two independent MIM396 lines (Fig. 6a). The MIM396 lines showed elongated hypocotyl length under 50 μE white light (Fig. 6b), which suggests that functional miR396 can positively regulate photomorphogenesis. We also examined the hypocotyl lengths of the MIR396A overexpression line (MIR396Aox) [38] and found that light sensitivity was not further exaggerated (Additional file 2: Figure S2c and d), so the endogenous miR396 pool may be at a saturated level for its functions in light responses.
Fig. 6.

miR396 positively regulate photomorphogenesis by suppressing GRF levels. a Illustration of the 35S:MIM396 (MIM396) target mimicry construct. The nucleotides generating a bulge at the miR396 target site is highlighted in red. Minimum free energy (MFE) for MIM396 binding to miR396a and miR396b was calculated by RNAHybrid. The expression of GRF1, GRF2, GRF3 and GRF7 is increased in the two independent MIM396 T4 lines. Data are mean ± SD calculated from three technical replicates. Three biological replicates were performed with similar results. b The MIM396 T4 homozygous lines show long hypocotyl length under W at 50 μE. Data are mean ± SE of hypocotyl length for one representative result. * p < 0.01 by Student’s t-test, n ≥ 30. Three biological replicates were performed with similar results. c The grf1 grf2 grf3 triple mutant and the grf7 single mutant shows shorter hypocotyl than their corresponding wild types, Ws and Col-0, under W and dark conditions, respectively. * p < 0.01 by Student’s t-test, n ≥ 30. Data are one representative result from three biological replicates performed with similar results
To further understand the mechanistic roles of miR396 in photomorphogenesis, we examined the hypocotyl lengths of grf1 grf2 grf3 and grf7 mutants. Compared to wild-type Ws, the grf1 grf2 grf3 triple mutant showed short hypocotyl under 50 μE white light, which indicates that the three GRFs act as negative regulators of photomorphogenesis. In contrast, grf7 showed a short hypocotyl only under dark (Fig. 6c). Together with the quick repression of GRF7 expression by light (Fig. 5e), the major function of GRF7 is likely to promote hypocotyl elongation under dark. In sum, miR396 can act as a positive regulator of hypocotyl elongation by suppressing the negative regulator GRFs.
Varied length and target properties of siRNAs in Arabidopsis seedlings
Among the expressed siRNAs in de-etiolating seedlings, 164 are capable of mediating target cleavage (Additional file 1: Table S6). Among them, 70 (> 40%) are 24 nt long (Fig. 7a), which is quite different from the typical 21- or 22-nt miRNAs/phasiRNAs that mediate target mRNA cleavage [14, 19, 41]. Most target genes with degradome signatures for both miRNAs/phaiRNAs and siRNAs are protein coding genes (Fig. 7b). Intriguingly, 30 cleavage events from the actions of siRNAs were identified from 18 transposable elements (TEs), which is significantly higher than the number targeted by miRNAs/phasiRNAs (p = 3.2 × 10⁻³ by Fisher’s exact test). Most siRNA-targeted transposons are in the gypsy-like retrotransposon and CACTA-like transposase family. Eleven sRNAs that mediate TE mRNA cleavage are also derived from annotated TEs, with 4 sRNAs derived from their target loci (Additional file 1: Table S6), so these TEs may be capable of self-suppressing through TE-derived siRNAs and self-targeted cleavage. Among the 30 cleavage events derived from TE mRNAs, 23 potentially resulted from cleavage mediated by 24-nt siRNAs. The 24-nt siRNAs derived from transposable elements can mediate silencing of their original transposable elements via RNA-dependent DNA methylation (RdDM) [17, 18]. Our results suggest that in addition to RdDM, siRNA-mediated cleavage may function as an additional mechanism to prevent TE mRNA accumulation, which may escape from incomplete RdDM.
Fig. 7.

siRNA sizes and target gene features in de-etiolating seedlings. a Length distribution of sRNAs with targeted cleavage signatures identified (red and green). b Categorization of mRNAs with degradome signatures from targeted cleavage by miRNAs/phasiRNAs or siRNAs
Discussion
Light regulates miRNA-target pairs in photomorphogenic development
In addition to the previously discovered miR157d–HY5 and miR319–TCP pairs [25], we found additional miRNA–target pairs that positively regulate photomorphogenesis. In this study, miR168 could tune down AGO1 level under light (Fig. 3), which can counteract the actions of sRNAs stabilized by the light-induced HEN1 expression. miR396 can act as positive regulators of photomorphogenesis by suppressing GRF1, GRF2, GRF3 and GRF7. The grf7 mutant shows shorter hypocotyl length under dark, so it may positively regulate hypocotyl elongation under dark. Under light conditions, the grf7 mutant phenotype is comparable to that of the wild type possibly because light also markedly represses GRF7 expression (Fig. 5e, Additional file 1: Table S8).
We cannot rule out that light down-regulates the expression of GRFs at the transcriptional level. However, the detection of the miR396-mediated cleavage events on GRFs (Additional file 2: Table S5) suggested that miR396 indeed functions to optimize the GRF mRNA levels during de-etiolation. GRFs are known as transcription activators [42]; hence, future investigation of GRF downstream genes will help demystify genes regulated by the miR396-GRF lineage and provide a future research direction for their contribution in photomorphogenic development.
sRNAs regulate photomorphogenesis from multiple angles
Our results in Fig. 2 and Additional file 2: Figure S1 showed that abundant sRNAs have a better likelihood of mediating target mRNA cleavage during photomorphogenic development. Also, despite no negative correlation between the expression of miR168/miR396 and their target mRNAs (Figs. 3 and 5), degradome signatures from their target mRNAs were observed (Additional file 1: Table S5, Fig. 5). This finding indicated that although light does not affect the accumulation of miR168 and miR396, these miRNAs can contribute to the expression repression of their target mRNAs in de-etiolating seedlings. The steady-state mRNA transcriptome during photomorphogenic growth likely is a finely orchestrated balance between the well-studied transcriptional regulation by light signals and target mRNA cleavage mediated by small regulatory RNAs as examples shown in this study.
Combined with our previous [25] and current discovery, sRNAs could fine-tune the expression of both positive (HY5) and negative (TCPs, AGO1, GRFs) regulators of photomorphogenesis (Fig. 8). Clearly, as key regulators of these complex and interlocked regulatory circuits, the whole plethora of sRNAs is crucial for an optimal transcriptome during photomorphogenesis. This observation also explains why mutations of single MIR or target gene usually show less prominent phenotypic changes (Fig. 6), as compared with mutants with a defective miRNA pathway [23–25, 30, 43–46]. We have observed a considerable amount of degradome signatures that were predicted to be results of siRNA-mediated mRNA cleavage. This suggests that, in addition to miRNAs, siRNAs also contribute considerably to down regulate their target mRNAs in de-etiolating seedlings. Further investigation of the miRNA- and siRNA-target pairs will continue to shed light on post-transcriptional regulation of photomorphogenic growth.
Fig. 8.

A proposed model for sRNA-mediated gene expression regulation during photomorphogenesis
Finally, our observation suggests that siRNA-mediated TE mRNA cleavage may serve as an additional mode of TE silencing (Fig. 7). In Arabidopsis, TE mRNAs could also be cleaved by miR859 [47] and a tRNA-derived small RNA via the association with AGO1 in pollens [48]. In Drosophila germ cells, Piwi-interacting RNAs (piRNAs) can interact with Aubergine (Aub) or AGO3 for the cleavage of TE mRNAs [49, 50]. It remains to be clarified with which AGO protein(s) siRNAs interact for silencing plant TE mRNAs.
Conclusions
Photomorphogenesis is a coordinated result of gene expression regulation at multiple levels. Our analyses revealed multiple sRNA–mRNA pairs contributing to this important development process. We also confirmed a comprehensive impact of sRNAs on regulating post-transcriptional gene expression during de-etiolation in Arabidopsis. sRNAs target multiple positive and negative regulators of photomorphogenesis, offering sophisticated fine-tuning power for regulating gene expression during de-etiolation. The potency of an sRNA in target cleavage is primarily determined by its abundance, adding an extra regulation dimension in addition to target recognition.
Methods
Plant materials and growth conditions
Seeds of wild-type Arabidopsis, Col-0, Ler, Ws, T-DNA insertion lines SALK_064047 (mir396a) and SAIL_1256_F08 (grf7) were acquired from stock centers, ABRC or NASC. Homozygous lines of T-DNA insertion lines were screened and confirmed for phenotype observation. The grf1 grf2 grf3 triple mutant and 35S:MIR396aox lines were kindly provided by Drs. Jeong Hoe Kim and DiQiu Yu, respectively. For phenotype observation, Arabidopsis seeds were surface-sterilized with 30% bleach and sown on half-strength Murashige and Skoog medium (Duchefa) without supplementing vitamin or sucrose, with 0.8% phyto agar at tissue culture grade (Duchefa, CAS number 9002–18-0). Seeds were stratified (4 °C for 4 days in the dark) to synchronize germination, then exposed to white light for 1 h to stimulate germination, and transferred to different light (W) conditions at 22 °C (Dark, W 12.5 and 50 μE for 4 days). The white light source was a PHILIPS LIFEMAX T-LD 18 W/840 T25 cool white tube. Hypocotyl lengths of seedlings were measured by using ImageJ v1.47 [51]. The means and SEM were calculated from more than 30 seedlings. At least 3 biological replicates for each line were used for each experiment.
Construction of MIM396 lines
Primer sequences used in this study are listed in Additional file 1: Table S10. 35S:MIM396 target mimicry lines were generated as described [52]. Briefly, the genomic fragment of IPS1 was amplified by using the iProof High-fidelity PCR kit (Bio-Rad) and cloned into the pGEMT-easy vector (Promega). The miR399 target site on original IPS1 sequence was modified to sequester miR396a/b, as shown in Fig. 6a, by overlapping PCR during construction [52]. All constructs were then subcloned into the pCambia-1390 binary vector (CSIRO) digested with SalI and SacI. The constructs were transformed into Agrobacterium tumefaciens GV3101 strain, and introduced into Arabidopsis Col-0 by floral dipping. Two independent homozygous transgenic lines per construct were used for further analyses.
RNA sequencing and data analyses
For sRNA sequencing and data analyses, 4-d-old dark-grown Arabidopsis Col-0 seedlings were exposed to white light (100 μE) for 1, 3, 6, 12 and 24 h. The aerial tissues of approximately 5000 seedlings were collected for RNA isolation. Ten to 15 μg total RNA was size fractionated on 15% Tris-Borate-EDTA-Urea gel. sRNAs ranging from 17 to 30 nucleotides were gel-purified and used for cDNA library construction (Illumina Truseq for replicates 1 and 2, Small RNA v1.5 for replicates 3) and sequencing with the use of an Illumina HiSeq 2500. Twelve barcoded samples were sequenced in one single flowcell (a total of 240 M reads output per flowcell) at a read length of 50 nt. The adaptor-trimmed reads with size >18 nt were mapped to the Arabidopsis TAIR10 genome by using Bowtie [53] with the parameters -f –n 0 –e 80 –l 18 –a –m 5 –best –strata. For miRNA profiling, reads that perfectly matched to mature miRNA sequences were counted, normalized to total mapped reads of 20–24 nt and were shown as reads per million reads (RPM). Reads that mapped to miRNA families (e.g., miR156) were weighted by dividing the read count and equally assigning to each miRNA family member. For siRNA quantification, the Bowtie parameters were -f –n 0 –e 80 –l 18 –a –v 2 –best –strata. For phasiRNAs, the prediction of PHAS loci involved use of the UEA sRNA Workbench [54]. In brief, adaptor-trimmed reads longer than 16 nt were mapped to the TAIR10 genome, and the 21-nt phasing register was set to detect phasing within a 251-nt window, based on hypergeometric distributions described previously [14]. Among the uniquely mapped miRNA/siRNAs, only those with read counts ≥5 in ≥1 time point for all 3 biological replicates were considered expressed. Light-regulated sRNAs were defined as sRNAs with p < 0.05 on Student’s t-test compared to dark treatment (W0 h) for all 3 biological replicates. For mRNA transcriptome analysis, the RPKM for sRNA target genes were analyzed by using datasets published previously [12]. Potential targets included those predicted by use of psRNATarget [55] (with UPE = 25, expectation = 3), miRNA targets identified in previous studies [25, 37] and miRNA targets detected in our degradome analysis (see Additional file 1: Table S5). Expressed genes had RPKM > 0.01 in at least one time point in both biological replicates. The transcript levels of target genes with degradome signatures are in Additional file 1: Table S5 and S6.
For degradome sequencing, 100 μg total RNA was isolated from 4-d-old dark-grown seedlings and mixtures of 4-d-old dark-grown seedlings exposed to 1, 3, 6, 12 and 24 h of light. Degradome sequencing was performed as described [56–58]. Putative cleavage sites were identified by using Cleaveland v4.4.3 [32, 59]. Those with CleaveLand category ≤ 2, p ≤ 0.05 and at least 5 reads at the predicted cleavage site were reported as valid targeting events.
Northern blot analysis and qRT-PCR
In total, 20 to 50 μg total RNA was separated on 15% TBE-Urea gel (Invitrogen). SYBR-Gold (Life Technologies) was used for visualizing RNAs on gels. RNAs were then transferred to Hybond-N+ Nylon membrane (GE Healthcare), by using Transblot SD Semi-Dry Transfer Cell (Bio-Rad) and hybridized with γ-32P-labeled miRNA probes as indicated at 37° Celsius overnight in UltraHyb Oligo buffer (Ambion). Hybridized blots were washed and exposed to Phosphoimager (GE Healthcare), then analyzed by using Typhoon FLA 7000 (GE Healthcare Life Sciences), as described [14]. Images were quantified by using ImageJ v1.47 [51]. For qRT-PCR, cDNA was synthesized from 2 μg total RNA from 4-d-old de-etiolating Arabidopsis seedlings. The SuperScript II RT kit (Invitrogen) was used for reverse transcription of mRNA. For qRT-PCR, cDNA with 0.25 ng equivalence of mRNA was used as a template for each sample. PCR amplification and detection was as described [60]. Primers are in Additional file 1: Table S8. Data for one representative biological replicate were shown in Figs. 3c, 5e and 6a. Results for 2 additional biological replicates were shown in Additional file 2: Figure S3.
Additional files
Table S1. Sequencing and mapping statistics. Description: Contains the number and percentage of mapped sRNA reads in sRNA and degradome sequencing. Table S2. Expressed miRNAs in de-etiolating Arabidopsis seedlings. Description: Contains the expression level of expressed miRNAs, with RPM and fold changes. Table S3. Expressed phasiRNAs in de-etiolating seedlings. Description: Contains the expression level of expressed phasiRNAs, with the corresponding PHAS locus, RPM and fold changes. Table S4. Expressed siRNAs in de-etiolating seedlings. Description: Contains the expression level of expressed siRNAs, with the sequence, length, RPM and fold changes. Table S5. miRNA-mRNA and phasiRNA-mRNA pairs from cross comparisons of sRNA transcriptome and mRNA degradome. Contains the information of miRNA/phasiRNA-mediated target cleavage, including locus number, CleaveLand categories, p-values and target mRNA levels. Table S6. siRNA-mRNA pairs from cross comparisons of sRNA transcriptome and mRNA degradome. Contains the information of siRNA-mediated target cleavage, including locus number, CleaveLand categories, p-values and target mRNA levels. Table S7. Expression levels of GRFs. Contains the expression level of GRFs under dark and light. Table S8. Primers used in this study. Contains sequences of the primers that are used in this study. (XLSX 2667 kb)
Figure S1. miRNAs/siRNAs with target cleavage tend to be more abundant than miRNAs/siRNAs that did not show target cleavage signatures. Contains supplemental figure and legend showing K-S test results of siRNA abundance. Figure S2. Molecular and phenotypic analyses of mir396a mutant and MIR396aox lines. Contains supplemental figure and legend showing the examination of mir396a mutant and MIR396aox lines. Figure S3. qRT-PCR results of two additional biological replicates for a AGO1 and b, c GRF shown in Figs. 3c, 5e and 6a, respectively. Contains supplemental figure and legend showing the qRT-PCR results of two additional biological replicates in this study. (PDF 1074 kb)
Acknowledgements
We specially thank Ming-Tsung Wu and Shu-Jen Chou for establishing the degradome sequencing system, Bo-Jun Liu and Chi-Yu Chen for assisting in experiments related to MIM396 under the supervision of MCL and SHW. We also thank Jeong Hoe Kim at Kyungpook National University and Diqiu Yu at Xishuangbanna Tropical Botanical Garden, Chinese Academiy of Sciences, for kindly providing the grf mutants and 35S:MIR396aox line, respectively. Finally, we thank Chih-Ching Lin, Chiung-swey Joanne Chang, Ho-Ming Chen, Ho-Wei Wu, Wen-Ping Hsieh, Yi-Chen Wu and Ying Wang for inspiring discussion and suggestions.
Funding
This research, including design and collection of experimental results, data analyses and preparation of the manuscript, was supported by the Investigator Award to S.-H. Wu from Academia Sinica, Taiwan.
Availability of data and materials
The datasets generated and analyzed in this manuscript can be accessed from Gene Expression Omnibus (GEO) under accession number GSE83646. The other supporting data are included as Additional files.
Abbreviations
- AGO1
ARGONAUTE1
- Aub
Aubergine
- B
blue
- COP1
CONSTITUTIVE PHOTOMORPHOGENESIS 1
- cry
cryptochrome
- FR
far-red
- GRF
GROWTH REGULATING FACTOR
- HEN1
HUA ENHANCER1
- HST
HASTY
- HY5
ELONGATED-HYPOCOTYL 5
- HYL1
HYPONASTIC LEAVES 1
- K-S test
Kolmogorov-Smirnov test
- miRNA or miR
microRNA
- PHAS
phasiRNA-generating loci
- phasiRNAs
phased siRNA
- phy
phytochrome
- piRNA
Piwi-interacting RNA
- R
red
- RdDM
RNA-dependent DNA methylation
- RPM
read per million reads
- siRNA
small interfering RNA
- sRNA
small regulatory RNA
- TAS
trans-acting siRNA-generating loci
- TCP
-
TEOSINTE BRANCHED 1
CYCLOIDEA AND PCF TRANSCRIPTION FACTOR
- TE
transposable element
Authors’ contributions
SHW, STJ, MCL and HLT designed the experiments. SLL, HLT and MCL conducted experiments. SHW and MCL wrote the manuscript. All authors have read and approved the final manuscript.
Ethics approval and consent to participate
Not applicable.
Consent for publication
Not applicable.
Competing interests
The authors declare that they have no competing interests.
Footnotes
Electronic supplementary material
The online version of this article (doi:10.1186/s12864-017-3937-6) contains supplementary material, which is available to authorized users.
Contributor Information
Meng-Chun Lin, Email: f97b42012@ntu.edu.tw.
Huang-Lung Tsai, Email: dragonda@gate.sinica.edu.tw.
Sim-Lin Lim, Email: simlinlim86@gate.sinica.edu.tw.
Shih-Tong Jeng, Email: stjeng@ntu.edu.tw.
Shu-Hsing Wu, Email: shuwu@gate.sinica.edu.tw.
References
- 1.Sullivan JA, Deng XW. From seed to seed: the role of photoreceptors in Arabidopsis development. Dev Biol. 2003;260:289–297. doi: 10.1016/S0012-1606(03)00212-4. [DOI] [PubMed] [Google Scholar]
- 2.Kami C, Lorrain S, Hornitschek P, Fankhauser C. Light-regulated plant growth and development. Curr Top Dev Biol. 2010;91:29–66. doi: 10.1016/S0070-2153(10)91002-8. [DOI] [PubMed] [Google Scholar]
- 3.Wu SH. Gene expression regulation in photomorphogenesis from the perspective of the central dogma. Annu Rev Plant Biol. 2014;65:311–333. doi: 10.1146/annurev-arplant-050213-040337. [DOI] [PubMed] [Google Scholar]
- 4.Yeh KC, Wu SH, Murphy JT, Largarias JC. A cyanobacterial Phytochrome two-component light sensory system. Science. 1997;277:1505–1508. doi: 10.1126/science.277.5331.1505. [DOI] [PubMed] [Google Scholar]
- 5.Ahmad M, Jarillo JA, Cashmore AR. Chimeric proteins between cry1 and cry2 Arabidopsis blue light photoreceptors indicate overlapping functions and varying protein stability. Plant Cell. 1998;10:197–207. doi: 10.1105/tpc.10.2.197. [DOI] [PMC free article] [PubMed] [Google Scholar]
- 6.Rizzini L, Favory JJ, Cloix C, Faggionato D, O'Hara A, Kaiserli E, Baumeister R, Schäfer E, Nagy F, Jenkins GI, Ulm R. Perception of UV-B by the Arabidopsis UVR8 protein. Science. 2011;332:103–106. doi: 10.1126/science.1200660. [DOI] [PubMed] [Google Scholar]
- 7.Wang H, Wang H. Phytochrome signaling: time to tighten up the loose ends. Mol Plant. 2015;8:540–551. doi: 10.1016/j.molp.2014.11.021. [DOI] [PubMed] [Google Scholar]
- 8.Yin R, Arongaus AB, Binkert M, Ulm R. Two distinct domains of the UVR8 photoreceptor interact with COP1 to initiate UV-B signaling in Arabidopsis. Plant Cell. 2015;27:202–213. doi: 10.1105/tpc.114.133868. [DOI] [PMC free article] [PubMed] [Google Scholar]
- 9.Ma L, Li J, Qu L, Hager J, Chen Z, Zhao H, Deng XW. Light control of Arabidopsis development entails coordinated regulation of genome expression and cellular pathways. Plant Cell. 2001;13:2589–2607. doi: 10.1105/tpc.13.12.2589. [DOI] [PMC free article] [PubMed] [Google Scholar]
- 10.Chattopadhyay S, Ang LH, Puente P, Deng XW, Wei N. Arabidopsis bZIP protein HY5 directly interacts with light-responsive promoters in mediating light control of gene expression. Plant Cell. 1998;10:673–683. doi: 10.1105/tpc.10.5.673. [DOI] [PMC free article] [PubMed] [Google Scholar]
- 11.Liu MJ, Wu SH, Chen HM, Wu SH. Widespread translational control contributes to the regulation of Arabidopsis photomorphogenesis. Mol Syst Biol. 2012;8:566. doi: 10.1038/msb.2011.97. [DOI] [PMC free article] [PubMed] [Google Scholar]
- 12.Liu MJ, Wu SH, Wu JF, Lin WD, Wu YC, Tasi TY, Tsai HL, Wu SH. Translational landscape of Photomorphogenic Arabidopsis. Plant Cell. 2013;25:3699–3710. doi: 10.1105/tpc.113.114769. [DOI] [PMC free article] [PubMed] [Google Scholar]
- 13.Meister G, Tuschl T. Mechanisms of gene silencing by double-stranded RNA. Nature. 2004;431:343–349. doi: 10.1038/nature02873. [DOI] [PubMed] [Google Scholar]
- 14.Chen HM, Li YH, Wu SH. Bioinformatic prediction and experimental validation of a microRNA-directed tandem trans-acting siRNA cascade in Arabidopsis. Proc Natl Acad Sci U S A. 2007;104:3318–3323. doi: 10.1073/pnas.0611119104. [DOI] [PMC free article] [PubMed] [Google Scholar]
- 15.Fei Q, Xia R, Meyers BC. Phased, secondary, small interfering RNAs in posttranscriptional regulatory networks. Plant Cell. 2013;25:2400–2415. doi: 10.1105/tpc.113.114652. [DOI] [PMC free article] [PubMed] [Google Scholar]
- 16.Allen E, Xie Z, Gustafson AM, Carrington JC. microRNA-directed phasing during trans-acting siRNA biogenesis in plants. Cell. 2005;121:207–221. doi: 10.1016/j.cell.2005.04.004. [DOI] [PubMed] [Google Scholar]
- 17.Law JA, Jacobsen SE. Establishing, maintaining and modifying DNA methylation patterns in plants and animals. Nat Rev Genet. 2010;11:204–220. doi: 10.1038/nrg2719. [DOI] [PMC free article] [PubMed] [Google Scholar]
- 18.Matzke MA, Mosher RA. RNA-directed DNA methylation: an epigenetic pathway of increasing complexity. Nat Rev Genet. 2014;15:394–408. doi: 10.1038/nrg3683. [DOI] [PubMed] [Google Scholar]
- 19.Bartel DP. MicroRNAs: genomics, biogenesis, mechanism, and function. Cell. 2004;116:281–297. doi: 10.1016/S0092-8674(04)00045-5. [DOI] [PubMed] [Google Scholar]
- 20.Chen X. Small RNAs and their roles in plant development. Annu Rev Cell Dev Biol. 2009;35:21–44. doi: 10.1146/annurev.cellbio.042308.113417. [DOI] [PMC free article] [PubMed] [Google Scholar]
- 21.Guleria P, Mahajan M, Bhardwaj J, Yadav SK. Plant small RNAs: biogenesis, mode of action and their roles in abiotic stresses. Genomics Proteomics Bioinform. 2011;9:183–199. doi: 10.1016/S1672-0229(11)60022-3. [DOI] [PMC free article] [PubMed] [Google Scholar]
- 22.Ruiz-Ferrer V, Voinnet O. Roles of plant small RNAs in biotic stress responses. Annu Rev Plant Biol. 2009;60:485–510. doi: 10.1146/annurev.arplant.043008.092111. [DOI] [PubMed] [Google Scholar]
- 23.Bollman KM. HASTY, the Arabidopsis ortholog of exportin 5/MSN5, regulates phase change and morphogenesis. Development. 2003;130:1493–1504. doi: 10.1242/dev.00362. [DOI] [PubMed] [Google Scholar]
- 24.Sorin C, Bussell JD, Camus I, Ljung K, Kowalczyk M, Geiss G, McKhann H, Garcion C, Vaucheret H, Sandberg G, Bellini C. Auxin and light control of adventitious rooting in Arabidopsis require ARGONAUTE1. Plant Cell. 2005;17:1343–1359. doi: 10.1105/tpc.105.031625. [DOI] [PMC free article] [PubMed] [Google Scholar]
- 25.Tsai HL, Li YH, Hsieh WP, Lin MC, Ahn JH, Wu SH. HUA ENHANCER1 is involved in posttranscriptional regulation of positive and negative regulators in Arabidopsis photomorphogenesis. Plant Cell. 2014;26:2858–2872. doi: 10.1105/tpc.114.126722. [DOI] [PMC free article] [PubMed] [Google Scholar]
- 26.Cho SK, Ben Chaabane S, Shah P, Poulsen CP, Yang SW. COP1 E3 ligase protects HYL1 to retain microRNA biogenesis. Nat Commun. 2014;5:5867. doi: 10.1038/ncomms6867. [DOI] [PubMed] [Google Scholar]
- 27.Zhang H, He H, Wang X, Wang X, Yang X, Li L, Deng XW. Genome-wide mapping of the HY5-mediated gene networks in Arabidopsis that involve both transcriptional and post-transcriptional regulation. Plant J. 2011;65:346–358. doi: 10.1111/j.1365-313X.2010.04426.x. [DOI] [PubMed] [Google Scholar]
- 28.Kozomara A, Griffiths-Jones S. miRBase: integrating microRNA annotation and deep-sequencing data. Nucleic Acids Res. 2011;39:D152–D157. doi: 10.1093/nar/gkq1027. [DOI] [PMC free article] [PubMed] [Google Scholar]
- 29.Cheng Y, Chen X. Posttranscriptional control of plant development. Curr Opin Plant Biol. 2004;7:20–25. doi: 10.1016/j.pbi.2003.11.005. [DOI] [PMC free article] [PubMed] [Google Scholar]
- 30.Vazquez F, Vaucheret H, Rajagopalan R, Lepers C, Gasciolli V, Mallory AC, Hilbert JL, Bartel DP, Crete P. Endogenous trans-acting siRNAs regulate the accumulation of Arabidopsis mRNAs. Mol Cell. 2004;16:69–79. doi: 10.1016/j.molcel.2004.09.028. [DOI] [PubMed] [Google Scholar]
- 31.Baumberger N, Baulcombe D. Arabidopsis ARGONAUTE1 is an RNA slicer that selectively recruits microRNAs and short interfering RNAs. Proc Natl Acad Sci U S A. 2005;102:11928–11933. doi: 10.1073/pnas.0505461102. [DOI] [PMC free article] [PubMed] [Google Scholar]
- 32.Brousse C, Liu Q, Beauclair L, Deremetz A, Axtell MJ, Bouche N. A non-canonical plant microRNA target site. Nucleic Acids Res. 2014;42:5270–5279. doi: 10.1093/nar/gku157. [DOI] [PMC free article] [PubMed] [Google Scholar]
- 33.Arvey A, Larsson E, Sander C, Leslie CS, Marks DS. Target mRNA abundance dilutes microRNA and siRNA activity. Mol Syst Biol. 2010;6:363. doi: 10.1038/msb.2010.24. [DOI] [PMC free article] [PubMed] [Google Scholar]
- 34.Ragan C, Zuker M, Ragan MA. Quantitative prediction of miRNA-mRNA interaction based on equilibrium concentrations. PLoS Comput Biol. 2011;7 doi: 10.1371/journal.pcbi.1001090. [DOI] [PMC free article] [PubMed] [Google Scholar]
- 35.Vaucheret H, Vazquez F, Crete P, Bartel DP. The action of ARGONAUTE1 in the miRNA pathway and its regulation by the miRNA pathway are crucial for plant development. Genes Dev. 2004;18:1187–1197. doi: 10.1101/gad.1201404. [DOI] [PMC free article] [PubMed] [Google Scholar]
- 36.Chung PJ, Park BS, Wang HI, Jang IC, Chua NH. Light-inducible MiR163 targets PXMT1 transcripts to promote seed germination and primary root elongation in Arabidopsis. Plant Physiol. 2016;170:1772–1782. doi: 10.1104/pp.15.01188. [DOI] [PMC free article] [PubMed] [Google Scholar]
- 37.Jones-Rhoades MW, Bartel DP. Computational identification of plant microRNAs and their targets, including a stress-induced miRNA. Mol Cell. 2004;14:787–799. doi: 10.1016/j.molcel.2004.05.027. [DOI] [PubMed] [Google Scholar]
- 38.Liu D, Song Y, Chen Z, Yu D. Ectopic expression of miR396 suppresses GRF target gene expression and alters leaf growth in Arabidopsis. Physiol Plant. 2009;136:223–236. doi: 10.1111/j.1399-3054.2009.01229.x. [DOI] [PubMed] [Google Scholar]
- 39.Kim JH, Choi D, Kende H. The AtGRF family of putative transcription factors is involved in leaf and cotyledon growth in Arabidopsis. Plant J. 2003;36:94–104. doi: 10.1046/j.1365-313X.2003.01862.x. [DOI] [PubMed] [Google Scholar]
- 40.Kim JS, Mizoi J, Kidokoro S, Maruyama K, Nakajima J, Nakashima K, Mitsuda N, Takiguchi Y, Ohme-Takagi M, Kondou Y, et al. Arabidopsis growth-regulating factor7 functions as a transcriptional repressor of abscisic acid- and osmotic stress-responsive genes, including DREB2A. Plant Cell. 2012;24:3393–3405. doi: 10.1105/tpc.112.100933. [DOI] [PMC free article] [PubMed] [Google Scholar]
- 41.Chen HM, Chen LT, Patel K, Li YH, Baulcombe DC, Wu SH. 22-nucleotide RNAs trigger secondary siRNA biogenesis in plants. Proc Natl Acad Sci U S A. 2010;107:15269–15274. doi: 10.1073/pnas.1001738107. [DOI] [PMC free article] [PubMed] [Google Scholar]
- 42.Lee BH, Ko JH, Lee S, Lee Y, Pak JH, Kim JH. The Arabidopsis GRF-INTERACTING FACTOR gene family performs an overlapping function in determining organ size as well as multiple developmental properties. Plant Physiol. 2009;151:655–668. doi: 10.1104/pp.109.141838. [DOI] [PMC free article] [PubMed] [Google Scholar]
- 43.Li J, Yang Z, Yu B, Liu J, Chen X. Methylation protects miRNAs and siRNAs from a 3'-end uridylation activity in Arabidopsis. Curr Biol. 2005;15:1501–1507. doi: 10.1016/j.cub.2005.07.029. [DOI] [PMC free article] [PubMed] [Google Scholar]
- 44.Park MY, Wu G, Gonzalez-Sulser A, Vaucheret H, Poethig RS. Nuclear processing and export of microRNAs in Arabidopsis. Proc Natl Acad Sci U S A. 2005;102:3691–3696. doi: 10.1073/pnas.0405570102. [DOI] [PMC free article] [PubMed] [Google Scholar]
- 45.Vaucheret H, Mallory AC, Bartel DP. AGO1 homeostasis entails coexpression of MIR168 and AGO1 and preferential stabilization of miR168 by AGO1. Mol Cell. 2006;22:129–136. doi: 10.1016/j.molcel.2006.03.011. [DOI] [PMC free article] [PubMed] [Google Scholar]
- 46.Yang L, Liu Z, Lu F, Dong A, Huang H. SERRATE is a novel nuclear regulator in primary microRNA processing in Arabidopsis. Plant J. 2006;47:841–850. doi: 10.1111/j.1365-313X.2006.02835.x. [DOI] [PubMed] [Google Scholar]
- 47.Creasey KM, Zhai J, Borges F, Van EF, Regulski M, Meyers BC, Martienssen RA. miRNAs trigger widespread epigenetically activated siRNAs from transposons in Arabidopsis. Nature. 2014;508:411–415. doi: 10.1038/nature13069. [DOI] [PMC free article] [PubMed] [Google Scholar]
- 48.Martinez G, Choudury SG, Slotkin RK. tRNA-derived small RNAs target transposable element transcripts. Nucleic Acids Res. 2017;45:5142–5152. doi: 10.1093/nar/gkx103. [DOI] [PMC free article] [PubMed] [Google Scholar]
- 49.Aravin AA, Sachidanandam R, Girard A, Fejes-Toth K, Hannon GJ. Developmentally regulated piRNA clusters implicate MILI in transposon control. Science. 2007;316 [DOI] [PubMed]
- 50.Sato K. The epigenetic regulation of transposable elements by PIWI-interacting RNAs in drosophila. Genes Genet Syst. 2013;88:9–17. doi: 10.1266/ggs.88.9. [DOI] [PubMed] [Google Scholar]
- 51.Schneider CA, Rasband WS, Eliceiri KW. NIH image to ImageJ: 25 years of image analysis. Nat Methods. 2012;9:671–675. doi: 10.1038/nmeth.2089. [DOI] [PMC free article] [PubMed] [Google Scholar]
- 52.Franco-Zorrilla JM, Valli A, Todesco M, Mateos I, Puga MI, Rubio-Somoza I, Leyva A, Weigel D, Garcia JA, Paz-Ares J. Target mimicry provides a new mechanism for regulation of microRNA activity. Nat Genet. 2007;39:1033–1037. doi: 10.1038/ng2079. [DOI] [PubMed] [Google Scholar]
- 53.Langmead B, Trapnell C, Pop M, Salzberg SL. Ultrafast and memory-efficient alignment of short DNA sequences to the human genome. Genome Biol. 2009;10:R25. doi: 10.1186/gb-2009-10-3-r25. [DOI] [PMC free article] [PubMed] [Google Scholar]
- 54.Stocks MB, Moxon S, Mapleson D, Woolfenden HC, Mohorianu I, Folkes L, Schwach F, Dalmay T, Moulton V. The UEA sRNA workbench: a suite of tools for analysing and visualizing next generation sequencing microRNA and small RNA datasets. Bioinformatics 2012;28:2059–2061. [DOI] [PMC free article] [PubMed]
- 55.Dai X, Zhao PX. psRNATarget: a plant small RNA target analysis server. Nucleic Acids Res. 2011;39:W155–W159. doi: 10.1093/nar/gkr319. [DOI] [PMC free article] [PubMed] [Google Scholar]
- 56.Addo-Quaye C, Eshoo TW, Bartel DP, Axtell MJ. Endogenous siRNA and miRNA targets identified by sequencing of the Arabidopsis degradome. Curr Biol. 2008;18:758–762. doi: 10.1016/j.cub.2008.04.042. [DOI] [PMC free article] [PubMed] [Google Scholar]
- 57.German MA, Pillay M, Jeong DH, Hetawal A, Luo S, Janardhanan P, Kannan V, Rymarquis LA, Nobuta K, German R, et al. Global identification of microRNA-target RNA pairs by parallel analysis of RNA ends. Nat Biotechnol. 2008;26:941–946. doi: 10.1038/nbt1417. [DOI] [PubMed] [Google Scholar]
- 58.Gregory BD, O'Malley RC, Lister R, Urich MA, Tonti-Filippini J, Chen H, Millar AH, Ecker JR. A link between RNA metabolism and silencing affecting Arabidopsis development. Dev Cell. 2008;14:854–866. doi: 10.1016/j.devcel.2008.04.005. [DOI] [PubMed] [Google Scholar]
- 59.Addo-Quaye C, Miller W, Axtell MJ. CleaveLand: a pipeline for using degradome data to find cleaved small RNA targets. Bioinformatics. 2009;25:130–131. doi: 10.1093/bioinformatics/btn604. [DOI] [PMC free article] [PubMed] [Google Scholar]
- 60.Wang Y, Wu JF, Nakamichi N, Sakakibara H, Nam HG, Wu SH. LIGHT-REGULATED WD1 and PSEUDO-RESPONSE REGULATOR9 form a positive feedback regulatory loop in the Arabidopsis circadian clock. Plant Cell. 2011;23:486–498. doi: 10.1105/tpc.110.081661. [DOI] [PMC free article] [PubMed] [Google Scholar]
Associated Data
This section collects any data citations, data availability statements, or supplementary materials included in this article.
Supplementary Materials
Table S1. Sequencing and mapping statistics. Description: Contains the number and percentage of mapped sRNA reads in sRNA and degradome sequencing. Table S2. Expressed miRNAs in de-etiolating Arabidopsis seedlings. Description: Contains the expression level of expressed miRNAs, with RPM and fold changes. Table S3. Expressed phasiRNAs in de-etiolating seedlings. Description: Contains the expression level of expressed phasiRNAs, with the corresponding PHAS locus, RPM and fold changes. Table S4. Expressed siRNAs in de-etiolating seedlings. Description: Contains the expression level of expressed siRNAs, with the sequence, length, RPM and fold changes. Table S5. miRNA-mRNA and phasiRNA-mRNA pairs from cross comparisons of sRNA transcriptome and mRNA degradome. Contains the information of miRNA/phasiRNA-mediated target cleavage, including locus number, CleaveLand categories, p-values and target mRNA levels. Table S6. siRNA-mRNA pairs from cross comparisons of sRNA transcriptome and mRNA degradome. Contains the information of siRNA-mediated target cleavage, including locus number, CleaveLand categories, p-values and target mRNA levels. Table S7. Expression levels of GRFs. Contains the expression level of GRFs under dark and light. Table S8. Primers used in this study. Contains sequences of the primers that are used in this study. (XLSX 2667 kb)
Figure S1. miRNAs/siRNAs with target cleavage tend to be more abundant than miRNAs/siRNAs that did not show target cleavage signatures. Contains supplemental figure and legend showing K-S test results of siRNA abundance. Figure S2. Molecular and phenotypic analyses of mir396a mutant and MIR396aox lines. Contains supplemental figure and legend showing the examination of mir396a mutant and MIR396aox lines. Figure S3. qRT-PCR results of two additional biological replicates for a AGO1 and b, c GRF shown in Figs. 3c, 5e and 6a, respectively. Contains supplemental figure and legend showing the qRT-PCR results of two additional biological replicates in this study. (PDF 1074 kb)
Data Availability Statement
The datasets generated and analyzed in this manuscript can be accessed from Gene Expression Omnibus (GEO) under accession number GSE83646. The other supporting data are included as Additional files.