Abstract
Swarming bacteria collectively migrate on surfaces using flagella, forming dynamic whirls and jets that consist of millions of individuals. Because some swarming bacteria elongate prior to actual motion, cell aspect ratio may play a significant role in the collective dynamics. Extensive research on self-propelled rod-like particles confirms that elongation promotes alignment, strongly affecting the dynamics. Here, we study experimentally the collective dynamics of variants of swarming Bacillus subtilis, that differ in length. We show that the swarming statistics depends on aspect ratio in a critical, fundamental fashion not predicted by theory. The fastest motion was obtained for the wildtype and variants that are similar in length. However, shorter and longer cells exhibit anomalous, non-Gaussian statistics and non-exponential decay of the auto-correlation function, indicating lower collective motility. These results suggest that the robust mechanisms to maintain aspect ratios may be important for efficient swarming motility. Wild-type cells are optimal in this sense.
Dense populations of motile microorganisms exhibit collective behavior in which hundreds of individuals are grouped into dynamic clusters and move in synchronized flows and vortices [1–29]. Bacterial swarming, an efficient mode of surface translocation, is a principle example in which rod-shaped densely-packed flagellated bacteria migrate within thin layers of water [1–12]. In addition to biological interest, swarming bacterial colonies serve as a model for active living matter with non-Newtonian nematic liquid properties [19] and are also compared with other examples of collectively moving animals and virtual particles or robots [30].
The vast quantitative experimental studies on collective bacterial motion have focused on cluster-size distribution, correlations, velocities and vorticities distributions [4–19, 21–27]. In particular, characteristic length and time scales were obtained for a large variety of systems. This was done mostly by using particle image velocimetry or optical flow methods. These studies examined the dependence of the bacterial dynamics on density, oxygen, wettability and antibiotics and revealed that the principle interactions underling the dynamics are short-range steric forces and long-range hydrodynamic interactions [25]. Theoretically, high density swimming (or swarming) bacteria are typically modelled as self-propelled elongated particles interacting via steric and/or longer range effective alignment forces [13–18]. Such systems can have a highly complex dynamics, and a wide variety of possible phases, depending on model parameters such as density, rotational diffusion and cell shape.
Here, we focus on the cell aspect ratio. This parameter deserves special attention because some bacterial species change their cell aspect ratio before starting to swarm, suggesting that the aspect ratio (typically about 5:1) is important to the swarming dynamics [1, 2]. Indeed, several theoretical studies showed that cell density and aspect ratio are important to the ability of self-propelled rods to move collectively [13–18]. Loosely speaking, rods with a small aspect ratio cannot form a macroscopically ordered phase due to weak alignment interactions between particles. On the other hand, long pin-like particles form a jammed phase characterized by low mobility. Hence, such theoretical models [14, 15] successfully predict that the aspect ratio of real cells cannot be too small or large. Experimental work with Proteus mirabilis [31] suggests that elongation is a part of the swarming differentiation but that cell aspect ratio is not correlated with cell speed.
By analyzing the dynamics of swarming B. subtilis mutants with different cell aspect ratio, we show that the cell shape has a significantly more dominant effect than described by theory. In particular, the statistics of the swarm dynamics deviates from the expected Gaussian distribution both at low and high aspect ratios. This is in stark contrast to the (approximate) Gaussian statistics assumed or obtained in all previous experiments and models, e.g. [7, 8, 14, 21]. Our results show that the observed aspect ratio of 4.9 in wild-type (WT) cells is optimal as it precisely allows for Gaussian statistics and effective swarming.
Colonies of WT and eight different mutant strains of B. subtilis with the same width but varying lengths (see Table I) were inoculated on agar plates and allowed to grow. Note that cell aspect ratio (even for WT) may differ between experiments, depending on agar rigidity or nutrient concentration (for example, on 0.7% agar, cells are shorter compared to LB broth [32]). Bacteria have species-specific shapes, and rod-shaped bacteria have robust mechanisms to maintain their aspect ratio during growth [33, 34]. In B. subtilis, MinD participates in the inhibition of premature division reinitiation adjacent to the nascent septum [35, 36]. When MinD is mutated, aberrant division makes a small anucleate minicell daughter and a longer multinucleate daughter [20, 37]. MinJ localizes and antagonizes MinD and when MinJ is mutated, MinD promiscuously inhibits cell division resulting in long filamentous cells [20, 38]. Another protein UgtP inhibits division in response to nutrient conditions such that cell length decreases when UgtP is mutated [39, 40]. Finally, the master regulator of flagellar biosynthesis SwrA also controls cell length: when SwrA is mutated, cells elongate and when SwrA is overexpressed, cells shorten [32, 41]. Here we exploit cells mutated in the cell length regulators described above to determine the effect of aspect ratio on swarming motility. The data presented in this paper, including the various mutants, are available upon request. All strains were checked for consistency in behavior, see Supplemental Material.
TABLE I.
Relevant characteristics of the Bacillus subtilis 3610 mutants grown on 0.5% agar and 1 g/l peptone.
| Strain Aspect ratio | Mutation | |
|---|---|---|
| DS3141 | 3.8 ± 12 | ugtP::spec |
| DS1470 | 4.1 ± 1.4 | swrA::tet amyE::Physpank-swrA spec |
| DS2822 | 4.3 ± 0.9 | ΔminJ amyE::PminJ-minJ cat |
| DS860 | 4.7 ± 0.8 | amyE::Physpank-swrA spec |
| WT | 4.9 ± 1.7 | – |
| DS2847 | 6.0 ± 1.3 | ΔminJ amyE::spec |
| DS3293 | 7.1 ± 2.1 | AminJ minD::TnYLB kan amyE::spec |
| DS3774 | 7.2 ± 2.8 | minD::TnYLB kan |
| DS858 | 8.0 ± 2.3 | minJ::tet |
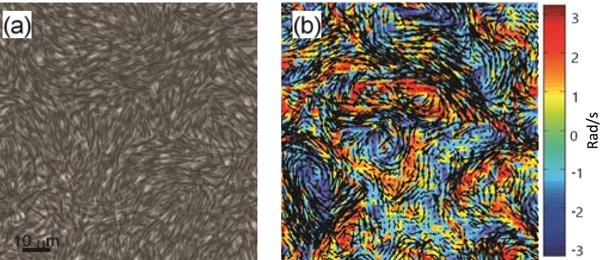
Each colony, composed of one strain only, started expanding after about 4 hours and filled a standard Petriplate after another 3 hours (Fig. 1a). An optical microscope equipped with a camera captured the microscopic motion at 100 f/s and 1024×1024 resolution, which were analyzed to obtain the flow field of the top layer of the swarm (Fig. 1b). Data was taken 1h after colony started to expand; we have focused on the outer parts of the colony (20–1000 μm from the colony edge towards the center of the plate) where the cells are more active. In the inner parts of the colony the cells do not swarm due to sporulation and biofilm formation. See Supplemental Material and [7] for more details.
FIG. 1.

Microscopic observations of swarming. (a) Phase contrast imaging (60X) of long B. subtilis with a 8.0 aspect ratio (strain DS858) during swarming. (b) The instantaneous velocity (black arrows) and vorticity (red: clockwise; blue: counter-clockwise) fields.
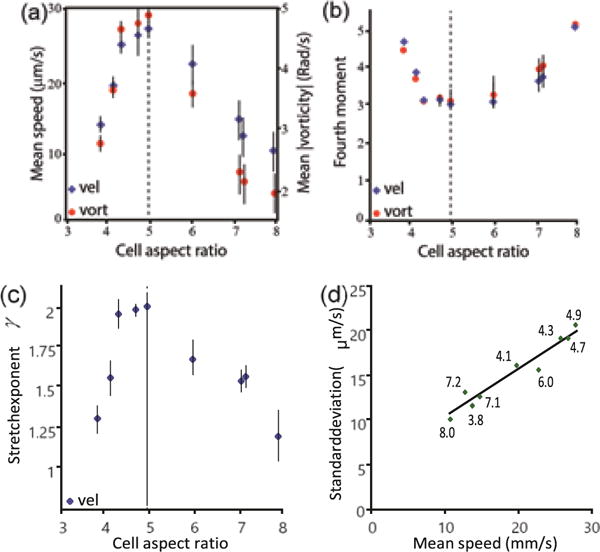
The flow field fluctuates in both space and time yielding a distribution of velocities. Figure 2 describes the critical dependence of the ability of cells to move efficiency on the aspect ratio. First, we consider the distribution of speeds: Fig. 2a shows that the mean speed and absolute vorticity of the flow vary significantly, peaking at an aspect ratio of 4.9, corresponding to WT bacteria. However, the difference between velocity distributions is not just in the average, but more significantly in the type of distribution. The x − y components of the velocities of WT cells, as well as other mutant strains with aspect ratios close to 5, have a 1D distribution that is approximately Gaussian. This observation has been well documented in numerous previous experiments and simulations. However, the velocity of both shorter and longer cells has an anomalous non-Gaussian distribution. Figure 2b depicts the scaled 4th moment (kurtosis), κ = M4/σ4, where M4 is the centered fourth moment and σ2 the variance. While WT cells have a kurtosis of approximately 3 (Gaussian), both long and short cells show a higher kurtosis which can be up to 5, indicating a heavier tail. Similar results are obtained for the distribution of the vorticity, defined as the curl of the flow field. In Fig. 2c we plot the maximum likelihood fit for a stretched exponential distribution of the form z−1e−(v/v0)γ, where v0 is the characteristic speed and z a normalization constant. The results are consistent with the kurtosis. Lastly, Fig. 2d shows that the standard deviation in the velocity is approximately linear in the mean speed. This result would be expected if all distributions are of the same type, e.g., all stretched exponentials with the same exponent γ but different characteristic speed v0. This is not the case here, as the kurtosis of the distributions are different. These results imply a significant, quantitative dependence of the swarm dynamics on the aspect ratio. In particular, it appears that WT cells are optimal in this sense.
FIG. 2.

Optical flow analyses of the swarm edge. (a) The mean speed and mean absolute vorticity as a function of cell aspect ratio. The non-monotonic dependence, with a maximum at aspect ratio=4.9 obtained for the WT (dashed line) shows the significance of the aspect ratio for effective swarming and the advantage of the 5:1 value. (b) The scaled 4th moment (kurtosis) of the velocity and vorticity fields as a function of the aspect ratio. The minimum value of 3, indicating a Gaussian distribution, is obtained at aspect ratio=4.9 (WT, dashed line). (c) The exponent of the velocity field corresponding to a stretched exponential function of the form Z−1 exp[−(v/v0)γ], with γ = 2 for the WT (Gaussian) and lower values for shorter and longer strains. (d) The standard deviation of the velocity as a function of mean speed for the different strains is approximately linear, despite the different types of distribution. Numbers show the aspect ratio.
It is emphasized that the dependence of the mean speed on the length is smooth; in particular, mutated strains that have a length similar to the WT (e.g., DS860 with aspect ratio=4.7) exhibit a distribution of velocity and vorticity that is very close to the WT. This indicates that the genetic manipulation was not a factor influencing the results.
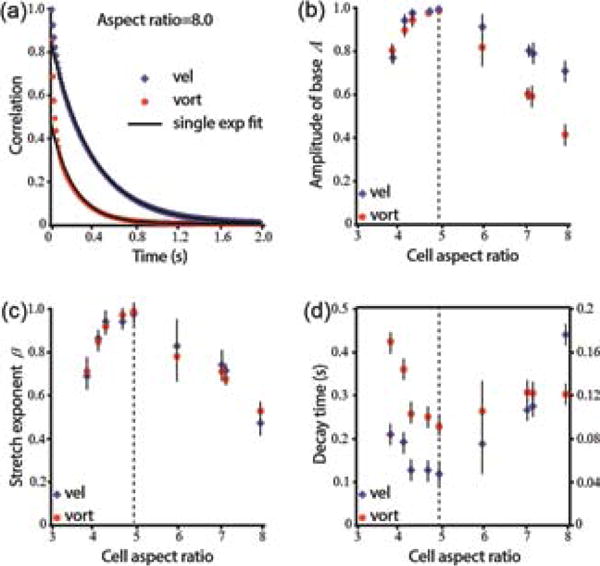
Temporal auto-correlation functions also show the pivotal importance of the aspect ratio on the dynamics. While WT cells show an exponential decay (Fig. 3a and e.g., [23]), correlations of short and long cells do not. In order to quantify this observation, we analyze the autocorrelation function C(t) =< v(x,y,s) · v(x,y,s + t) >, where v(x,y,s) is the flow fields obtained at position x,y and time s and < · > denotes averaging with respect to x, y and s. C(t) was fitted to a double exponential of the form Ae−t/τ1 + (1 − A)e−t/τ2, with τ1 < τ2. Figure 3b shows the dependence of A on aspect ratio. For WT cells, as well as cells with aspect ratio close to 5, A is approximately 1, indicating that a single exponential provides a good fit. However, with short and long cells, a linear combination of two exponentials is necessary, indicating a second time-scale. Alternatively, autocorrelation functions were fitted to a stretched exponential exp(−αtβ), with a maximal value of β = 1 for WT aspect ratio (Fig. 3c). Finally, Fig. 3d shows the observed decay time as a function of aspect ratio, demonstrating a similar non-monotonic trend.
FIG. 3.

Temporal autocorrelations of the microscopic flow. (a) Example of temporal correlation functions for the velocity and vorticity obtained with a long bacterial strain (DS858, aspect ratio 8.0). (b) The amplitude A obtained by fitting the temporal correlation function to a double exponential function Ae−t/τ1 + (1 − A)e−t/τ2. (c) The stretching exponent β obtained by fitting the temporal correlation function to a stretched exponential, C(t) = exp(−αtβ). (d) The observed decay time (at C(t) = 1/e) as a function of aspect ratio. Left/right y-axes show values for correlations in velocity/vorticity, respectively.
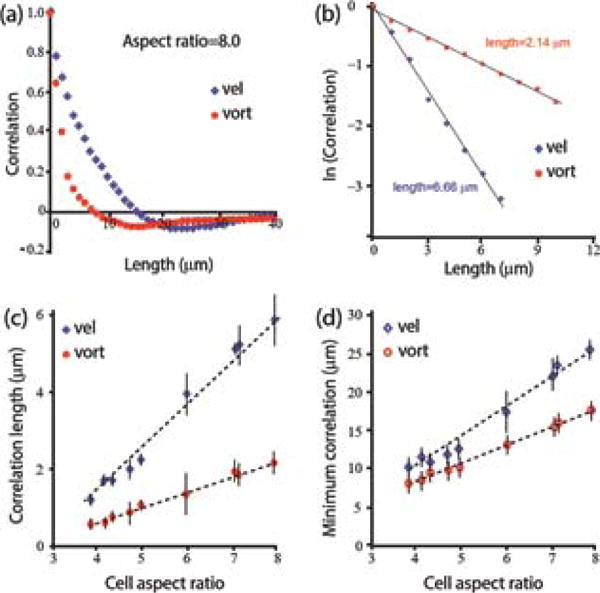
Spatial correlation functions, < v(x,y,s)·v(x+∆x,y+∆y,s) >, are depicted in Fig. 4. All strains exhibited an initial exponential decay (Figs. 4a–b) and become negative due to the vortex-like structure of the velocity field. The correlation length (Fig. 4c) and the locations of the minimum (Fig. 4d) grow monotonically with cell aspect ratio. In contrast with the velocity distribution and temporal correlations, the spatial characteristics, which are approximately linear in the aspect ratio, have a completely different trend.
FIG. 4.

Spatial correlation of the microscopic flow. (a) Example of spatial correlation functions for the velocity and vorticity obtained with a long bacterial strain (DS858, aspect ratio 8.0). (b) Semi-log scale of the data in (a) suggesting exponential decay. All spatial correlation functions are approximately exponential. (c) The correlation length as a function of aspect ratio. (d) The location of the minimum of the graphs in (a).
The word swarming is often used, both in everyday experiences and in the scientific literature, as a general description of collective motion, for example, of insects. However, in bacteria, swarming is defined as a particular mode of motion in which dense populations of flagellated cells move collectively on top of surfaces [1]. In particular, bacterial swarming involves specialized cellular processes and mechanisms. For example, prior to the initiation of swarming, cells differentiate and change their length - a complex mechanical process which consumes resources and energy [1, 2]. Therefore, in light of evolution, the occurrence of such a mechanism suggests that the aspect ratio has a crucial significance to the swarming process.
Indeed, the theory on collective motion of selfpropelled rods have demonstrated that group motion is dictated by the initiation of clusters, which is due, in principle, to hydrodynamic and steric forces between neighboring cells. Theory and simulations have successfully showed that the cell’s aspect ratio can qualitatively change the system’s dynamics and even induce a transition between several distinct phases. However, in accordance with experimental results with WT and other bacterial species having a 5:1 aspect ratio, the predicted swarm dynamics always follows normal statistics, with (approximately) Gaussian velocity distribution and an exponential decay of temporal and spatial correlations. Our results, which are the first experimental attempt to explore these predictions with real cells, show that the current theory clearly underestimates the pivotal role of aspect ratio on the swarm dynamics. The anomalous statistics observed with both short and long cells indicate a more complex behavior with non-Gaussian statistics, suggesting possible intricate interactions between individuals in the group. In addition, all measured quantities seem to depend continuously on aspect ratio and no sharp phase transition could be detected. Despite its successes, current theory falls short at explaining the full range of the complicated dynamics observed with real swarming bacteria.
While the physics underlying the observed anomalous statistics is still not understood, our results contradict some possible explanations. For example, granular particles colliding inelastically can exhibit stretched exponential velocity distributions [42]. Therefore, our results may be due to an increased rate of inelastic collisions between cells that are poorly aligned (if too short) or jammed (if too long). Alternatively, it has been shown that systems of active Brownian particles can split into two coexisting phases with different characteristic speeds [43], which gives rise to an overall non-Gaussian statistics [7]. In order to test these hypotheses, we check whether the 1D distribution of velocities depicted in Fig. 2 is consistent with either a stretched exponential distribution or a mixture of two Gaussians.
Assuming a stretched exponential with parameter 0 < γ ≤ 2 and characteristic speed v0, the 1D density is zs−1e−(|v‖/v0)γ, where zs is a normalization constant. The distribution implies particular relations between the measured mean speed, its variance and the kurtosis. We therefore compare the characteristic speed v0 and the kurtosis κ derived from the direct measurement of γ and either μ, σ2 or κ at each aspect ratio (see Fig. 2). The results, summarized in Table II, show that the assumption that the distribution of velocities is a stretched exponential is inconsistent with our experimental results. This suggests that inelastic collisions between cells are not the only mechanism leading to non-Gaussian velocity distributions in this system. Similarly, assuming 1D velocities are given by a mixture of two Gaussians, their density is given by , where v1 and v2 are the characteristic speeds, 0 ≤ w ≤ 1 is the weight of the first Gaussian and z1,z2 are normalization constants for each Gaussian. For each experiment with a fixed aspect ratio, the measured mean speed, standard deviation and kurtosis determine the three parameters. Most importantly, the characteristic speeds should be the same for all aspect ratios. Table III shows that this assumption is not consistent with the experimental results.
TABLE II.
Assuming stretched exponential distributions of velocities, the characteristic speed ν0 obtained using the measured values of γ and either μ or σ should be the same at all aspect ratios.
| Aspect ratio | ν0 using μ | ν0 using σ | calculated κ | measured κ |
|---|---|---|---|---|
|
| ||||
| 3.8 | 18.9 ± 1.6 | 11.6 ± 1.3 | 4.3 ± 5 | 4.8 |
| 4.1 | 310 ± 1.6 | 19.1 ± 1.2 | 3.7 ± 1.8 | 3.9 |
| 4.3 | 44.5 ± 2 | 25.7 ± 1 | 3.17 ± 0.4 | 3.2 |
| 4.7 | 47.4 ± 5 | 26.5 ± 1.3 | 3.05 ± 0.2 | 3.2 |
| 4.9 | 49.6 ± 1.8 | 29.0 ± 1.4 | 3 ± 0.2 | 3 |
| 6 | 37.1 ± 4.6 | 19.5 ± 1.3 | 3.5 ± 1.5 | 3.1 |
| 7.1 | 23.3 ± 4.4 | 14.9 ± 1 | 3.65 ± 1.3 | 3.5 |
| 7.2 | 20.2 ± 1.2 | 15.5 ± 0.8 | 3.65 ± 1.3 | 3.6 |
| 8 | 13.8 ± 3.9 | 9.2 ± 3.4 | 4.74 ± 5 | 5.1 |
TABLE III.
Assuming that the distributions of velocities are a mixture of two Gaussians, the fitted characteristic speeds v1 and v2 are expected to be the same for all aspect ratios. In addition, the mixture weight w should depend on it continuously.
| Aspect ratio | w | v1 | v2 |
|---|---|---|---|
|
| |||
| 3.8 | 0.002 | 12.6 ± 2.4 | 54.9 ± 11 |
| 4.1 | 0.002 | 18 ± 3 | 66 ± 11 |
| 4.3 | 0 | 22.5 ± 3.8 | 176 ± 30 |
| 4.7 | 0 | 23.0 ± 5.5 | 182 ± 40 |
| 4.9 | 0.96 | 24.2 ± 5.5 | 24.3 ± 5.5 |
| 6 | 1 | 19.3 ± 4.6 | 263 ± 60 |
| 7.1 | 0.004 | 13.6 ± 4 | 38 ± 11 |
| 7.2 | 0.04 | 12.5 ± 3.3 | 23 ± 6 |
| 8 | 0.003 | 10 ± 3 | 42 ± 12 |
To summarize, we have shown that the ability of cells to swarm efficiently is modulated by physical considerations such as cell aspect ratio. From a biological perspective, cells may have developed the complex cellular elongation mechanisms as a sophisticated tuning or regulation mechanism in order to facilitate rapid migration and successful population dissemination.
Supplementary Material
Acknowledgments
D.B.K. acknowledges the NIH grant No. R01 GM093030. G.A and A.B. are thankful for partial support from The Israel Science Foundations grant No. 373/16; A.B. thanks the Roy J. Zuckerberg Career Development Chair for Water Research for partial support.
Footnotes
PACS numbers: 05.65.+b,87.16.−b,87.18.Gh
References
- 1.Harshey RM. Annu Rev Microbiol. 2003;57:249. doi: 10.1146/annurev.micro.57.030502.091014. [DOI] [PubMed] [Google Scholar]
- 2.Kearns DBA. Nat Rev Microbiol. 2010;8:634–644. doi: 10.1038/nrmicro2405. [DOI] [PMC free article] [PubMed] [Google Scholar]
- 3.Copeland MF, Weibel DB. Soft Matter. 2009;5:1174. doi: 10.1039/B812146J. [DOI] [PMC free article] [PubMed] [Google Scholar]
- 4.Darnton NC, et al. Biophys J. 2010;98:2082. doi: 10.1016/j.bpj.2010.01.053. [DOI] [PMC free article] [PubMed] [Google Scholar]
- 5.Ariel G, et al. New J Phys. 2013;15:125019. [Google Scholar]
- 6.Be’er A, Harshey RM. Biophys J. 2011;101:1017. doi: 10.1016/j.bpj.2011.07.019. [DOI] [PMC free article] [PubMed] [Google Scholar]
- 7.Benisty S, et al. Phys Rev Lett. 2015;114:018105. doi: 10.1103/PhysRevLett.114.018105. [DOI] [PubMed] [Google Scholar]
- 8.Zhang HP, et al. Proc Natl Acad Sci USA. 2010;107:13626. doi: 10.1073/pnas.1001651107. [DOI] [PMC free article] [PubMed] [Google Scholar]
- 9.Be’er A, et al. J Bacteriol. 2009;191:5758. doi: 10.1128/JB.00660-09. [DOI] [PMC free article] [PubMed] [Google Scholar]
- 10.Be’er A, et al. J Bacteriol. 2013;195:2709. doi: 10.1128/JB.00080-13. [DOI] [PMC free article] [PubMed] [Google Scholar]
- 11.Ariel G, et al. Nat Comm. 2015;6:8396. doi: 10.1038/ncomms9396. [DOI] [PMC free article] [PubMed] [Google Scholar]
- 12.Ryan SD, Ariel G, Be’er A. Biophys J. 2016;111:247. doi: 10.1016/j.bpj.2016.05.043. [DOI] [PMC free article] [PubMed] [Google Scholar]
- 13.Cisneros LH, et al. Phys Rev E. 2011;83:061907. doi: 10.1103/PhysRevE.83.061907. [DOI] [PubMed] [Google Scholar]
- 14.Wensink HH, et al. Proc Natl Acad Sci USA. 2012;109:14308. doi: 10.1073/pnas.1202032109. [DOI] [PMC free article] [PubMed] [Google Scholar]
- 15.Peruani F, Deutsch A, Br M. Phys Rev E. 2006;74:030904(R). doi: 10.1103/PhysRevE.74.030904. [DOI] [PubMed] [Google Scholar]
- 16.Weitz S, Deutsch A, Peruani F. Phys Rev E. 2015;92:012322. doi: 10.1103/PhysRevE.92.012322. [DOI] [PubMed] [Google Scholar]
- 17.Peruani F, et al. Phys Rev Lett. 2012;108:098102. doi: 10.1103/PhysRevLett.108.098102. [DOI] [PubMed] [Google Scholar]
- 18.Swiecickia JM, Sliusarenko O, Weibel DB. Integr Biol (Camb) 2013;5:1490. doi: 10.1039/c3ib40130h. [DOI] [PMC free article] [PubMed] [Google Scholar]
- 19.Zhou S, et al. Proc Natl Acad Sci USA. 2014;111:1265. [Google Scholar]
- 20.Patrick JE, Kearns DB. Mol Microbiol. 2008;70:1166. doi: 10.1111/j.1365-2958.2008.06469.x. [DOI] [PubMed] [Google Scholar]
- 21.Wolgemuth CW. Biophys J. 2008;95:1564. doi: 10.1529/biophysj.107.118257. [DOI] [PMC free article] [PubMed] [Google Scholar]
- 22.Sokolov A, Aranson IS. Phys Rev Lett. 2012;109:248109. doi: 10.1103/PhysRevLett.109.248109. [DOI] [PubMed] [Google Scholar]
- 23.Dunkel J, et al. Phys Rev Lett. 2013;110:228102. doi: 10.1103/PhysRevLett.110.228102. [DOI] [PubMed] [Google Scholar]
- 24.Sokolov A, et al. Phys Rev Lett. 2007;98:158102(R). doi: 10.1103/PhysRevLett.98.158102. [DOI] [PubMed] [Google Scholar]
- 25.Aranson IS, et al. Phys Rev E. 2007;75:040901(R). doi: 10.1103/PhysRevE.75.040901. [DOI] [PubMed] [Google Scholar]
- 26.Gyrya V, et al. Bulletin of Math Biol. 2010;72:148. doi: 10.1007/s11538-009-9442-6. [DOI] [PubMed] [Google Scholar]
- 27.Ryan SD, et al. Phys Rev E. 2011;83:050904(R). doi: 10.1103/PhysRevE.83.050904. [DOI] [PubMed] [Google Scholar]
- 28.Rabani A, Ariel G, Be’er A. PloS one. 2013;8:e83760. doi: 10.1371/journal.pone.0083760. [DOI] [PMC free article] [PubMed] [Google Scholar]
- 29.Lushi E, Wioland H, Goldstein RE. Proc Nat Acad Sci USA. 2014;111:9733. doi: 10.1073/pnas.1405698111. [DOI] [PMC free article] [PubMed] [Google Scholar]
- 30.Vicsek T, Zafiris A. Physics Reports. 2012;517:71. [Google Scholar]
- 31.Tuson HH, et al. J Bacteriol. 2013;195:368. doi: 10.1128/JB.01537-12. [DOI] [PMC free article] [PubMed] [Google Scholar]
- 32.Mukherjee S, et al. Proc Natl Acad Sci USA. 2015;112:250. [Google Scholar]
- 33.Young KD. Microbiol Mol Biol Rev. 2006;70:660. doi: 10.1128/MMBR.00001-06. [DOI] [PMC free article] [PubMed] [Google Scholar]
- 34.Campos M, et al. Cell. 2014;159:1433. doi: 10.1016/j.cell.2014.11.022. [DOI] [PMC free article] [PubMed] [Google Scholar]
- 35.Rowlett VW, Margolin W. Curr Biol. 2013;23:R553. doi: 10.1016/j.cub.2013.05.024. [DOI] [PubMed] [Google Scholar]
- 36.Gergory JA, Becker EC, Pogliano K. Genes Dev. 2008;22:3475. doi: 10.1101/gad.1732408. [DOI] [PMC free article] [PubMed] [Google Scholar]
- 37.Varley AW, Stewart GC. J Bacteriol. 1992;174:6729. doi: 10.1128/jb.174.21.6729-6742.1992. [DOI] [PMC free article] [PubMed] [Google Scholar]
- 38.Bramkamp M, et al. Mol Microbiol. 2008;70:1556. doi: 10.1111/j.1365-2958.2008.06501.x. [DOI] [PubMed] [Google Scholar]
- 39.Weart RB, et al. Cell. 2007;130:335. doi: 10.1016/j.cell.2007.05.043. [DOI] [PMC free article] [PubMed] [Google Scholar]
- 40.Chien AC, et al. Mol Microbiol. 2012;86:594. doi: 10.1111/mmi.12007. [DOI] [PMC free article] [PubMed] [Google Scholar]
- 41.Guttenplan SB, Shaw S, Kearns DB. Mol Microbiol. 2013;87:211. doi: 10.1111/mmi.12103. [DOI] [PMC free article] [PubMed] [Google Scholar]
- 42.Ben-Naim E, Krapivsky PL. Granular Gas Dynamics. Springer; Berlin Heidelberg: 2003. p. 65. [Google Scholar]
- 43.Romanczuk P, et al. The European Physical Journal Special Topics. 2012;202:1. [Google Scholar]
Associated Data
This section collects any data citations, data availability statements, or supplementary materials included in this article.


