Abstract
Angiotensin II receptors, AT1R and AT2R, serve as key components of the renin-angiotensin-aldosterone system. While AT1R plays a central role in the regulation of blood pressure, the function of AT2R is enigmatic with a variety of reported effects. To elucidate the mechanisms for the functional diversity and ligand selectivity between these receptors, we report crystal structures of the human AT2R bound to an AT2R-selective and an AT1R/AT2R-dual ligand, respectively, capturing the receptor in an active-like conformation. Unexpectedly, helix VIII was found in a non-canonical position, stabilizing the active-like state, but at the same time preventing the recruitment of G proteins/β-arrestins, in agreement with the lack of signaling responses in standard cellular assays. Structure-activity relationship, docking and mutagenesis studies revealed the interactions critical for ligand binding and selectivity. Our results thus provide insights into the structural basis for distinct functions of the angiotensin receptors, and may guide the design of novel selective ligands.
In humans, the effects of the octapeptide hormone angiotensin II (AngII) are mediated by two types of AngII receptors, AT1R and AT2R, which share approximately 34% amino acid sequence identity1,2. AT1R is mainly responsible for blood pressure regulation, with several antagonists and inverse agonists approved for clinical use as anti-hypertensive drugs3. The function of AT2R, on the other hand, is less understood and remains controversial, with a growing number of studies suggesting that AT2R signals primarily via non-canonical, G protein- and β-arrestin-independent pathways4,5. In the cardiovascular system, AT2R has been reported to counteract several of the effects mediated by AT1R6,7, conferring cardioprotection. For example, in vasculature AT2R has been suggested to counter-balance blood pressure elevation exerted by AT1R8,9. It has also been reported that activation of AT2R in cardiomyocytes inhibits autophagy mediated by AT1R10. Moreover, in the central nervous system, AT2R has been implicated in AT1R-independent signaling pathways11–14. It has been observed that activation of AT2R in nociceptive neurons induces neurite outgrowth and elongation15, while studies in sensory neurons selectively expressing AT2R but not AT1R, also supported involvement of AT2R in nociception16–18. Further interest in AT2R as a drug target has been sparkled by the recent finding that the canonical AT2R antagonist PD123319 blocks AngII-induced neuronal excitability, and exhibits oral bioavailability in several neuropathic pain models in rodents17–19. Most excitingly, EMA401, an analog of PD123319, demonstrated efficacy in phase II clinical trials in patients with post-herpetic neuralgia16,20. Interestingly, activation of AT2R by its small molecule agonist Compound 21 (ref. 21) has also been reported to produce a number of beneficial in vivo effects such as inducing pressure natriuresis, lowering blood pressure, conferring acute vaso-relaxation, and exhibiting organ protective effects22,23.
We previously reported crystal structures of AT1R in complex with an antagonist ZD7155 (ref. 24) and with an inverse agonist olmesartan25, which provided insights into AT1R receptor-ligand interactions. The molecular mechanisms of functional diversity and ligand selectivity between AT1R and AT2R, however, remain elusive. With an increasing body of evidence indicating that selective targeting of AT2R could be used for cardioprotection and for the treatment of neuropathic pain, there is an imminent need to elucidate the structural basis for the functional role of this receptor, and to develop type-selective ligands. In this study, we determined crystal structures of AT2R bound to two high-affinity ligands, an AT2R-selective ligand compound 1 (Cpd 1)26 and an AT1R/AT2R-dual ligand compound 2 (Cpd 2)27. Both compounds are derivatives of a series of small-molecule antagonists of AT1R and thus could be assumed to exert the same function in AT2R. However, classification of compounds using traditional G protein-coupled receptor (GPCR) nomenclature into antagonists or agonists has proven difficult for AT2R since it has not been reliably demonstrated to signal through any of the canonical GPCR signaling pathways involving G proteins or β-arrestin. Furthermore, it has been observed numerous times that small changes to the structures of closely related compounds can lead to changes or bias in function28,29. Therefore, we refer to Cpd 1 and Cpd 2 using the neutral term ‘ligand’. In addition to a dramatic reshaping of the ligand-binding pocket between the two receptors, our AT2R structures revealed an active-like conformation of the seven-transmembrane (7TM) helical bundle with a non-canonical positioning of the amphipathic helix VIII, potentially blocking recruitment of intracellular signaling partners.
Structure determination
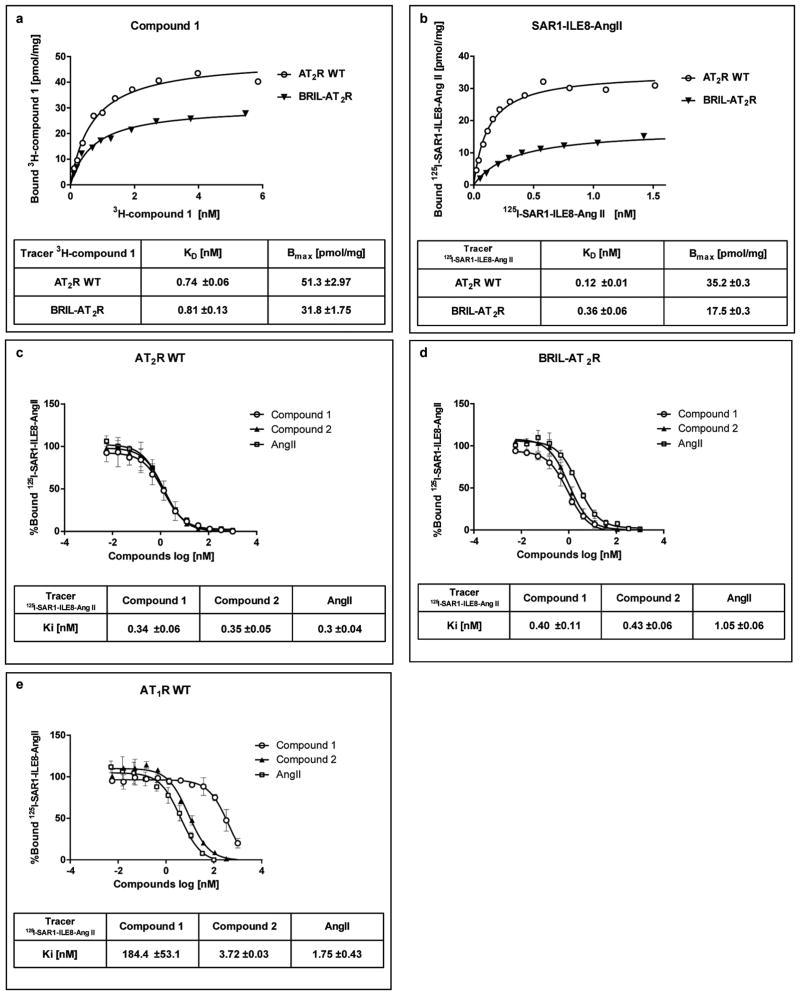
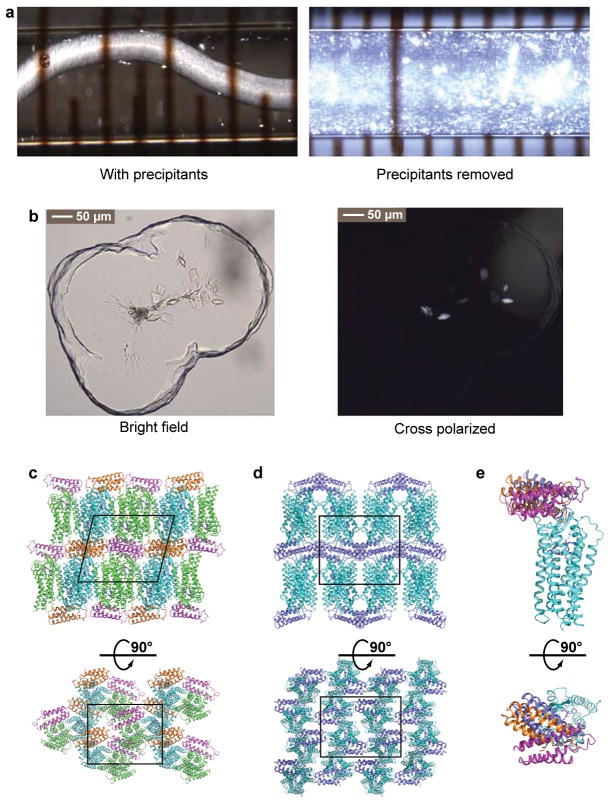
The human AT2R construct used for structure determination was engineered to facilitate crystallization (Extended Data Fig. 1) by truncating the N-terminal residues 1–34 and the C-terminal residues 336–363, and fusing a thermostabilized apocytochrome b562RIL30 to the truncated N-terminus via a 4-residue linker. Compared to wild-type AT2R, the engineered receptor showed no significant difference in the binding to small molecule ligands (Cpds 1 and 2) as determined by radio-ligand binding assays (Extended Data Fig. 2a,c,d). In contrast, the affinities of the peptides AngII and Sar1-Ile8-AngII were slightly lower (~3-fold), a potential consequence of the N-terminal truncation (Extended Data Fig. 2b). AT2R bound to the selective ligand Cpd 1 generated a high density of microcrystals in lipidic cubic phase (LCP)31 with an average size of 5×2×2 μm3 (Extended Data Fig. 3a). These microcrystals were used to collect serial femtosecond crystallography (SFX)32–34 data at an X-ray free-electron laser (XFEL), resulting in two 2.8 Å resolution room temperature structures solved in monoclinic and orthorhombic space groups, respectively (Extended Data Table 1). In parallel, we solved another AT2R structure in complex with the non-selective AT1R/AT2R dual ligand Cpd 2 at 2.9 Å resolution (Extended Data Table 1) by synchrotron radiation, using cryo-cooled crystals with an average size of 70×40×20 μm3 (Extended Data Fig. 3b). All three AT2R structures showed nearly identical conformations of the receptor (RMSDCα < 0.5 Å). Since the orthorhombic AT2R-Cpd 1 structure is the most complete, we used it for the description of the overall AT2R structure below, unless noted otherwise.
Active-like conformation of 7TM bundle
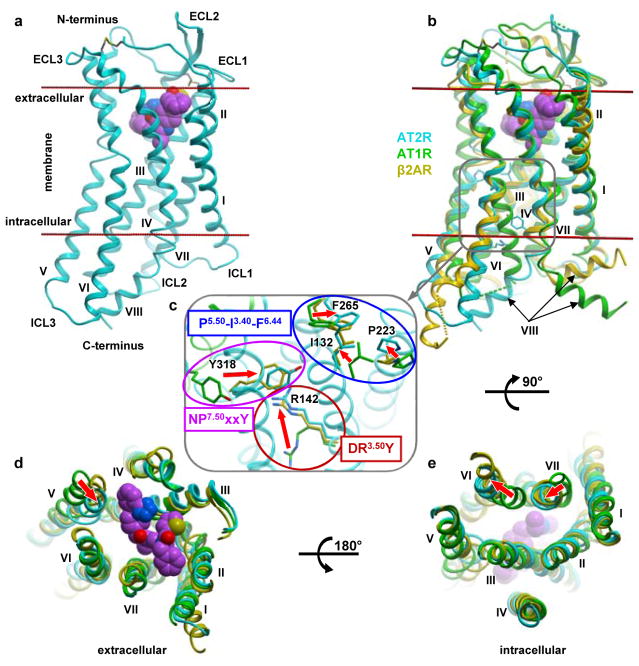
The overall architecture of AT2R is comprised of a 7TM bundle (helices I–VII) and an intracellular amphipathic helix VIII (Fig. 1a). Similar to AT1R and other peptide-binding GPCRs24, AT2R exhibits a β-hairpin conformation of the extracellular loop 2 (ECL2) and two pairs of disulfide bonds linking the N-terminus with ECL3 (Cys35N-term-Cys290ECL3), and helix III with ECL2 (Cys1173.25-Cys195ECL2, superscripts indicate residue numbers as per the Ballesteros-Weinstein nomenclature35). A closer comparison of the AT1R and AT2R structures, however, revealed substantially different conformations (Fig. 1b–e). While the previously determined AT1R structures captured the receptor in a classical inactive state, all three AT2R structures, obtained in this work, display an active-like conformation. Specifically, the intracellular end of helix VI shows an outward displacement by ~11.5 Å, whereas the intracellular end of helix VII exhibits an inward displacement by ~4.9 Å, as compared to the structures of inactive AT1R (Fig. 1e). Similar large-scale shifts of helices VI and VII that open an intracellular cleft for the recruitment of G proteins/β-arrestins have been implicated in activation of all class A GPCRs36,37. Another major conformational rearrangement occurs at the extracellular end of helix V, which is shifted toward the ligand-binding pocket by ~4.8 Å, compared to AT1R (Fig. 1d). Similar shifts of the extracellular part of helix V, although typically with a smaller ~2 Å amplitude, have been observed in structures of several activated GPCRs, such as the β2-adrenergic (β2AR) and serotonin 5-HT2B receptors38,39. Such agonist-stabilized displacement of helix V is critical for triggering re-arrangements in the P5.50-I3.40-F6.44 motif leading to activation of these receptors38–40.
Figure 1. Active-like conformation of AT2R.
a, Overall receptor architecture. Cpd 1 is shown as spheres with carbon atoms in magenta, nitrogen in blue, oxygen in red, and sulfur in yellow. Membrane boundaries as defined by the OPM web server (www.opm.phar.umich.edu) are shown as red lines. b–e, Structural comparison of the active-like AT2R (cyan) with the inactive AT1R (green, PDB 4YAY), and active G protein-bound β2AR (yellow, PDB 3SN6) viewed from within the membrane (b), the extracellular side (d), and the intracellular side with helix VIII removed (e). The magnified region in (c) shows details of microswitches in the conserved motifs. The backbone of AT2R is shown in cyan cartoon, while distinct inactive position of AT1R helix VII is shown in green. Red arrows indicate conformational changes associated with receptor activation.
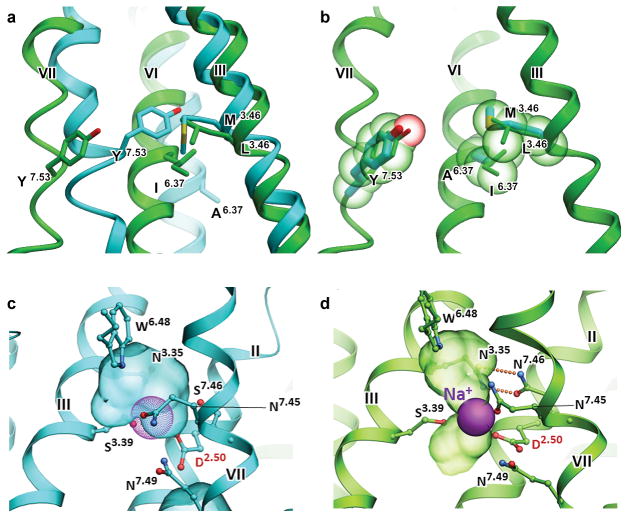
The large-scale re-arrangements of helices during activation are accompanied by conformational changes in the conserved micro-switches36. We therefore compared the DR3.50Y, NP7.50xxY, and P5.50-I3.40-F6.44 motifs of AT2R with those in the structures of inactive AT1R and of fully activated GPCRs, such as Gs protein-bound β2AR38 and arrestin-bound rhodopsin38,41. The large-scale movement of helix VI upon activation is enabled by re-arrangements in the P5.50-I3.40-F6.44 motif (Pro2235.50-Ile1323.40-Phe2656.44 in AT2R) as it was previously demonstrated in other structures of activated GPCRs (Fig. 1c). In the DR3.50Y motif, the Arg1423.50 side chain of AT2R is rotated by ~90° compared to Arg1263.50 in AT1R, adopting a similar conformation as in other fully activated GPCRs. Additionally, in the NP7.50xxY motif, the side chain of Tyr3187.53 is shifted by ~6.5 Å and rotated by ~45° from the corresponding position of Tyr3027.53 in AT1R, following the inward movement of helix VII, as observed in other receptors upon activation. Finally, analysis of the conserved residue switch37 in the G protein-binding pocket L[M]3.46–I[A]6.37–Y[Y]7.53 (AT2R residues are shown in brackets) confirms the rearrangement of interactions in this residue triad consistent with an active-like state of AT2R (Extended Data Fig. 4a,b). Interestingly, instead of a highly conserved large hydrophobic residue in position 6.37, AT2R has a rare alanine residue (~3% of class A GPCRs), which drastically reduces the hydrophobic contact area between helices III and VI in the inactive state, and likely facilitates the activation related changes in AT2R. Therefore, all of the major conformational features indicate that the 7TM bundle of AT2R adopts an active-like conformation, similar to that observed in the crystal structures of other fully activated class A GPCRs bound to signaling partners or their mimics.
In addition to the conserved micro-switches, a sodium-binding site consisting of sixteen highly conserved residues is expected to undergo large-scale conformational changes upon activation of class A GPCRs42. Superposition of AT2R with AT1R revealed that the putative sodium-binding pocket in AT2R is collapsed and rearranged, hindering sodium ion binding (Extended Data Fig. 4c,d), primarily due to the inward shift of helix VII, which is consistent with the structures of other activated GPCRs42. Only two out of sixteen residues in the putative sodium pocket (Ile1353.43 and Ser3117.46) are different from their counterparts in AT1R (Leu1193.43 and Asn2957.46). Interestingly, Asn2957.46Ala mutation was implicated in the AT1R constitutive activation43,44, potentially due to the disruption of two hydrogen bonds between Asn2957.46 and Asn1113.35 that stabilize the inactive conformation. In contrast, Ser3117.46 in AT2R cannot engage in a similar interaction with Asn1273.35, potentially shifting the conformational equilibrium toward the active state. Indeed, AT2R has been reported to have high constitutive activity, and to induce apoptosis even in the absence of AngII stimulation45,46.
Helix VIII blocks putative G protein/β-arrestin binding site
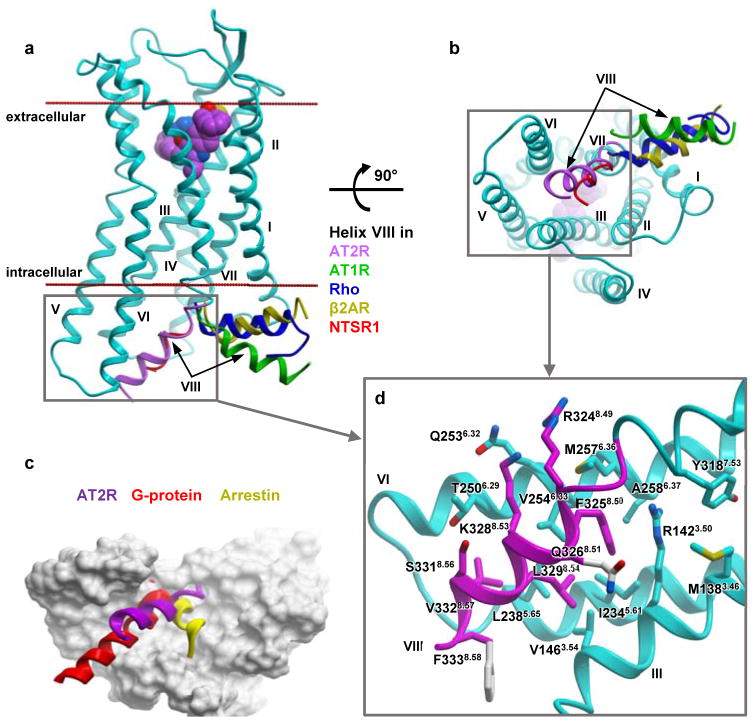
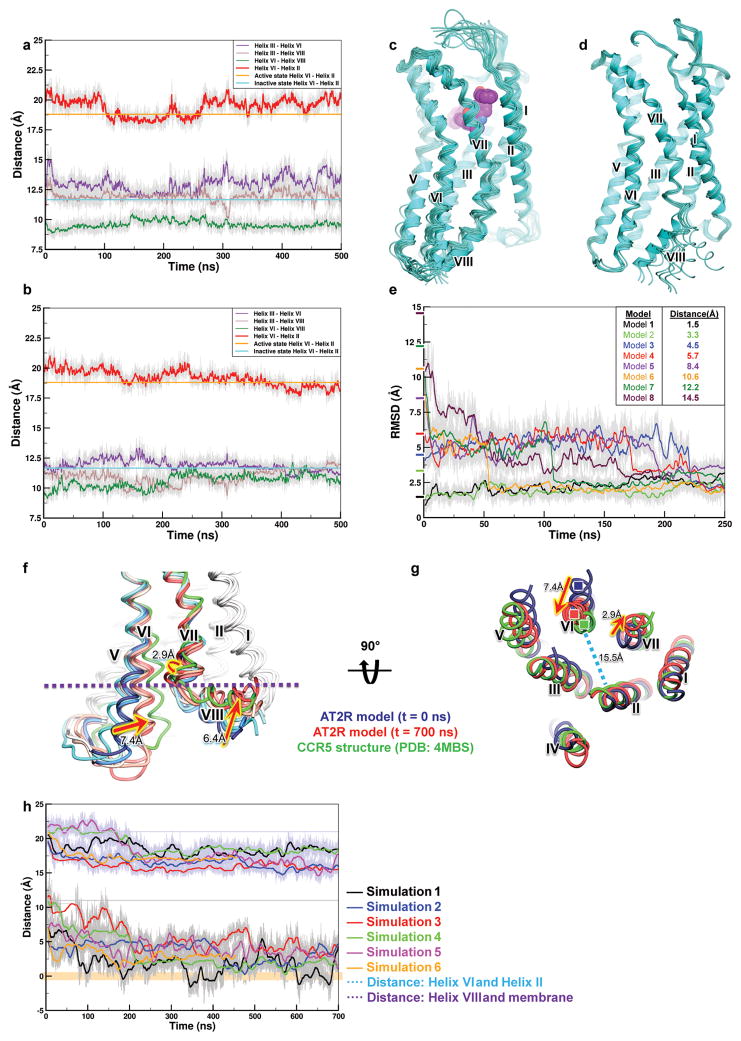
In most GPCR structures, helix VIII lies parallel to the membrane pointing outside of the 7TM bundle24, regardless of the receptor’s activation state (Fig. 2a,b). Surprisingly, in the AT2R structures helix VIII adopts a very different conformation by flipping over to interact with the intracellular ends of helices III, V, and VI (Fig. 2c). This non-canonical conformation of helix VIII was found in all AT2R structures determined in this study, regardless of the ligand identity and different crystal packing environments (Extended Data Fig. 3c–e), suggesting it to be likely a genuine feature of AT2R, rather than an artifact of crystallization. Helix VIII forms a highly complementary interface with the intracellular cavity of the 7TM bundle, stabilized by extensive hydrophobic interactions mediated by Phe3258.50, Leu3298.54, Val3328.57, and Phe3338.58, as well as by polar interactions between Arg3248.49, Gln3268.51, and Lys3288.53, and helices III, V, and VI (Fig. 2d). Docking and molecular dynamics (MD) simulations suggest that helix VIII stabilizes the active-like conformation of the 7TM bundle of AT2R, while sterically blocking the binding of G proteins and β-arrestins (Fig. 2c), which is consistent with the lack of robust downstream signaling by AT2R as assessed by traditional G protein and β-arrestin assays4,5. In MD simulations, helix VIII not only remained in the range of positions within RMSD < 4 Å to the crystallographic structure for a total of 4 μs of unbiased simulation (Extended Data Fig. 5a–c), but also quickly (< 200 ns) and reproducibly (n=4) returned to this conformation after consequent pertubations of its position (Extended Data Fig. 5d,e). Alternatively, when helix VIII was relocated to the position observed in the AT1R structures, it relaxed into a canonical membrane-bound conformation, and this motion was accompanied by an inward shift of the intracellular tip of helix VI towards its position in the inactive state AT1R structure in three out six independent MD runs (Extended Data Fig. 5f–h).
Figure 2. Helix VIII blocks putative G protein/β-arrestin binding site of AT2R.
a, b, Varied positions of helix VIII in different GPCRs shown as cartoons. AT2R is in cyan with helix VIII colored magenta, AT1R (PDB 4YAY) in green, NTSR1 (PDB 4GRV) in red, G protein-bound β2AR (PDB 3SN6) in yellow, and arrestin-bound rhodopsin in blue (PDB 4ZWJ), viewed from within the membrane (a) and from the intracellular side (b). c, Shared interaction sites of AT2R 7TM domain (grey surface) for the helix VIII of AT2R (magenta), the C-terminus of G protein (red), and the finger loop of arrestin (yellow). d, interactions between helix VIII (magenta) and helices III, V, VI (cyan) in AT2R. Side chains of helix VIII not resolved in the crystal structure are shown with grey carbon atoms.
Insights into AT1R/AT2R ligand selectivity
Many AT1R and AT2R ligands share a biphenyl-tetrazole scaffold important for ligand binding affinity. However, molecular mechanisms for ligand selectivity between the two types of angiotensin receptors remain elusive. Our radioligand competition binding studies with Cpd 2 obtained Ki values of 3.7 nM and 0.35 nM for binding to AT1R and AT2R, respectively, indicating this compound is a dual ligand with only about 10-fold selectivity for AT2R over AT1R. In contrast, Cpd 1 exhibited an approximately 530-fold selectivity towards AT2R, with Ki values of 180 nM and 0.34 nM for AT1R and AT2R, respectively (Extended Data Fig. 2c,e).
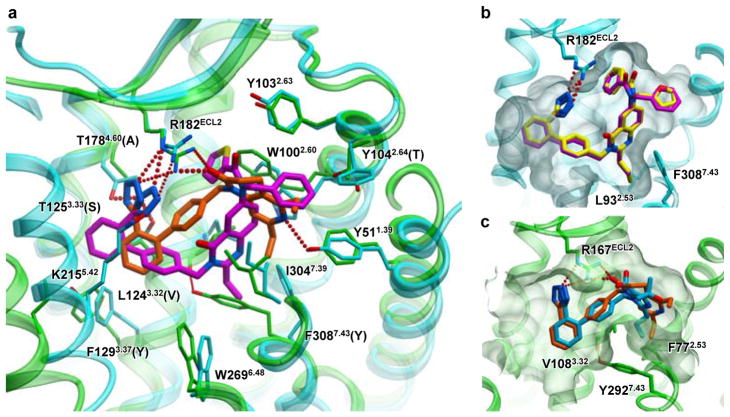
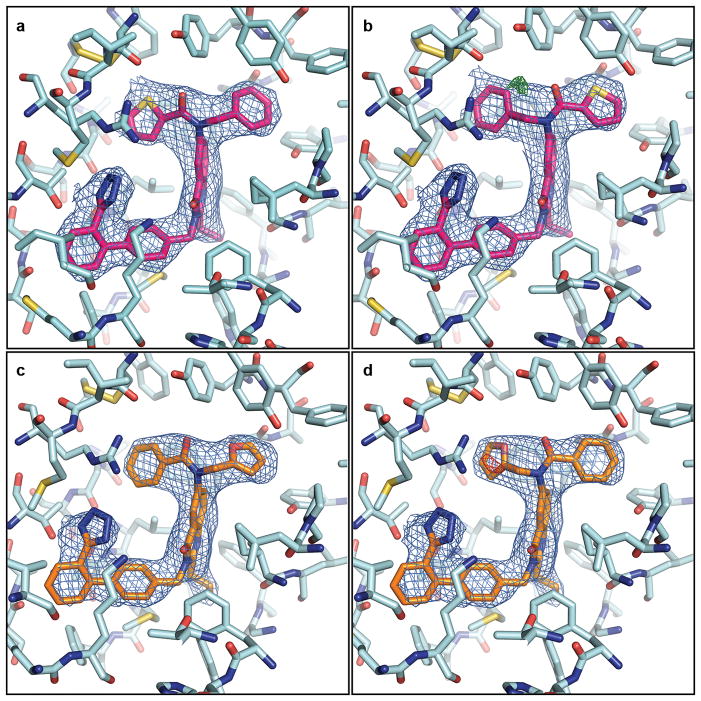
In all three AT2R structures, strong electron density was observed in the orthosteric ligand-binding pocket enabling accurate placement of both Cpds 1 and 2 (Extended Data Fig. 6). We compared the positions and interactions of these compounds bound to AT2R with two ligands bound to AT1R (the AT1R selective antagonist ZD7155, and the AT1R selective inverse agonist olmesartan) (Fig. 3). Surprisingly, despite the common scaffold the ligands bind to the two receptor types very differently, with only the tetrazole moieties partially overlapping and forming critical hydrogen bonds with an arginine in ECL2 (Arg167ECL2 in AT1R and Arg182ECL2 in AT2R). The overall biphenyl-tetrazole scaffold of the AT2R-bound ligands, however, is rotated about 45° as compared to its orientation in the AT1R-bound ligands, forming a distinct interaction pattern (Fig. 3a). Interestingly, ArgECL2, Tyr1.39, and Trp2.60, previously identified as key residues for ligand binding in AT1R, also provide critical protein-ligand contacts in AT2R, although with different side chain conformers. The side chain of Trp1002.60 in AT2R is shifted ~3.1 Å compared to Trp842.60 in AT1R to form hydrophobic interactions with the thiophene ring of Cpd 1 and the benzene ring of Cpd 2, both on the carbonyl side of the AT2R ligands. On the other side of the carbonyl moiety, Thr882.64 in AT1R is replaced with Tyr1042.64 in AT2R that forms new hydrophobic interactions with the benzene ring of Cpd 1 and the furan ring of Cpd 2. Moreover, the tetrazole moiety of the AT2R ligands is engaged in new polar interactions with Lys2155.42, Thr1253.33 and Thr1784.60 side chains, in addition to Arg182ECL2. The bottom part of the ligand-binding pocket in AT2R is expanded due to a smaller side chain of Leu932.53 compared to Phe772.53 in AT1R and a ~5.2 Å shift of Phe3087.43 compared to Tyr2927.43 in AT1R (Fig. 3b, c). In AT1R, Tyr2927.43 forms a hydrogen bond with the backbone of helix III, while in AT2R, Phe3087.43 is unable to form this interaction and is shifted over in concert with a pronounced shift in the backbone of helix VII. This rearrangement opens a sub-pocket for the binding of the ethyl and propyl moieties of Cpds 1 and 2. Overall, these changes result in different shapes of the ligand-binding pocket between the two angiotensin receptors and a deeper ligand binding in AT2R.
Figure 3. Ligand selectivity between AT1R and AT2R.
a, Comparison of binding modes of different ligands in AT1R (green) and AT2R (cyan) binding pockets. The side chains in contact with ligands are shown as sticks with labels representing AT2R and AT1R residues in the corresponding positions. b, c, Comparison of the ligand-binding pockets between AT2R (cyan) and AT1R (green). Receptors are shown in the same orientation of transmembrane helices with the conserved ArgECL2 (Arg167ECL2 in AT1R and Arg182 ECL2 in AT2R) aligned. The ligands are shown as thick sticks, with carbon atoms of the AT2R ligands Cpd 1 in magenta, Cpd 2 in yellow, the AT1R ligands ZD7155 in orange, and olmesartan in blue.
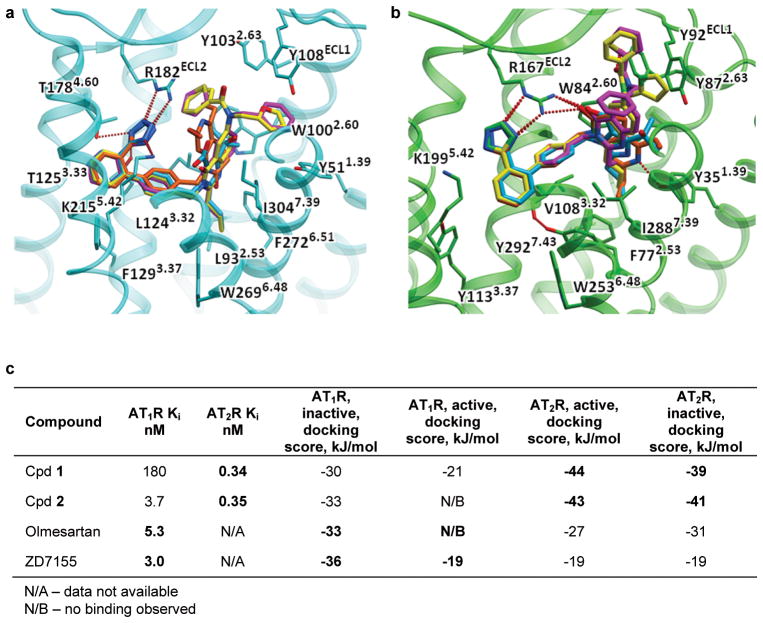
To gain additional insights into receptor type selectivity, we modeled an active-like state for AT1R and an inactive state for AT2R, and performed unrestrained cross-docking of ZD7155, olmesartan, Cpds 1 and 2 into the crystal structures and models of both receptors (Extended Data Fig. 7). The results suggest that while the conformational state of AT2R has little effect on the ligand binding, the predicted active-like conformation of AT1R is not compatible with binding of any of the tested ligands, corroborating the status of these ligands as antagonists for AT1R. Furthermore, the binding modes of these ligands are imposed by the distinct shapes of the binding pockets of the two receptors. Indeed, the biphenyl-tetrazole moieties of Cpds 1 and 2 docked to AT1R crystal structure strongly preferred binding modes similar to those of olmesartan and ZD7155 (Extended Data Fig. 7a,b). The only differences were observed in the orientation of the benzene and heterocyclic rings of Cpds 1 and 2, which occupy the upper part of the ligand-binding pocket, beyond the interaction site of olmesartan and ZD7155. Similarly, docking into the AT2R structure suggested that ZD7155 and olmesartan can fit in the AT2R pocket, with their biphenyl-tetrazole scaffolds closely following the scaffolds of Cpds 1 and 2 in the corresponding AT2R crystal structures. Although docking supports binding of all four ligands in both AT1R and AT2R crystal structures, the binding scores of the ligands vary significantly, reflecting different interactions of non-scaffold groups. The scores also qualitatively reflect differences in the affinities of these compounds, with the cognate ligands showing substantially better binding scores than the off-target binders.
Mutagenesis of the ligand-binding pocket validates crystal structures
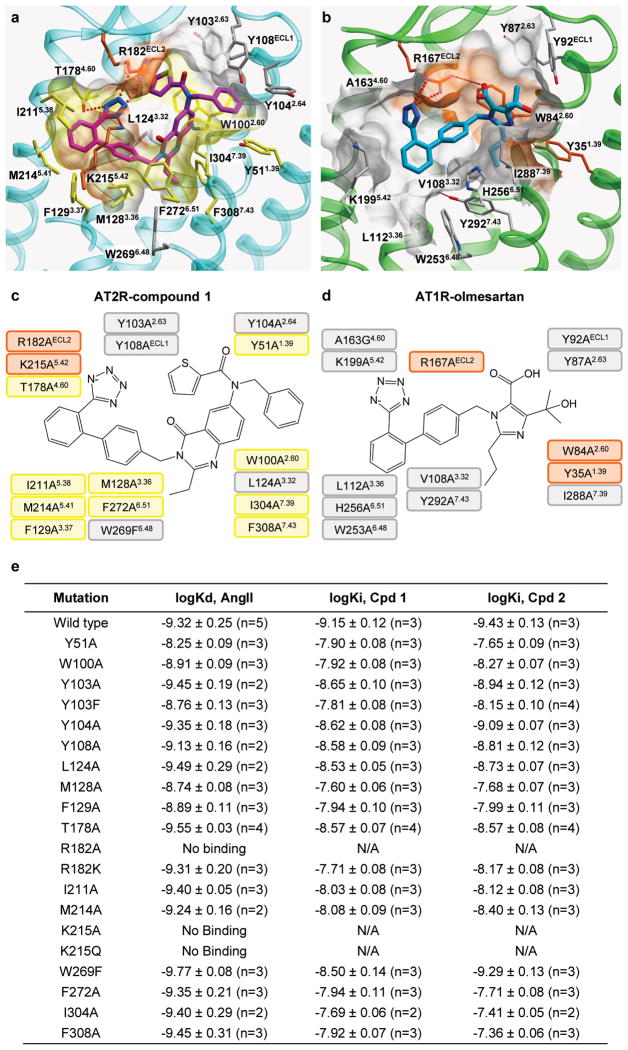
Point mutations were introduced in 17 residues of the AT2R ligand-binding pocket and their effects on ligand affinity were assessed for [3H]AngII peptide, as well as for the small molecule Cpds 1 and 2 in [3H]AngII competition assays (Supplementary Discussion and Extended Data Fig. 8).
Overall, the effects of mutations in the binding pocket of AT2R are consistent with the receptor-ligand interactions observed in the co-crystal structures with Cpds 1 and 2. At the same time, most of these effects are distinct from the effects in AT1R-sartan complexes, corroborating the substantial differences in the ligand binding modes between AT2R and AT1R. Note that the effects of binding pocket mutations are practically identical for Cpds 1 and 2, with the only notable exception of Trp2696.48Phe modestly (~5-fold) affecting affinity of Cpd 1, but not of Cpd 2.
SAR provides further insights into receptor selectivity
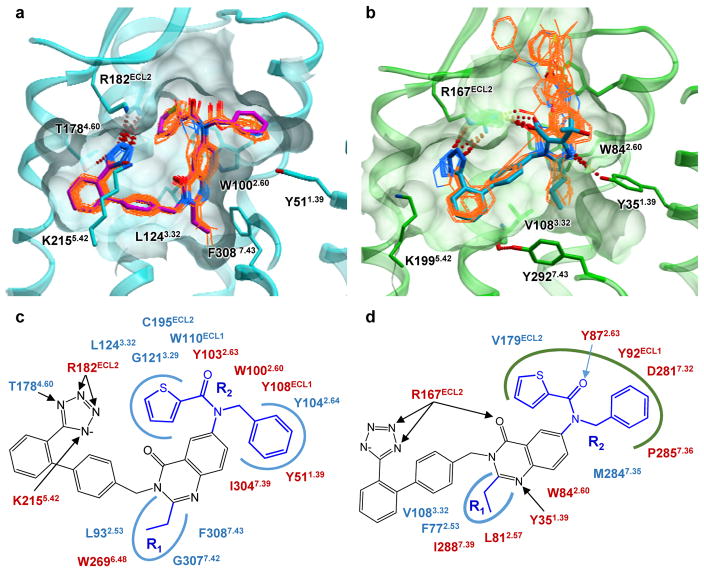
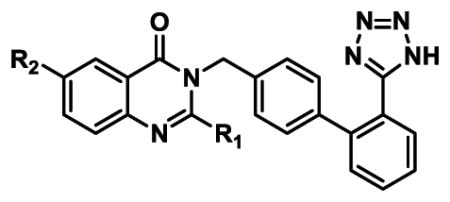
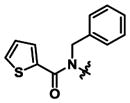
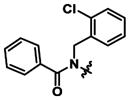
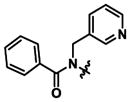
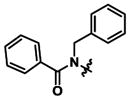
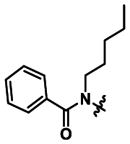
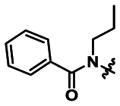
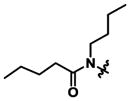
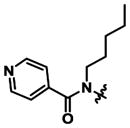
The structure-activity relationship (SAR) of Cpd 1 analogs was studied using derivatization of the 3- (R1) and 7- (R2) positions of the quinazolinone core (Extended Data Table 2), and its structural basis was analyzed by molecular docking to the AT1R and AT2R crystal structures (Fig. 4). The SAR dataset comprised a series of 14 compounds spanning a wide range of selectivity for the two receptor types. Two members of the series were found to be highly selective for AT2R (530-fold for Cpd 1 and 410-fold for Cpd 3), while two others showed a high degree of selectivity for AT1R (1,120-fold for Cpd 9 and 180-fold for Cpd 13). The remaining compounds exhibited moderate (<15 fold) to no selectivity.
Figure 4. Docking and SAR analysis of quinazolinone-biphenyltetrazole derivatives in AT2R and AT1R.
a, b, Docking poses for compounds from Extended Data Table 2 in the crystal structures of AT2R (a) and AT1R (b). Key side chains are shown as sticks. The ligands from the co-crystal structures, Cpd 1 for AT2R and olmesartan for AT1R, are shown as sticks with magenta and cyan carbons, respectively. The docked SAR analogs are shown as thin sticks with orange carbons. c, d, Schematics of interactions for docked compounds into AT2R (c) and AT1R (d) crystal structures. Residues conserved between AT2R and AT1R are shown in red, non-conserved residues are shown in blue. Well-defined hydrophobic pockets are shown as blue shapes, the loose hydrophobic pocket of AT1R is shown as a green shape.
The SAR data showed that the R1 substituent is critical for high AT2R selectivity, while the R2 substituent mostly defines a high selectivity towards AT1R (Extended Data Table 2). Despite the dramatic differences in the pocket shapes and ligand-binding poses between AT2R and AT1R, the docking results provide important insights into the structural basis of SAR observations and directions for optimization of AT2R selective ligands (see Supplementary Discussion).
Conclusions
The two types of the AngII receptor are distinct in terms of their genetic variations, tissue specific expression, signaling, and regulation, as well as other physiological and pharmacological properties1,47. Although all of the conserved motifs of class A GPCRs are present in AT2R, it exhibits an atypical behavior compared to other receptors1. Discerning the AT2R-specific signaling pathways has been challenging and remains unresolved to date4,5. The features revealed in the AT2R structures reported here might provide potential explanations for its poor coupling to G proteins/β-arrestins. Based on our results, we hypothesize that helix VIII can play a dual role in the modulation of AT2R function. On the one hand, upon adopting a conformation captured in the crystal structures, helix VIII may stabilize an active-like receptor state, while repressing canonical AT2R activity in a self-inhibitory manner by sterically blocking the G protein/β-arrestin binding site. On the other hand, upon switching to a membrane-bound conformation helix VIII can support the recruitment of G proteins/β-arrestins for AT2R signaling. Therefore, helix VIII may work as a gatekeeper for either suppression or activation of the receptor depending on its post-translational modifications and interactions with various receptor partners and its environment. This hypothesis is consistent with the previously observed failure of AT2R to internalize, thus prolonging biological responses without desensitization48,49. Further investigation is needed to fully understand this phenomenon.
Both AngII receptors are important drug targets, since the blockade of AT1R has anti-hypertensive effects, while the modulation of AT2R could be useful for cardioprotection, neuropathic pain relief and treatment of a variety of other conditions. Designing molecules that selectively bind to a specific receptor type is often challenging but can be critical for different therapeutic purposes. Although the AT1R and AT2R ligands share common scaffolds, the ligand-binding pockets of these two receptors are strikingly different, and these differences could be exploited for designing selective ligands. The AT2R crystal structures determined in this study improve our understanding of the two types of the human angiotensin receptors and provide new insights into the structural basis for the binding and selectivity of small molecules of therapeutic significance. Our results are therefore expected to facilitate the rational structure-based drug design for improved selectivity.
METHODS
No statistical methods were used to predetermine sample size. The experiments were not randomized and the investigators were not blinded to allocation during experiments and outcome assessment.
Protein engineering for structural studies
DNA encoding the human AT2R (UNIPROT P50052) was synthesized by GenScript with optimization for expression in insect cells. The construct has truncations of the AT2R residues 1–34 and 336–363. The thermostabilized apocytochrome b562RIL (BRIL) from E. coli with mutations Met7Trp, His102Ile, and Arg106Leu was fused to the N-terminus of AT2R, with a 4-residue linker (Gly-Ser-Gly-Ser). The BRIL-AT2R chimera sequence was subcloned into vector pFastBac1 (Invitrogen), with N-terminal haemagglutinin (HA) signal sequence, a FLAG tag, a 10×His tag, and a tobacco etch virus (TEV) protease cleavage site.
Protein expression and purification
The BRIL-AT2R protein was expressed in Spodoptera frugiperda (Sf9) insect cells (ATCC CRL-1711) using the Bac-to-Bac baculovirus expression system (Invitrogen). Cells were lysed by repeated washing and centrifugation, with hypotonic buffer (10 mM HEPES, pH 7.5, 10 mM MgCl2, 20 mM KCl) and high osmotic buffer (10 mM HEPES, pH 7.5, 1.0 M NaCl, 10 mM MgCl2, 20 mM KCl), adding EDTA-free complete protease inhibitor cocktail tablets (Roche). The washed membranes were suspended in hypotonic buffer with 2 mg/ml iodoacetamide for 30 min at 4 °C, and then solubilized in 100 mM HEPES, pH 7.5, 800 mM NaCl, 0.5% (w/v) n-dodecyl-beta-D-maltopyranoside (DDM, Anatrace), 0.1% (w/v) cholesterol hemisuccinate (CHS, Sigma-Aldrich), and 10% (v/v) glycerol, for 4 hours at 4 °C. The solubilized BRIL-AT2R protein was then bound to TALON IMAC resin (Clontech) overnight. The resin was washed with 10 column volumes of wash buffer I (50 mM HEPES, pH 7.5, 400 mM NaCl, 5% (v/v) glycerol, 0.1% (w/v) DDM, 0.02% (w/v) CHS, 10 mM imidazole), and 10 column volumes of wash buffer II (20 mM HEPES, pH 7.5, 200 mM NaCl, 5% (v/v) glycerol, 0.05% (w/v) DDM, 0.01% (w/v) CHS, 20 mM imidazole). The BRIL-AT2R protein was eluted by 3 column volumes of elution buffer (20 mM HEPES, pH 7.5, 100 mM NaCl, 5% (v/v) glycerol, 0.02% (w/v) DDM, 0.004% (w/v) CHS, 300 mM imidazole), then incubated with 100 μM of ligand (Cpd 1 or 2), treated overnight with TEV protease to remove tags, and concentrated to 15 mg/ml with a 100 kDa cutoff concentrator (Vivaspin). The protein yield and monodispersity were tested by analytical size exclusion chromatography (aSEC).
Lipidic cubic phase crystallization
The AT2R protein was reconstituted in lipidic cubic phase (LCP) by mixing the protein with monoolein supplemented with 10% cholesterol at a protein/lipid ratio of 2:3 (v/v) using a lipid syringe mixer. Crystallization trials were performed with an NT8-LCP robot (Formulatrix) in 96-well glass sandwich plates (Marienfeld) using 40 nL protein-loaded LCP and 800 nL precipitant solution per well. Plates were stored at 20 °C and imaged using a RockImager 1000 (Formulatrix). Crystals of AT2R-Cpd 2 grew to an average size of 70×40×20 μm3 within 21 days in 100 mM Tris-HCl, pH 8.0, 25–100 mM potassium formate, 25–35% (v/v) PEG400, and 0.3–1.2% (w/v) 1,6-hexanediol. Crystals were harvested using micromounts (MiTeGen) directly from LCP and flash-frozen in liquid nitrogen for diffraction data collection at the synchrotron radiation beamline. Micro-crystals of AT2R-Cpd 1 for XFEL data collection were prepared by injecting 5 μl protein-laden LCP aliquots into 100 μl gas-tight syringes filled with 60 μl precipitant solution (100 mM Tris-HCl, pH 8.0, 25 mM potassium formate, 25% (v/v) PEG400, and 0.3% (v/v) (+/−)-2-Methyl-2,4-pentanediol). The crystals grew to an average size of 5×2×2 μm3 within 5 days at 20 °C. Before loading the micro-crystals into the LCP injector, the excess precipitant solution was carefully removed from the syringes, and the remaining LCP with embedded crystals was consolidated together. Approximately 20% (v/v) 7.9 MAG was added and mixed with the LCP, to absorb the residual precipitant solution and prevent the formation of lamellar crystalline phase due to rapid evaporative cooling when injecting LCP into vacuum34.
Diffraction data collection using synchrotron radiation
Crystallographic diffraction data collection was performed at 23ID-D beamline (GM/CA) of the Advanced Photon Source in the Argonne National Laboratory. Diffraction data from 47 crystals of AT2R-Cpd 2 were collected using a Pilatus3 6M detector with an unattenuated 10 μm minibeam (wavelength 1.0330 Å). Data were collected using 2 s exposure and 0.5° oscillation with the maximum wedge of 20° per crystal, and then integrated, scaled and merged using XDS50.
Diffraction data collection using X-ray free-electron laser
Serial Femtosecond Crystallography (SFX) data collection was performed using the CXI instrument at the Linac Coherent Light Source (LCLS) at SLAC National Accelerator Laboratory. The LCLS was operated at a wavelength of 1.3 Å (9.57 keV) delivering individual X-ray pulses of 40 fs pulse duration and ~1011 photons per pulse focused into a spot size of approximately 1.5 μm in diameter using a pair of Kirkpatrick-Baez mirrors. Microcrystals of AT2R-Cpd 1 were delivered in the LCP media using a microextrusion injector34 with 50 μm nozzle running at ~220 nL/min flow rate. Diffraction images were recorded at a rate of 7,200 patterns per minute (120 Hz) with the 2.3 Megapixel Cornell-SLAC Pixel Array Detector (CSPAD). A total of 2,701,530 images were collected, 175,241 of which were identified as hits with the Cheetah program (6.5% hit rate). Surprisingly, indexing revealed two different lattices, monoclinic and orthorhombic, apparently belonging to different microcrystals of AT2R-Cpd 1 co-existing in the same crystallization batch. Therefore, 22,774 hits were successfully indexed in a 2/m Laue group and 15,804 hits in a mmm Laue group with different lattice parameters. Both datasets were merged separately using the standard CrystFEL pipeline51 of Monte Carlo averaging without additional scaling step applying per-pattern resolution cutoff with ‘pushres 1.2’ option.
Structure determination
The structure was initially solved using molecular replacement (MR) with the monoclinic data sets collected at XFEL and synchrotron source. MR models for AT2R were produced by alignment of AT2R sequence with sequences of previously solved GPCRs. The top 20 templates were further edited to preserve the conserved residues and trim non-conserved residues to alanines. MR search with Phaser52 identified locations of two receptors in asymmetric unit with a TFZ > 9. Further MR search with fixed positions of the two receptors using PDB ID 1MT6 as the search model for BRIL found one BRIL molecule in the asymmetric unit. Refinements and model completion were performed by repetitive cycling between Refmac5 and autoBUSTER, followed by manual examination and rebuilding of the refined coordinates in Coot53, using both 2mFo-DFc and mFo-DFc maps, as well as omit maps calculated using Bhat’s procedure54. The second BRIL molecule was modeled manually in the available electron density when Rfree dropped below 0.33. The final data collection and refinement statistics are shown in Extended Data Table 1. The Ramachandran statistics determined by MolProbity55 are as follows: 96.8% in favored region, 3.2% allowed, 0 outlier for monoclinic AT2R-Cpd 1; 97.6% in favored region, 2.4% allowed, 0 outlier for orthorombic AT2R-Cpd 1; 97.4% in favored region, 2.6% allowed, 0 outlier for AT2R-Cpd 2.
Docking simulations
AT1R and AT2R selective and non-selective ligands were docked into the AT1R and AT2R crystal structures, AT1R active-like state and AT2R inactive state models using an energy-based docking protocol implemented in ICM molecular modeling software (Molsoft, LLC). The structures of the receptors were protonated and optimized using an ICM docking pipeline. The active and inactive state receptor models were obtained using homology modeling algorithm implemented in ICM. Crystal structures of AT2R and AT1R were used as templates for the AT1R active-like state model and the AT2R inactive state model, respectively. Molecular models of the compounds were generated from two-dimensional representations and their 3D geometry was optimized using MMFF-94 force field56. Molecular docking employed biased probability Monte Carlo (BPMC) optimization of the ligand internal coordinates in the grid potentials of the receptor57. To ensure exhaustive sampling of the ligand binding pose parameter thoroughness was set to 30 and at least five independent docking runs were performed for each ligand starting from a random conformation. The results of individual docking runs for each ligand were considered consistent if at least three of the five docking runs produced similar ligand conformations (RMSD < 2.0 Å) and binding score < −25.0 kJ/mol. The unbiased docking procedure did not use distance restraints or any other a priori derived information for the ligand-receptor interactions.
Molecular dynamics
The initial receptor coordinates were derived from the AT2R crystal structures in complexes with Cpd 1 and Cpd 2. The N-terminal fusion partner BRIL was removed and the terminal amino acids Cys35 and Arg337 were acetylated and amidated, respectively. We used ICM-Pro package (www.molsoft.com) to construct the model in the regions of missing electron densities for side chains and especially for the intracellular loop (ICL) regions. The orientations of AT2R in the apo and the ligand bound models were aligned to AT1R orientation in the membrane taken from the OPM database (www.opm.phar.umich.edu).
Initial ligand parameterization was performed in CGenFF available with CHARMM-GUI interface58. For corrections in charge assignments with high penalty values, Cpd 1 and Cpd 2 were fragmented and re-parameterized using Gaussian03 package and Force Field Tool-Kit available with VMD v.1.9.259. CHARMM36 additive force field was used for rest of the system60. We used homogenous lipid bilayer of 164 palmitoyloleoylphosphatidylcholine (POPC) lipids. TIP3P water model used for solvation of the lipids-receptor-ligand system with 150 mM salt concentration of Na+ and Cl−.
The initial input files generated using CHARMM-GUI interface were simulated using GROMACS v5.0.4 molecular simulation package compiled to run in parallel computing architecture using multiple GPUs 61. Each simulation was performed on a cluster of 4 nodes connected via InfiniBand, where a single node had 16 Intel Xeon 2.4 GHz processors and 2 NVIDIA Tesla K20 GPUs. Simulation parameters include a 1 fs (femtosecond) time step for the first step of the equilibration, followed by a 2 fs time step for the rest of the equilibration and production simulations. During initial phase of NVT ensemble, temperature was set at 310 K using Berendsen thermostat62, and the initial harmonic restraints of 10.0 kCal /mol/Å2 applied for protein and lipid heavy atoms. These restraints were gradually reduced throughout the equilibration phase, followed by a production phase with no restraints. In the production phase of NPT ensemble, the pressure was set to 1 bar using Parrinello-Rahman barostat and 310 K temperature with Nose-Hoover thermostat. Non-bonded interaction calculations cut-off was set at 12 Å. The Particle mesh Ewald (PME) FFT grid was used with a dimension of 64×64×96 for all simulations. Bond lengths to H-atoms were constrained using P-LINCS algorithm63.
A total of 10.2 μs of production MD simulation were performed to study the interactions of Helix VIII in AT2R, including 8 runs of 0.5 μs each for crystal structure starting conformations, 8 × 0.25 μs for perturbed position of helix VIII, and 6 × 0.7 μs for AT1R-like starting conformation of helix VIII. Simulation trajectories were analyzed using GROMACS and VMD59. Plots and images were generated using Grace (http://plasma-gate.weizmann.ac.il/Grace) and ICM-Pro.
Radioligand binding assays
Radioligand binding studies were performed using mammalian virus-like particles (VLPs) containing wild-type AT1R, wild-type AT2R, or the engineered BRIL-AT2R. VLPs were produced using the Expi293 MembranePro Expression System (ThermoFisher) per the manufacturer’s instructions. Total protein concentration was determined by Bradford assay. VLPs were re-suspended in cold Dulbecco’s Phosphate-Buffered Saline (PBS) without calcium or magnesium (Gibco). Aliquots were flash-frozen and stored at −80 °C. All binding reactions were carried out in 96-well microplates (Corning). The assay buffer (50 μL) consisted of 20 mM HEPES pH 7.4, 5 mM MgCl2, 1 mM EDTA, and 0.005 % Tween-20. Non-specific binding was determined in the presence of 1 μM AngII. Final concentrations of [125I]-Sar1-Ile8-AngII (Perkin Elmer) were typically 0.05–5 nM in saturation and 0.3 nM in competition binding experiments. For both types of assays, 37.5 ng (wild-type AT1R or engineered BRIL-AT2R) or 13.5 ng (wild-type AT2R) VLPs were used per well. Competing ligands were added as DMSO solutions, resulting in a total organic solvent content of 1 %. Reactions were incubated for 3 hours at room temperature. Bound ligand was separated from free ligand by processing 25 μL of each reaction mixture on 96-well Zeba Spin desalting plates with a molecular weight cut-off of 40 kDa (ThermoScientific) according to the manufacturer’s instructions. Eluates were collected in isoplates-96 microplates by centrifugation (100 × g for 3 min) and bound ligand was quantitated after addition of 150 μL of UltimaGold MV scintillation fluid on a Perkin Elmer Wallac Microbeta TriLux 1450 scintillation counter. All reagent transfers were conducted using a Hamilton liquid handler. Data were analyzed by non-linear curve-fitting using the program GraphPad Prism 6. Binding data is reported as mean ± s.e.m.
Mutagenesis of the ligand-binding pocket residues and radioligand binding assays
Radioligand binding assays were performed as previously described25. Briefly, ligand binding was measured using washed membranes from HEK 293 cells (FreeStyle™ 293-F, ThermoFisher, cat. R79007) transiently expressing WT AT2R or point mutant AT2R constructs. Cells were lysed in buffer (25 mM HEPES, pH 7.5) with protease inhibitor cocktail consisting of AEBSF (GoldBio), E-64, Leupeptin, Aprotinin (AGScientific), and dounce homogenized. Membranes were centrifuged for 15 minutes at 30,000 × g. Total protein concentration was measured by Bradford assay, and membrane pellets were frozen in liquid nitrogen and stored at −80 °C. Binding assays were carried out in a total volume of 0.25 mL in 96-well plates with a binding buffer (140 mM NaCl, 5 mM KCl, 1mM EDTA, 25 mM HEPES, pH 7.4, 0.006% BSA) containing 1 nM [3H]AngII (American Radiolabeled Chemicals, Inc) for 60 minutes at room temperature. Membranes were harvested over 0.3% polyethyleneimine-treated, 96-well filter mats using a 96-well Filtermate harvester (Perkin Elmer) and washed 3 times with cold buffer (25 mM HEPES, pH 7.5). Filter mats were dried, wax scintillant was melted onto each filter, and radioactivity was counted in a MicroBeta2 TriLux plate scintillation counter (Perkin Elmer). AngII Kd for WT and mutants were determined using homologous competition binding. Ki was determined using [3H]AngII competition with 12 concentrations of unlabeled ligand (10,000 uM – 0.01 nM). The data were analyzed by Prism 6.05 (GraphPad Software) to give Kd and Ki values and reported as the mean ± s.e.m.
Compound preparation
All molecules presented in this manuscript were prepared according to the appropriate literature and/or patent publications: Compounds 1, 3 (ref. 26), Compounds 2, 5, 6, 10, 12, and 14 (ref. 27), Compounds 4 and 11 (ref. 64), Compounds 7–9 (ref. 65), Compound 13 (ref. 66).
Cell lines
Sf9 cells were purchased from the American Type Culture Collection. HEK 293 cells were acquired from ThermoFisher. The cell lines have not been authenticated. All cell lines have been tested and shown to be free from mycoplasma.
Data availability
Atomic coordinates and structure factors for the AT2R-Cpd 1, monoclinic and orthorhombic, and AT2R-Cpd 2 structures have been deposited into the Protein Data Bank with accession codes 5UNF, 5UNG, and 5UNH, respectively. All other data are available from the corresponding authors upon reasonable request.
Extended Data
Extended Data Figure 1. AT2R “snake” diagram and protein engineering.
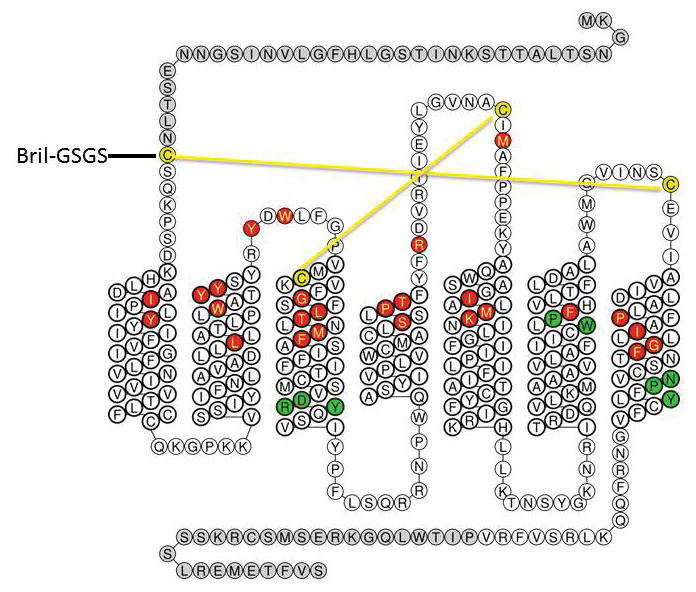
Truncations are shown in grey, disulfide bonds in yellow, ligand-binding residues in red, conserved motifs in green.
Extended Data Figure 2. Radioligand binding assays.
a, b, Saturation binding of Cpd 1 and Sar1-Ile8-AngII. Specific binding of [3H]-Cpd 1 (a) and [125I]-Sar1-Ile8-AngII (b) to the wild-type (open circle) and engineered AT2R (closed triangle), representative of two separate experiments; c–e, Competition binding of Cpd 1 (open circle), Cpd 2 (closed triangle) and AngII (open square) to the wild-type AT2R (c), engineered AT2R (d) and wild type AT1R (e) with [125I]-Sar1-Ile8-AngII as a tracer; each point represents the mean ± s.e.m. of two separate experiments, each performed in duplicates.
Extended Data Figure 3. Crystallization of AT2R and crystal packing.
a, AT2R-Cpd 1 crystals grown in a syringe for XFEL data collection. b, AT2R-Cpd 2 crystals grown in a glass sandwich plate for synchrotron data collection. c, Crystal packing in the monoclinic space group (AT2R-Cpd 1 and AT2R-Cpd 2 structures), side and top views (AT2R in green and cyan; BRIL in orange and pink). d, Crystal packing in the orthorhombic space group (AT2R-Cpd 1 structure), side and top views (AT2R in cyan; BRIL in blue). e, Different BRIL orientations in the two BRIL-AT2R molecules in the asymmetric unit of monoclinic AT2R-Cpd 1 structure and AT2R-Cpd 2 structure (pink and orange), and in the orthorhombic AT2R-Cpd 1 structure (blue) with AT2R in cyan, side and top views. Unit cell in (c) and (d) is outlined in black line.
Extended Data Figure 4. Conserved L[M]3.46 – I[A]6.37 – Y[Y]7.53 microswitch and sodium binding pocket in AT1R and AT2R.
a, Comparison of the conserved residue triad between AT1R (green, PDB 4YAY) and AT2R (cyan) structures, shows a rearrangement of interactions consistent with AT2R activation. b, Modeling of the AT2R in a hypothetical inactive state (cyan), based on the AT1R crystal structure template (green) shows that replacement of a large hydrophobic residue in position 6.37, as conserved in most class A GPCRs, to a rare small Ala2586.37 in AT2R drastically reduces the hydrophobic contact in this region between helices III and VI in the inactive state. c,d, Sodium binding pocket in AT2R (c) and AT1R (PDB 4YAY) (d) is shown as a surface with hydrogen bonds between Asn7.46 and Asn3.35 as orange spheres. Putative sodium ion in the AT1R structure (d) is shown as a solid magenta sphere, while the same position in the AT2R structure (c) is marked as a dotted sphere. Potential sodium-coordinating residues are shown as sticks.
Extended Data Figure 5. Summary of MD simulations.
a–c, Conformational stability of AT2R structure is illustrated by representative conformations from a total of 4 μs of MD simulations (eight independent 500 ns runs), clustered by RMSD. Traces of distances measured between different helices are shown for apo AT2R (a) and for the AT2R-Cpd 1 complex (b). Distances were calculated between the centers of mass of residues Ser792.39-Ile832.43 for helix II, Arg1423.50-Val1463.54 for helix III, Gln2536.32-Met2576.36 for helix VI, and Phe325-Lys328 for helix VIII. d,e, Conformational stability of helix VIII upon perturbations, using eight starting conformations of helix VIII (d) is revealed by RMSD traces (e), which all converge by ~250 ns of simulations. RMSD values are calculated for the center of mass of Cα atoms of residues Phe325-Lys328 compared to the crystal structure of AT2R. Tick marks on the Y-axis show the starting frame RMSD values. Colored lines are plotted using values averaged over a 500 ps window. f–h, Results of MD simulations for a modified AT2R model with the backbone of helix VIII aligned with helix VIII from AT1R structure (PDB 4YAY). Conformational snapshots of the AT2R model (f) are shown for every 100 ns (blue to red spectrum) from one of the six independent 700 ns MD simulation runs (simulation 5). Green cartoon shows inactive-state conformation of CCR5 (PDB 4MBS), helix VIII of which was found to be the closest to the final conformations of AT2R helix VIII in MD simulations. Intracellular view (g) of snapshots from the same MD simulation is shown only t=0 and t=700 ns. Traces of the distance between helices VI and II (e, upper curves), calculated between the centers of mass of Cα atoms of residues Gln2536.32-Met2576.36 in helix VI and residues Ser792.39-Ile832.43 in helix II, show a change from 21 Å (active state) to under 16 Å (inactive state). Traces of the distance between helix VIII and membrane (e, lower curves), calculated between the center of mass of Cα atoms of residues R330–V332 and the closest phosphate atoms of lipid molecules, indicate a gradual shift of helix VIII towards the lipid bilayer, with the distance decreasing from ~10 Å to under 3 Å.
Extended Data Figure 6. Electron density for Cpd 1 and Cpd 2.
a, b, Cpd 1 can be modeled in two possible conformations, (a) and (b), with alternative orientations of the benzene and thiophene rings. c, d, Cpd 2 can be modeled in two possible conformations, (c) and (d), with alternative orientations of the benzene and furan rings. 2mFo-DFc electron density (blue mesh) for Cpd 1 contoured at 1 σ, and mFo-DFc density (green mesh – positive, red mesh – negative) contoured at 3 σ. The conformations shown in panels (a) and (c) were used in the final crystal structures because of a slightly better ligand fit and the absence of strong difference mFo-DFc density. Both conformations for each ligand, however, are possible and indistinguishable by docking studies.
Extended Data Figure 7. Ligand binding and cross-docking in AT2R and AT1R structures.
a,b, Docking poses of Cpd 1 (magenta), Cpd 2 (yellow), olmesartan (blue) and ZD7155 (orange) in the crystal structures of AT2R (a) and AT1R (b). Receptors are shown in carton representation, ligands are shown as sticks, and hydrogen bonds/salt bridges are shown as dashed lines. c, Ligand binding affinities and docking scores for AT2R and AT1R ligands. Data for the cognate ligands are shown in bold. Inactive state AT1R and active-like state of AT2R correspond to crystal structures. Active-like state of AT1R and inactive state of AT2R were modeled based on the crystal structures of AT2R and AT1R, respectively.
Extended Data Figure 8. Mutagenesis of the AT2R ligand-binding pocket.
a, Ligand-binding pocket from the AT2R-Cpd 1 crystal structure. b, Ligand-binding pocket from the AT1R-olmesartan crystal structure. c, Schematics of interactions between Cpd 1 and AT2R residues. d, Schematics of interactions between olmesartan and AT1R residues. In all panels, residues are colored according to their effect on affinity: more than 100-fold decrease in affinity (orange); 5–100-fold decrease in affinity (yellow); less than 5-fold decrease in affinity (grey). e, Effects of single residue mutations in the AT2R ligand-binding pocket on the ligand binding affinities. Values represent mean ± s.e.m. with the number of experiments shown in parenthesis.
Extended Data Table 1.
Data collection and refinement statistics (molecular replacement).
| AT2R-Cpd 1 (XFEL) | AT2R-Cpd 2 (Synchrotron) | ||||
|---|---|---|---|---|---|
| Space group | P21 | P21221 | P21 | ||
| Unit cell parameters | |||||
| a,b,c (Å) | 77.4,69.1,90.1 | 70.3, 78.8, 93.4 | 78.4,68.2, 89.1 | ||
| α,β,γ (°) | 90.0, 104.3, 90.0 | 90.0, 90.0, 90.0 | 90.0, 104.3, 90.0 | ||
| Data collection | |||||
| Number of collected frames | 2,701,530 | 2,701,530 | N.A.. | ||
| Number of hits/indexed images | 175,241/22,774 | 175,241/15,804 | N.A.. | ||
| Number of total/unique reflections | 1,412,692/22,934 | 1,139,069/13,330 | 64,806/18,479 | ||
| Resolution (Å) | 30-2.8 (2.9-2.8)# | 30-2.8 (2.9-2.8) | 47.30-2.9 (3.06-2.90) | ||
| Completeness (%) | 100(100) | 100(100) | 91.0(83.2) | ||
| Multiplicity | 61.6(16.3) | 85.5 (27.2) | 3.5 (2.5) | ||
| llσ(l) | 4.1 (0.8) | 4.9(1.0) | 5.8(1.8) | ||
| CC* | 0.98 (0.24) | 0.99 (0.36) | 0.99 (0.84) | ||
| Rsplit Or Rmerge(%) | 16.4(172) | 14.8(124) | 12.5 (44.2) | ||
| Refinement | |||||
| Resolution (Å) | 29.57-2.80 | 28.96-2.80 | 30.00-2.90 | ||
| Number of reflections/test set | 22,906/1,118 | 13,269/691 | 18,462/906 | ||
| Rwork/Rfree | 0.227/0.256 | 0.241/0.262 | 0.216/0.259 | ||
| Number of atoms | |||||
| A | B | A | B | ||
| Receptor/BRIL | 3,103 | 3,048 | 3,195 | 2,983 | 2,800 |
| Ligand | 46 | 46 | 46 | 47 | 47 |
| Lipid and other | 0 | 0 | 25 | 0 | 0 |
| Wilson B-factors (Å2) | 90.8 | 80.9 | 79.1 | ||
| Mean overall B value (Å2) | |||||
| A | B | A | B | ||
| Receptor | 131.5 | 84.6 | 82.1 | 72.0 | 114.2 |
| BRIL | 141.7 | 107.8 | 86.1 | 106.1 | 138.6 |
| Ligand | 126.5 | 64.2 | 63.8 | 62.1 | 112.7 |
| Lipid and other | - | - | 82.6 | - | - |
| R.m.s bonds (Å)/angles (°) | 0.010/0.90 | 0.009/0.92 | 0.009/0.97 | ||
Data collected from 47 crystals were used for the AT2R-Cpd 2 structure determination.
Numbers in parentheses represent values from the highest resolution shell.
Extended Data Table 2.
SAR for quinazolinone-biphenyltetrazole derivatives in AT2R and AT1R.
|
|||||
|---|---|---|---|---|---|
|
| |||||
| Compound | R1 | R2 | AT2R Ki(nM)* | AT2R Ki(nM)* | AT2R fold selectivity |
| 1 | Ethyl |
|
0.34 ± 0.06 | 184 ± 50 | 530x |
| 2 | n-Propyl |

|
0.35 ± 0.05 | 3.72 ± 0.03 | 11x |
| 3 | Methyl |
|
1.7 ± 0.4 | 700 ± 200 | 410x |
| 4 | n-Propyl |
|
0.65 ± 0.01 | 1.8 ± 0.2 | 2.8x |
| 5 |
|

|
11.5 ± 0.5 | 37 ± 3 | 3.2x |
| 6 |

|
|
120 ± 50 | 450 ± 20 | 3.8x |
| 7 | n-Propyl |
|
1.7 ± 0.5 | 10.4 ± 1.7 | 6.1x |
| 8 | n-Propyl |
|
10.9 ± 0.1 | 9.90 ± 0.01 | 0.9x |
| 9 | n-Propyl |

|
1,790 ± 150 | 1.6 ± 0.1 | 0.001x |
| 10 | n-Propyl |
|
4.9 ± 0.2 | 12.9 ± 2.8 | 2.6x |
| 11 | n-Propyl |
|
4.1 ±0.8 | 6.7 ± 0.9 | 1.6x |
| 12 | n-Propyl |

|
18.8 ± 0.1 | 17.3 ± 4.3 | 0.9x |
| 13 | n-Propyl |

|
2,990 ± 80 | 16.7 ± 10.4 | 0.006x |
| 14 | Methyl |

|
5,300 ± 2,400 | 360 ± 80 | 0.07x |
Competition binding assay with [125I]-Sar1-Ile8-AngII as a tracer; each point represents the mean ± s.e.m. of two separate experiments, each performed in duplicates.
Supplementary Material
Acknowledgments
This work was supported by the National Institutes of Health (NIH) grants R01 GM108635 (V.C.) and U54 GM094618 (V.K., V.C., and R.C.S.); the National Science Foundation (NSF) grant 1231306 (U.W. and W.L.); the Helmholtz Association through project oriented funds (T.A.W. and A.T.). A.T. acknowledges financial support from “X-probe” funded by the European Union’s 2020 Research and Innovation Program under the Marie Skłodowska-Curie grant agreement 637295. Parts of this research were carried out at the Coherent X-ray Imaging (CXI) end station of the Linac Coherent Light Source (LCLS), SLAC National Accelerator Laboratory, operated by Stanford University on behalf of the U.S. Department of Energy, Office of Basic Energy Sciences, and at the GM/CA CAT and IMCA-CAT of the Advanced Photon Source, Argonne National Laboratory. Computational part of the study was supported by the University of Southern California Center for High-Performance Computing and Communications (hpcc.usc.edu). We thank J. Velasquez for help with molecular biology, M. Chu for help with baculovirus expression, M. Hanson for help with crystallographic data processing and A. Walker for assistance with manuscript preparation.
Footnotes
Supplementary Information is linked to the online version of the paper at www.nature.com/nature.
Author Contributions K.H., S.M.S., R.C.S., V.K., V.C. conceived and managed the project. H.Z. designed, optimized, purified, and characterized receptor constructs for structural studies, crystallized the receptor in LCP. H.Z., A.I. collected and processed synchrotron data. H.Z., A.B., A.I., M.S.H., U.W., W.L., V.C. collected XFEL data. A.B., A.T., T.A.W. processed XFEL data. G.W.H., H.Z., A.B. solved and refined the structures. M.T.R., K.H., K.B., E.L.M., S.M.S., and S.S. interpreted the structure and designed experiments. R.D.K. and J.M.S. prepared VLPs for binding studies. P.S. and B.Z. designed the binding experiments. B.Z. carried out radioligand binding assays with VLPs. H.Z., B.Z., M.G.-C., A.S., N.P. and P.S. analyzed the data and compiled the figures for the manuscript. N.P., A.S.,V.K. performed docking and MD simulations. K.L.W. performed radioligand binding experiments with receptor mutants. M.T.R., K.H., and K.B. selected compounds for SAR study and interpreted the data. H.Z., V.K. and V.C. wrote the manuscript with contributions from M.T.R. and K.H.
B.Z., M.T.R., K.H., K.B., E.L.M., S.M.S., R.D.K., J.M.S., S.S., M.G.-C., and P.S. are employees of Merck & Co., Inc., Kenilworth, NJ, USA, receive salary and research support from the company and may own stock and/or stock options in the company. Other authors declare no competing financial interests. Readers are welcome to comment on the online version of this paper.
References
- 1.Karnik SS, et al. International Union of Basic and Clinical Pharmacology. XCIX Angiotensin Receptors: Interpreters of Pathophysiological Angiotensinergic Stimuli. Pharmacol Rev. 2015;67:754–819. doi: 10.1124/pr.114.010454. [DOI] [PMC free article] [PubMed] [Google Scholar]
- 2.de Gasparo M, Catt KJ, Inagami T, Wright JW, Unger T International union of pharmacology. XXIII The angiotensin II receptors. Pharmacol Rev. 2000;52:415–472. [PubMed] [Google Scholar]
- 3.Zaman MA, Oparil S, Calhoun DA. Drugs targeting the renin-angiotensin-aldosterone system. Nat Rev Drug Discov. 2002;1:621–636. doi: 10.1038/nrd873. [DOI] [PubMed] [Google Scholar]
- 4.Porrello ER, Delbridge LM, Thomas WG. The angiotensin II type 2 (AT2) receptor: an enigmatic seven transmembrane receptor. Front Biosci. 2009;14:958–972. doi: 10.2741/3289. [DOI] [PubMed] [Google Scholar]
- 5.Guimond MO, Gallo-Payet N. How does angiotensin AT(2) receptor activation help neuronal differentiation and improve neuronal pathological situations? Front Endocrinol. 2012;3:164. doi: 10.3389/fendo.2012.00164. [DOI] [PMC free article] [PubMed] [Google Scholar]
- 6.Berk BC. Angiotensin type 2 receptor (AT2R): a challenging twin. Sci STKE. 2003;181:pe16. doi: 10.1126/stke.2003.181.pe16. [DOI] [PubMed] [Google Scholar]
- 7.Miura S, Matsuo Y, Kiya Y, Karnik SS, Saku K. Molecular mechanisms of the antagonistic action between AT1 and AT2 receptors. Biochem Biophys Res Commun. 2010;391:85–90. doi: 10.1016/j.bbrc.2009.11.008. [DOI] [PMC free article] [PubMed] [Google Scholar]
- 8.Hein L, Barsh GS, Pratt RE, Dzau VJ, Kobilka BK. Behavioural and cardiovascular effects of disrupting the angiotensin II type-2 receptor in mice. Nature. 1995;377:744–747. doi: 10.1038/377744a0. [DOI] [PubMed] [Google Scholar]
- 9.Ichiki T, et al. Effects on blood pressure and exploratory behaviour of mice lacking angiotensin II type-2 receptor. Nature. 1995;377:748–750. doi: 10.1038/377748a0. [DOI] [PubMed] [Google Scholar]
- 10.Porrello ER, et al. Angiotensin II type 2 receptor antagonizes angiotensin II type 1 receptor-mediated cardiomyocyte autophagy. Hypertension. 2009;53:1032–1040. doi: 10.1161/HYPERTENSIONAHA.108.128488. [DOI] [PubMed] [Google Scholar]
- 11.Ruiz-Ortega M, et al. Angiotensin II activates nuclear transcription factor kappaB through AT(1) and AT(2) in vascular smooth muscle cells: molecular mechanisms. Circ Res. 2000;86:1266–1272. doi: 10.1161/01.res.86.12.1266. [DOI] [PubMed] [Google Scholar]
- 12.Ruiz-Ortega M, Lorenzo O, Ruperez M, Blanco J, Egido J. Systemic infusion of angiotensin II into normal rats activates nuclear factor-kappaB and AP-1 in the kidney: role of AT(1) and AT(2) receptors. Am J Pathol. 2001;158:1743–1756. doi: 10.1016/s0002-9440(10)64130-2. [DOI] [PMC free article] [PubMed] [Google Scholar]
- 13.Caballero R, et al. Interaction of angiotensin II with the angiotensin type 2 receptor inhibits the cardiac transient outward potassium current. Cardiovasc Res. 2004;62:86–95. doi: 10.1016/j.cardiores.2003.12.029. [DOI] [PubMed] [Google Scholar]
- 14.Zhao Y, et al. Angiotensin II induces peroxisome proliferator-activated receptor gamma in PC12W cells via angiotensin type 2 receptor activation. J Neurochem. 2005;94:1395–1401. doi: 10.1111/j.1471-4159.2005.03275.x. [DOI] [PubMed] [Google Scholar]
- 15.Guimond MO, Gallo-Payet N. The Angiotensin II Type 2 Receptor in Brain Functions: An Update. Int J Hypertens. 2012;2012:351758. doi: 10.1155/2012/351758. [DOI] [PMC free article] [PubMed] [Google Scholar]
- 16.Anand U, et al. Angiotensin II type 2 receptor (AT2 R) localization and antagonist-mediated inhibition of capsaicin responses and neurite outgrowth in human and rat sensory neurons. Eur J Pain. 2013;17:1012–1026. doi: 10.1002/j.1532-2149.2012.00269.x. [DOI] [PMC free article] [PubMed] [Google Scholar]
- 17.Smith MT, Woodruff TM, Wyse BD, Muralidharan A, Walther T. A small molecule angiotensin II type 2 receptor (AT(2)R) antagonist produces analgesia in a rat model of neuropathic pain by inhibition of p38 mitogen-activated protein kinase (MAPK) and p44/p42 MAPK activation in the dorsal root ganglia. Pain Med. 2013;14:1557–1568. doi: 10.1111/pme.12157. [DOI] [PubMed] [Google Scholar]
- 18.Smith MT, Wyse BD, Edwards SR. Small molecule angiotensin II type 2 receptor (AT(2)R) antagonists as novel analgesics for neuropathic pain: comparative pharmacokinetics, radioligand binding, and efficacy in rats. Pain Med. 2013;14:692–705. doi: 10.1111/pme.12063. [DOI] [PubMed] [Google Scholar]
- 19.Smith MT, Lau T, Wallace VC, Wyse BD, Rice AS. Analgesic efficacy of small-molecule angiotensin II type 2 receptor antagonists in a rat model of antiretroviral toxic polyneuropathy. Behav Pharmacol. 2014;25:137–146. doi: 10.1097/FBP.0000000000000025. [DOI] [PubMed] [Google Scholar]
- 20.Rice AS, et al. EMA401, an orally administered highly selective angiotensin II type 2 receptor antagonist, as a novel treatment for postherpetic neuralgia: a randomised, double-blind, placebo-controlled phase 2 clinical trial. Lancet. 2014;383:1637–1647. doi: 10.1016/S0140-6736(13)62337-5. [DOI] [PubMed] [Google Scholar]
- 21.Wan Y, et al. Design, synthesis, and biological evaluation of the first selective nonpeptide AT2 receptor agonist. J Med Chem. 2004;47:5995–6008. doi: 10.1021/jm049715t. [DOI] [PubMed] [Google Scholar]
- 22.Kemp BA, et al. AT(2) receptor activation induces natriuresis and lowers blood pressure. Circ Res. 2014;115:388–399. doi: 10.1161/CIRCRESAHA.115.304110. [DOI] [PMC free article] [PubMed] [Google Scholar]
- 23.Larhed M, Hallberg M, Hallberg A. Nonpeptide AT2 Receptor Agonists. 2006;51:69–82. [Google Scholar]
- 24.Zhang H, et al. Structure of the Angiotensin receptor revealed by serial femtosecond crystallography. Cell. 2015;161:833–844. doi: 10.1016/j.cell.2015.04.011. [DOI] [PMC free article] [PubMed] [Google Scholar]
- 25.Zhang H, et al. Structural Basis for Ligand Recognition and Functional Selectivity at Angiotensin Receptor. J Biol Chem. 2015;290:29127–29139. doi: 10.1074/jbc.M115.689000. [DOI] [PMC free article] [PubMed] [Google Scholar]
- 26.Glinka TW, et al. L-161,638: A potent AT2 selective quinazolinone angiotensin II binding inhibitor. Bioorg Med Chem Lett. 1994;4:1479–1484. [Google Scholar]
- 27.de Laszlo S, Glinka T, Greenlee W, Chakravarty P, Patchett A. Disubstituted 6-aminoquinazolinones. 5,385,894. US Patent. 1995
- 28.Dosa PI, Amin EA. Tactical Approaches to Interconverting GPCR Agonists and Antagonists. J Med Chem. 2016;59:810–840. doi: 10.1021/acs.jmedchem.5b00982. [DOI] [PubMed] [Google Scholar]
- 29.Murugaiah AM, et al. From the first selective non-peptide AT(2) receptor agonist to structurally related antagonists. J Med Chem. 2012;55:2265–2278. doi: 10.1021/jm2015099. [DOI] [PubMed] [Google Scholar]
- 30.Chun E, et al. Fusion partner toolchest for the stabilization and crystallization of G protein-coupled receptors. Structure. 2012;20:967–976. doi: 10.1016/j.str.2012.04.010. [DOI] [PMC free article] [PubMed] [Google Scholar]
- 31.Caffrey M, Cherezov V. Crystallizing membrane proteins using lipidic mesophases. Nat Protoc. 2009;4:706–731. doi: 10.1038/nprot.2009.31. [DOI] [PMC free article] [PubMed] [Google Scholar]
- 32.Liu W, et al. Serial femtosecond crystallography of G protein-coupled receptors. Science. 2013;342:1521–1524. doi: 10.1126/science.1244142. [DOI] [PMC free article] [PubMed] [Google Scholar]
- 33.Liu W, Ishchenko A, Cherezov V. Preparation of microcrystals in lipidic cubic phase for serial femtosecond crystallography. Nat Protoc. 2014;9:2123–2134. doi: 10.1038/nprot.2014.141. [DOI] [PMC free article] [PubMed] [Google Scholar]
- 34.Weierstall U, et al. Lipidic cubic phase injector facilitates membrane protein serial femtosecond crystallography. Nat Commun. 2014;5:3309. doi: 10.1038/ncomms4309. [DOI] [PMC free article] [PubMed] [Google Scholar]
- 35.Ballesteros JA, Weinstein H. In: Methods in Neurosciences. Stuart C Sealfon., editor. Vol. 25. Academic Press; 1995. pp. 366–428. [Google Scholar]
- 36.Katritch V, Cherezov V, Stevens RC. Structure-function of the G protein-coupled receptor superfamily. Annu Rev Pharmacol Toxicol. 2013;53:531–556. doi: 10.1146/annurev-pharmtox-032112-135923. [DOI] [PMC free article] [PubMed] [Google Scholar]
- 37.Venkatakrishnan AJ, et al. Diverse activation pathways in class A GPCRs converge near the G-protein-coupling region. Nature. 2016;536:484–487. doi: 10.1038/nature19107. [DOI] [PMC free article] [PubMed] [Google Scholar]
- 38.Rasmussen SG, et al. Crystal structure of the beta2 adrenergic receptor-Gs protein complex. Nature. 2011;477:549–555. doi: 10.1038/nature10361. [DOI] [PMC free article] [PubMed] [Google Scholar]
- 39.Wacker D, et al. Structural features for functional selectivity at serotonin receptors. Science. 2013;340:615–619. doi: 10.1126/science.1232808. [DOI] [PMC free article] [PubMed] [Google Scholar]
- 40.Katritch V, et al. Analysis of full and partial agonists binding to beta2-adrenergic receptor suggests a role of transmembrane helix V in agonist-specific conformational changes. J Mol Recognit. 2009;22:307–318. doi: 10.1002/jmr.949. [DOI] [PMC free article] [PubMed] [Google Scholar]
- 41.Kang Y, et al. Crystal structure of rhodopsin bound to arrestin by femtosecond X-ray laser. Nature. 2015;523:561–567. doi: 10.1038/nature14656. [DOI] [PMC free article] [PubMed] [Google Scholar]
- 42.Katritch V, et al. Allosteric sodium in class A GPCR signaling. Trends Biochem Sci. 2014;39:233–244. doi: 10.1016/j.tibs.2014.03.002. [DOI] [PMC free article] [PubMed] [Google Scholar]
- 43.Balakumar P, Jagadeesh G. Structural determinants for binding, activation and functional selectivity of the AT1 receptor. J Mol Endocrinol. 2014;53:R71–92. doi: 10.1530/JME-14-0125. [DOI] [PubMed] [Google Scholar]
- 44.Unal H, Karnik SS. Constitutive activity in the angiotensin II type 1 receptor: discovery and applications. Adv Pharmacol. 2014;70:155–174. doi: 10.1016/B978-0-12-417197-8.00006-7. [DOI] [PMC free article] [PubMed] [Google Scholar]
- 45.Miura S, Karnik SS. Angiotensin II type 1 and type 2 receptors bind angiotensin II through different types of epitope recognition. J Hypertens. 1999;17:397–404. doi: 10.1097/00004872-199917030-00013. [DOI] [PubMed] [Google Scholar]
- 46.Miura S, Karnik SS. Ligand-independent signals from angiotensin II type 2 receptor induce apoptosis. EMBO J. 2000;19:4026–4035. doi: 10.1093/emboj/19.15.4026. [DOI] [PMC free article] [PubMed] [Google Scholar]
- 47.Akazawa H, Yano M, Yabumoto C, Kudo-Sakamoto Y, Komuro I. Angiotensin II type 1 and type 2 receptor-induced cell signaling. Curr Pharm Des. 2013;19:2988–2995. doi: 10.2174/1381612811319170003. [DOI] [PubMed] [Google Scholar]
- 48.Hein L, Meinel L, Pratt RE, Dzau VJ, Kobilka BK. Intracellular trafficking of angiotensin II and its AT1 and AT2 receptors: evidence for selective sorting of receptor and ligand. Mol Endocrinol. 1997;11:1266–1277. doi: 10.1210/mend.11.9.9975. [DOI] [PubMed] [Google Scholar]
- 49.Widdop RE, Matrougui K, Levy BI, Henrion D. AT2 receptor-mediated relaxation is preserved after long-term AT1 receptor blockade. Hypertension. 2002;40:516–520. doi: 10.1161/01.hyp.0000033224.99806.8a. [DOI] [PubMed] [Google Scholar]
- 50.Kabsch W. XDS. Acta crystallogr D Biol Crystallogr. 2010;66:125–132. doi: 10.1107/S0907444909047337. [DOI] [PMC free article] [PubMed] [Google Scholar]
- 51.White TA, et al. Recent developments in CrystFEL. J Appl Crystallogr. 2016;49:680–689. doi: 10.1107/S1600576716004751. [DOI] [PMC free article] [PubMed] [Google Scholar]
- 52.McCoy AJ, et al. Phaser crystallographic software. J Appl Crystallogr. 2007;40:658–674. doi: 10.1107/S0021889807021206. [DOI] [PMC free article] [PubMed] [Google Scholar]
- 53.Emsley P, Lohkamp B, Scott WG, Cowtan K. Features and development of Coot. Acta crystallogr D Biol Crystallogr. 2010;66:486–501. doi: 10.1107/S0907444910007493. [DOI] [PMC free article] [PubMed] [Google Scholar]
- 54.Bhat TN. Calculation of an Omit Map. J Appl Crystallogr. 1988;21:279–281. [Google Scholar]
- 55.Chen VB, et al. MolProbity: all-atom structure validation for macromolecular crystallography. Acta Crystallogr D Biol Crystallogr. 2010;66:12–21. doi: 10.1107/S0907444909042073. [DOI] [PMC free article] [PubMed] [Google Scholar]
- 56.Halgren TA. Potential energy functions. Curr Opin Struct Biol. 1995;5:205–210. doi: 10.1016/0959-440x(95)80077-8. [DOI] [PubMed] [Google Scholar]
- 57.Totrov M, Abagyan R. Flexible protein-ligand docking by global energy optimization in internal coordinates. Proteins Suppl. 1997;1:215–220. doi: 10.1002/(sici)1097-0134(1997)1+<215::aid-prot29>3.3.co;2-i. [DOI] [PubMed] [Google Scholar]
- 58.Lee J, et al. CHARMM-GUI Input Generator for NAMD, GROMACS, AMBER, OpenMM, and CHARMM/OpenMM Simulations Using the CHARMM36 Additive Force Field. J Chem Theory Comput. 2016;12:405–413. doi: 10.1021/acs.jctc.5b00935. [DOI] [PMC free article] [PubMed] [Google Scholar]
- 59.Humphrey W, Dalke A, Schulten K. VMD: visual molecular dynamics. J Mol Graph. 1996;14:33–38. 27–38. doi: 10.1016/0263-7855(96)00018-5. [DOI] [PubMed] [Google Scholar]
- 60.Best RB, et al. Optimization of the additive CHARMM all-atom protein force field targeting improved sampling of the backbone φ, ψ and side-chain χ(1) and χ(2) dihedral angles. J Chem Theory Comput. 2012:8. doi: 10.1021/ct300400x. [DOI] [PMC free article] [PubMed] [Google Scholar]
- 61.Abraham MJ, et al. GROMACS: High performance molecular simulations through multi-level parallelism from laptops to supercomputers. SoftwareX. 2015;1–2:19–25. [Google Scholar]
- 62.Berendsen HJC, Postma JPM, van Gunsteren WF, DiNola A, Haak JR. Molecular dynamics with coupling to an external bath. J Chem Phys. 1984;81:3684–3690. [Google Scholar]
- 63.Hess B. P-LINCS: A Parallel Linear Constraint Solver for Molecular Simulation. J Chem Theory Comput. 2008;4:116–122. doi: 10.1021/ct700200b. [DOI] [PubMed] [Google Scholar]
- 64.de Laszlo SE, et al. The SAR of 6-(N-alkyl-N-acyl)-2-propyl-3-[(2′-tetrazol-5-yl)biphen-4-yl)methyl]-quinazolinones as balanced affinity antagonists of the human AT1 and AT2 receptors. Bioorg Med Chem Lett. 1995;5:1359–1364. [Google Scholar]
- 65.de Laszlo SE, et al. The design, binding affinity prediction and synthesis of macrocyclic angiotensin II AT1 and AT2 receptor antagonists. Bioorg Med Chem Lett. 1996;6:923–928. [Google Scholar]
- 66.Beauchamp HT, Chang RS, Siegl PK, Gibson RE. In vivo receptor occupancy of the angiotensin II receptor by nonpeptide antagonists: relationship to in vitro affinities and in vivo pharmacologic potency. J Pharmacol Exp Ther. 1995;272:612–618. [PubMed] [Google Scholar]
Associated Data
This section collects any data citations, data availability statements, or supplementary materials included in this article.
Supplementary Materials
Data Availability Statement
Atomic coordinates and structure factors for the AT2R-Cpd 1, monoclinic and orthorhombic, and AT2R-Cpd 2 structures have been deposited into the Protein Data Bank with accession codes 5UNF, 5UNG, and 5UNH, respectively. All other data are available from the corresponding authors upon reasonable request.


