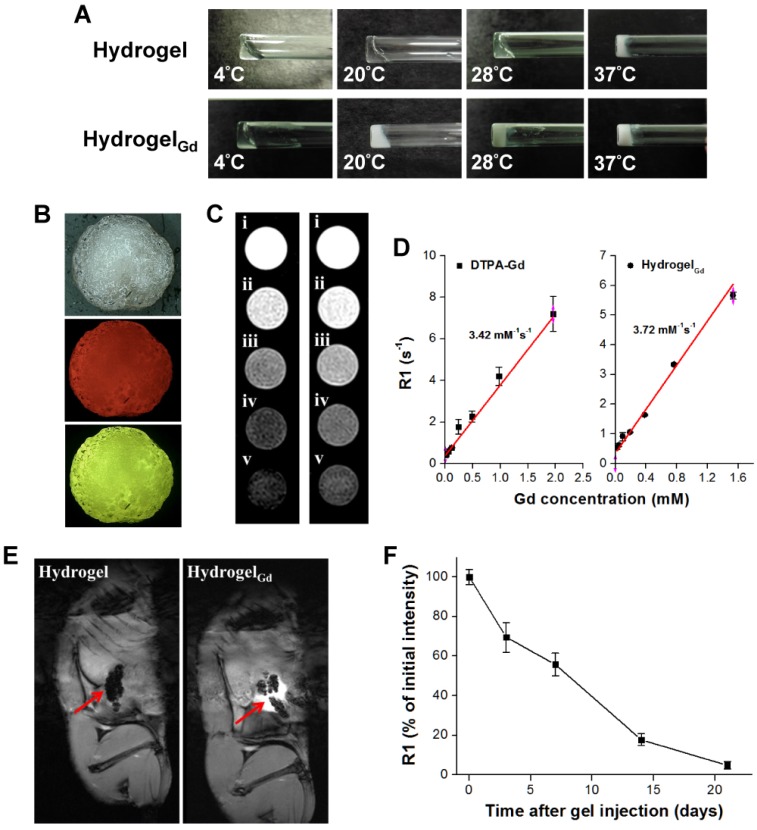
Figure 2.
(A) Morphology of hydrogel and hydrogelGd (20 wt%) incubated at different temperatures. (B) Pictures of BSA/PTX NPs incorporated hydrogelGd/EPI formation. Red fluorescence: EPI; green fluorescence: FITC-labeled BSA NPs. (C) MR T1 phantom imaging of (left) commercial DTPA-Gd (i: 1.96 mM; ii: 0.98 mM; iii: 0.48 mM; iv: 0.24 mM; v: 0.12 mM) and (right) hydrogelGd (i: 1.56 mM; ii: 0.78 mM; iii: 0.40 mM; iv: 0.20 mM; v: 0.10 mM). (D) MR T1 relaxivities of (left) DTPA-Gd and (right) hydrogelGd (mM-1s-1) are indicated by the slope. (E) Typical MR contrast-enhanced T1 images of (left) hydrogel and (right) hydrogelGd implanted in tumor-bearing mice. (F) The reduction of MR T1 intensity of BSA NPs-incorporated hydrogelGd in tumor site. Values are means ± SD (n = 3).

