

Abstract
Demographic data on wild chimpanzees are crucial for understanding the evolution of chimpanzee and hominin life histories, but most data come from populations affected by disease outbreaks and anthropogenic disturbance. We present survivorship data from a relatively undisturbed and exceptionally large community of eastern chimpanzees (Pan troglodytes schweinfurthii) at Ngogo, Kibale National Park, Uganda. We monitored births, deaths, immigrations, and emigrations in the community between 1995 and 2016. Using known and estimated ages, we calculated survivorship curves for the whole community, for males and females separately, and for individuals ≤2 years old when identified. We used a novel method to address age estimation error by calculating stochastic survivorship curves. We compared Ngogo life expectancy, survivorship, and mortality rates to those from other chimpanzee communities and human hunter-gatherers. Life expectancy at birth for both sexes combined was 32.8 years, far exceeding estimates of chimpanzee life expectancy in other communities, and falling within the range of human hunter-gatherers (i.e., 27–37 years). Overall, the pattern of survivorship at Ngogo was more similar to that of human hunter-gatherers than to other chimpanzee communities. Maximum lifespan for the Ngogo chimpanzees, however, was similar to that reported at other chimpanzee research sites and was less than that of human-hunter gatherers. The absence of predation by large carnivores may contribute to some of the higher survivorship at Ngogo, but this cannot explain the much higher survivorship at Ngogo than at Kanyawara, another chimpanzee community in the same forest, which also lacks large carnivores. Higher survivorship at Ngogo appears to be an adaptive response to a food supply that is more abundant and varies less than that of Kanyawara. Future analyses of hominin life history evolution should take these results into account.
Keywords: Chimpanzees, Demography, Mortality, Hunter-gatherers, Ngogo, Life-expectancy
1. Introduction
Chimpanzees (Pan troglodytes) and bonobos (Pan paniscus) are the closest living relatives of humans, which makes data on their life histories and demography invaluable for comparative analysis of human life history evolution and for reconstructing life history parameters of extinct hominin taxa (Hill et al., 2001; Emery Thompson et al., 2007; Kachel and Premo, 2012; Lee, 2012; Schwartz, 2012; Duda and Zrzavý, 2013; Smith, 2013; van Noordwijk et al., 2013; Muller and Wrangham, 2014; Chan et al., 2016). Relative to other mammals of similar body size, chimpanzees grow slowly, start to reproduce late, and live long: chimpanzee infants are weaned around five years of age; females give birth for the first time when they are about 14 years old; interbirth intervals are typically 5–6 years (Boesch and Boesch-Achermann, 2000; Nishida et al., 2003; Emery Thompson et al., 2007; Stumpf, 2007). While the longest precisely measured lifespan among captive chimpanzees is 62 years, one female alive today is estimated to be 78 years old (Ross, 2015). Maximum longevity in the wild is estimated to be well over 60 years (Emery Thompson et al., 2007). These growth, development, and longevity parameters are expected because chimpanzees are large-bodied, have relatively large brains, and are highly frugivorous (Ross, 1998; Mumby and Vinicius, 2008; van Schaik and Isler, 2012). However, it is hard to obtain large samples of chimpanzee demographic and life history data. This paucity of information creates difficulties when making comparisons with humans.
Published data on chimpanzee demography and life histories reveal similarities and differences with human hunter-gatherer societies. Curves that plot the relationship between female fertility and age in chimpanzees, calculated from several wild populations, have an inverted u-shape similar to that documented for several human hunter-gatherer populations. Because of shorter interbirth intervals, female reproductive rates are higher in humans despite later ages at first reproduction (Kaplan et al., 2000). Delayed onset of reproduction and short interbirth intervals are associated with our species’ reliance on skill-intensive foraging, extensive food sharing, allocaretaking, and the evolution of childhood (Bogin, 1997; Kaplan et al., 2000; Hill and Hurtado, 2009; Kramer, 2010; Hrdy, 2011; van Noordwijk et al., 2013). Also in contrast to humans, reproductive senescence in female chimpanzees is not decoupled from somatic senescence. Available data from long-term chimpanzee research sites indicate that few female chimpanzees survive long enough to become post-reproductive, and post-reproductive life expectancy is short (Emery Thompson et al., 2007; Alberts et al., 2013). Analysis of pooled data from five chimpanzee research sites (Bossou, Republic of Guinea; Gombe, Tanzania; Kanyawara, Uganda; Mahale, Tanzania; Taï, Ivory Coast) has shown much higher juvenile and adult mortality and much lower life expectancy at birth and at maturity in chimpanzees than in hunter-gatherers (Hill et al., 2001). An additional composite survivorship curve based on data from all of these sites except Taï plus data from Budongo (Emery Thompson et al., 2007) yielded somewhat lower estimates of mortality, but still showed a steep, steady decline in survival with age, with only about 40% of females surviving to the age of peak fertility and 20% surviving to age 40.
Hill et al. (2001) themselves questioned whether their analysis accurately represented chimpanzee demography, given that their results described a declining population, something that cannot hold over evolutionary time. As both they and Muller and Wrangham (2014) pointed out, chimpanzee populations across Africa are declining due to habitat loss, hunting, and disease; perhaps the intensity of these factors in the 20th and 21st century have systematically increased measured chimpanzee mortality rates. Zoonotic and anthroponotic diseases have had particularly large impacts at Taï (Boesch and Boesch-Achermann, 2000; Leendertz et al., 2004; Köndgen et al., 2008), and serious epidemics have occurred at Mahale (Nishida et al., 2003) and Gombe (Pusey et al., 2007, 2008; Williams et al., 2008; Lonsdorf et al., 2011). Pathogenicity associated with SIVcpz infection is known at Gombe (Keele et al., 2009) and researchers at Mahale reported multiple fatalities associated with an “AIDS-like syndrome” (Nishida et al., 2003). Hunting has also had a serious impact at Taï (Boesch et al., 2008), and snare injuries are common at Budongo (Reynolds, 2005) and Kanyawara (Wrangham and Mugume, 2000), even though little or no deliberate targeting of chimpanzees by hunters has occurred during the history of research at those sites. Bossou has only a single, small, isolated chimpanzee community heavily subjected to anthropogenic influence (Hockings et al., 2012).
Muller and Wrangham (2014) recently constructed a life table using updated data on the Kanyawara chimpanzee community, which has escaped the worst impacts of human contact and experienced moderate population growth. They contrasted this with a life table assembled from the original Hill et al. (2001) sample with the Kanyawara data removed (the “four-site sample”) and one for the Hadza, a contemporary human foraging society (Blurton Jones, 2016). Yearly mortality rates and life expectancy at Kanyawara mostly lay between the four-site sample and the Hadza. For example, infant mortality in year 1 was 11% at Kanyawara versus 21% in the four-site sample, and life expectancy at birth was almost 20 years at Kanyawara versus 13 years in the four-site sample. Mortality risk was significantly higher in the four-site sample for the 0–14 and 15–30 year intervals. The risk of death in the first two years was actually greater for Hadza infants than for chimpanzees at Kanyawara. The Kanyawara survivorship curve leveled off in the 15–30 year interval in a manner similar to the Hadza and unlike the continued steep decline in survivorship in the four-site sample. However, it still diverged markedly from that for the Hadza after 30 years of age, with survival dropping sharply at 30 years for the chimpanzees but remaining relatively flat for another 10 years for the Hadza. Only 18% of Kanyawara chimpanzees reached age 30, and those who did had a life expectancy of only 12 more years. In contrast, 42% of all Hadza lived until 30; those who did survived another 32 years on average.
Muller and Wrangham (2014) were cautious about the importance of the apparent plateau in Kanyawara chimpanzee survivor-ship between 15 and 30 years, noting that their sample was small and that the 95% confidence intervals around their survival estimates were large. But they pointed out that the Kanyawara chimpanzees had not experienced serious epidemics and argued that overall, “the data suggest an important downward revision in adult mortality rates in wild chimpanzees”, although they “do not appear to challenge the existence of a substantial difference in adult mortality between humans and chimpanzees” (Muller and Wrangham, 2014: 113).
Kanyawara is in Kibale National Park, Uganda, and in reaching these conclusions, Muller and Wrangham (2014) noted that preliminary analysis of demographic data from Ngogo, a second site in Kibale, indicated that survival was also relatively high there (Watts, 2012). These two chimpanzee communities belong to the same population, but their territories are not adjacent and they have had different recent histories of disturbance by humans (Struhsaker, 1997). Moreover, forest composition at the two sites differs in ways that substantially affect chimpanzee diets and help to explain why the Ngogo community is much larger than that at Kanyawara (Potts et al., 2011; Watts et al., 2012a). Chimpanzees are ecologically flexible and their historical range included a wide variety of habitat types, from closed-canopy lowland and mid-altitude rainforest to montane forest, open woodland, and savanna-woodland-gallery forest mosaics (reviewed in Watts et al., 2012b). Population density estimates vary correspondingly, from as low as one individual per 10 km2 in relatively dry, open habitats (e.g., Fongoli: Pruetz et al., 2002) to about five individuals per 1 km2 in evergreen for ests (e.g., Ngogo; below). Ecological variation leads to life history variation in some nonhuman primates (e.g., Hanuman langurs, Semnopithecus entellus: Koenig and Borries, 2001). Data on two communities in the same population that experience strong contrasts in ecology offer opportunities to investigate whether such variation occurs in chimpanzees and add to the sample with which to compare human and chimpanzee life histories.
Here, we provide the first formal analysis of demographic data from the Ngogo chimpanzee community. We focus on survivorship and construct life tables, calculate life expectancy, and compute survivorship curves for the community as a whole and for males and females separately. We compare these data to those from other chimpanzee research sites (Table 1), particularly Kanyawara, and four recent human foraging societies, including the Hadza (Blurton Jones, 2016), the Hiwi (Hill et al., 2007), the Aché (Hill and Hurtado, 1996) and the Dobe !Kung (Howell, 2010). Our results corroborate Muller and Wrangham’s (2014) argument that life expectancy in wild chimpanzees has been underestimated, but also suggest that the underestimation is greater than they proposed. Our findings point to ecological variation as a potential source of variation in chimpanzee life history parameters and highlight the importance of obtaining demographic data on healthy chimpanzee populations in minimally-disturbed areas for modeling hominin life history evolution.
Table 1.
Comparative measures of mortality and life expectancy in wild chimpanzee communities.a
| Site | e0 Male | e0 Female | e0 All | q0 Male | q0 Female | q0 All | l45 Male | l45 Female | l45 All | Maximum age |
|---|---|---|---|---|---|---|---|---|---|---|
| Ngogo | 30 | 36 | 33 | 0.12 | 0.17 | 0.15 | 0.20 | 0.51 | 0.35 | 66 |
| Kanyawara | 17 | 22 | 20 | 0.11 | 0.11 | 0.11 | 0.14 | 0.10 | 0.12 | 64 |
| Gombe | 15 | 20 | 18 | 0.17 | 0.19 | 0.18 | 0.00 | 0.03 | 0.03 | 55 |
| Taï | 8 | 7 | 13 | 0.12 | 0.11 | 0.08 | 0.01 | 0.00 | 0.04 | 46 |
Measures defined in the text. All life table measures (qx, lx, ex) were calculated using the methods of Hill et al. (2001) and Muller and Wrangham (2014).
2. Methods
2.1. Study site and study animals
The Kibale National Park is in southwestern Uganda between 0°13′–0° 41′ N and 30° 19′–30° 32′ E. The 795 km2 park follows north-south gradients of decreasing altitude and rainfall and is mostly covered by moist evergreen or semi-deciduous forest, transitional between lowland and montane forest (Struhsaker, 1997). The Ngogo study area, in the center of the Park, lies between 1400 and 1470 m in altitude and receives about 1500 mm of annual rainfall, mostly during March–May and September–December (Lwanga, 2003). The vegetation is typically dry-ground forest that includes large tracts of old growth forest and early- to mid-stage colonizing forest regenerating from anthropogenic grassland (Lwanga, 2003). Grasslands still cover some of the study area, which also includes swamp forest, bush dominated by Acanthus pubescens, and a papyrus (Cyperus papyrus) swamp (Lwanga et al., 2000). The chimpanzees predominately use old-growth forest, stay entirely within the park, and are surrounded on all sides by neighboring communities of chimpanzees rather than by humans. Consequently, they do not consume crops, but instead rely entirely on wild foods. During this study, no known major disease outbreaks have affected the chimpanzees.
Several differences between the Ngogo and Kanyawara study sites create important consequences for chimpanzee feeding ecology, which in turn may influence their life histories. First, the Ngogo forest has not been commercially logged. Consequently, old growth forest is relatively abundant at Ngogo and dense stands of terrestrial herbaceous vegetation, which contributes much of the chimpanzee diet at Kanyawara but little at Ngogo (Emery Thompson and Wrangham, 2008; Potts et al., 2011; Watts et al., 2012a), are less extensive there (Struhsaker, 1997; Lwanga et al., 2000; Lwanga, 2003). Second, fruit makes up most of the diet at both sites, but periods of fruit scarcity are less frequent and shorter on average at Ngogo than at Kanyawara (Watts et al., 2012b). Third, several tree species important in the diet at Ngogo (e.g., Ficus mucuso; Pterygota mildbraedii; Chrysophyllum albidum) are rare or absent at Kanyawara (Potts et al., 2009, 2011; Watts et al., 2012a). The high abundance of F. mucuso is particularly important, because individual stems of this species can produce enormous fig crops on a relatively non-seasonal basis, with the result that it serves as an important staple food (Watts et al., 2012b). Consequently, chimpanzees maintain higher energy intake rates at Ngogo (Potts et al., 2011).
Chimpanzees were first studied at Ngogo by Michael Ghiglieri in the late 1970s and early 1980s (Ghiglieri, 1984). They were not well habituated and the size and composition of the community was uncertain. Habituation efforts resumed in the early 1990s. The chimpanzees have been observed continuously since June 1995 and have been well habituated for most of this time. The Ngogo chimpanzee community is the largest documented thus far (Langergraber et al., 2009; Watts et al., 2012a), and has grown considerably since 1995 as a result of female immigration, non-dispersal of natal females, and high survivorship (below); we will present detailed data on this increase in a future publication.
2.2. Sample composition and methods of age estimation
Chimpanzee society is characterized by high fission-fusion dynamics, where community members associate in temporary parties that vary in size, duration, and composition. Particularly in the East African subspecies, females are less gregarious and more difficult to habituate than males. It therefore takes longer to identify and enumerate all the females in a community than all the males. Our observations cover June 1995–May 2016, but data from the first few years contain lacunae caused by uncertainty about the identities of some females and their immature offspring. All adult males present at the start of observation (n = 24) and 20 juvenile and adolescent males were individually recognizable by the end of 1995; we included 22 of the adult males and all the juveniles and adolescents in our analysis (the other two adult males were excluded because they died early in the study, before we had good age estimates for them). We entered other juveniles and adolescents, adult females, and their infant offspring to the sample when their identities were firmly established. A few females with obvious distinguishing features (e.g., snare injuries) entered our demographic sample earlier than others: two adult females entered in 1995, and one adolescent in 1996. By 1998, 36 additional adult females and their dependents had been identified. Between 1999 and 2003, a few other adult females who must have been at Ngogo in 1998 or before, and who had been tentatively identified, were firmly identified along with their offspring. However, we have not included several old females tentatively identified in the 1990s, who presumably died, or several adolescent females, who presumably emigrated in the first few years of the study, before their identities were well established in our sample. Based on these observations and on continuous updating and assessment of previous identifications, Watts and Mitani (2000) estimated that the community numbered about 144 individuals in 1998. This figure exceeds earlier published values of a minimum count of 115 (Watts, 1998), a minimum of 117 by 1998 (Pepper et al., 1999), and a minimum of 114 by 1997 (Watts, 2000). These were conservative estimates that included only those individuals whom all Ngogo researchers recognized by consensus and without question. As “minimum count” implies, we were convinced that the community was larger, and our tentative identifications suggested that it was considerably so, but we initially chose to publish only these conservative estimates, although Watts and Mitani (2000) gave a value of approximately 144 identified individuals by mid-1999. We recognize that all these estimates were subject to error and thus that estimates of how much the community has subsequently grown are also subject to error. Still, we suspect that the correct total at the start of our observations was closer to 140–150 than to the minimum estimates and thus that growth has been less than those minima imply.
We have documented multiple female immigrations during the course of the study; we added immigrants to the sample as of the closest approximations to their arrival dates. One consequence of female immigration into Ngogo is an increase in the number of chimpanzee-years of observation in our female life table between ages 12 and 13 (Table 3). This increase is higher than found in the female life tables of Gombe (Bronikowski et al., 2016) and Kanyawara (Muller and Wrangham, 2014). We assume that in the Gombe community, female immigrants are typically already known to researchers or at least can be matched with known individuals (Pusey et al., 2008), and therefore have already entered the risk pool of the life table. Higher female immigration into the Ngogo community than into that at Kanyawara probably results from several factors, including higher and less variable food production at Ngogo (which presumably acts as a “pull” on females in neighboring communities), the success of Ngogo males in inter-group competition and the recent expansion of the community’s territory (Mitani et al., 2010), and the location of the Ngogo territory in the center of the park, where it is surrounded by neighboring chimpanzee communities rather than by any human settlements.
Table 3.
Life tables for female and male chimpanzees at Ngogo.a
| Females
|
Males
|
||||||||||||||
|---|---|---|---|---|---|---|---|---|---|---|---|---|---|---|---|
| Age | Enter | Die | Cen. | qx | px | lx | ex | Age | Enter | Die | Cen. | qx | px | lx | ex |
| 0 | 86 | 15 | 9 | 0.17 | 0.83 | 1.00 | 35.79 | 0 | 80 | 10 | 9 | 0.12 | 0.88 | 1.00 | 29.61 |
| 1 | 62 | 5 | 4 | 0.08 | 0.92 | 0.83 | 42.25 | 1 | 61 | 2 | 2 | 0.03 | 0.97 | 0.88 | 32.77 |
| 2 | 60 | 0 | 5 | 0.00 | 1.00 | 0.76 | 44.91 | 2 | 57 | 0 | 1 | 0.00 | 1.00 | 0.85 | 32.86 |
| 3 | 55 | 0 | 4 | 0.00 | 1.00 | 0.76 | 43.91 | 3 | 58 | 1 | 3 | 0.02 | 0.98 | 0.85 | 31.86 |
| 4 | 52 | 0 | 7 | 0.00 | 1.00 | 0.76 | 42.91 | 4 | 56 | 1 | 5 | 0.02 | 0.98 | 0.83 | 31.41 |
| 5 | 47 | 0 | 6 | 0.00 | 1.00 | 0.76 | 41.91 | 5 | 53 | 0 | 9 | 0.00 | 1.00 | 0.82 | 30.98 |
| 6 | 41 | 2 | 3 | 0.05 | 0.95 | 0.76 | 40.91 | 6 | 46 | 0 | 1 | 0.00 | 1.00 | 0.82 | 29.98 |
| 7 | 38 | 1 | 1 | 0.03 | 0.97 | 0.72 | 41.98 | 7 | 47 | 0 | 1 | 0.00 | 1.00 | 0.82 | 28.98 |
| 8 | 36 | 0 | 1 | 0.00 | 1.00 | 0.70 | 42.10 | 8 | 52 | 0 | 5 | 0.00 | 1.00 | 0.82 | 27.98 |
| 9 | 35 | 0 | 2 | 0.00 | 1.00 | 0.70 | 41.10 | 9 | 50 | 0 | 4 | 0.00 | 1.00 | 0.82 | 26.98 |
| 10 | 32 | 0 | 4 | 0.00 | 1.00 | 0.70 | 40.10 | 10 | 46 | 0 | 4 | 0.00 | 1.00 | 0.82 | 25.98 |
| 11 | 29 | 0 | 5 | 0.00 | 1.00 | 0.70 | 39.10 | 11 | 45 | 0 | 5 | 0.00 | 1.00 | 0.82 | 24.98 |
| 12 | 26 | 0 | 5 | 0.00 | 1.00 | 0.70 | 38.10 | 12 | 41 | 0 | 0 | 0.00 | 1.00 | 0.82 | 23.98 |
| 13 | 49 | 0 | 3 | 0.00 | 1.00 | 0.70 | 37.10 | 13 | 43 | 0 | 1 | 0.00 | 1.00 | 0.82 | 22.98 |
| 14 | 49 | 0 | 8 | 0.00 | 1.00 | 0.70 | 36.10 | 14 | 45 | 0 | 2 | 0.00 | 1.00 | 0.82 | 21.98 |
| 15 | 43 | 1 | 3 | 0.02 | 0.98 | 0.70 | 35.10 | 15 | 42 | 1 | 2 | 0.02 | 0.98 | 0.82 | 20.98 |
| 16 | 39 | 0 | 2 | 0.00 | 1.00 | 0.69 | 34.93 | 16 | 39 | 0 | 5 | 0.00 | 1.00 | 0.80 | 20.48 |
| 17 | 39 | 0 | 5 | 0.00 | 1.00 | 0.69 | 33.93 | 17 | 36 | 0 | 2 | 0.00 | 1.00 | 0.80 | 19.48 |
| 18 | 34 | 0 | 2 | 0.00 | 1.00 | 0.69 | 32.93 | 18 | 37 | 1 | 0 | 0.03 | 0.97 | 0.80 | 18.48 |
| 19 | 32 | 0 | 4 | 0.00 | 1.00 | 0.69 | 31.93 | 19 | 35 | 0 | 3 | 0.00 | 1.00 | 0.78 | 17.97 |
| 20 | 29 | 0 | 6 | 0.00 | 1.00 | 0.69 | 30.93 | 20 | 34 | 2 | 2 | 0.06 | 0.94 | 0.78 | 16.97 |
| 21 | 27 | 0 | 0 | 0.00 | 1.00 | 0.69 | 29.93 | 21 | 30 | 2 | 1 | 0.07 | 0.93 | 0.73 | 17.00 |
| 22 | 30 | 0 | 4 | 0.00 | 1.00 | 0.69 | 28.93 | 22 | 29 | 2 | 2 | 0.07 | 0.93 | 0.68 | 17.18 |
| 23 | 27 | 0 | 1 | 0.00 | 1.00 | 0.69 | 27.93 | 23 | 27 | 2 | 2 | 0.07 | 0.93 | 0.63 | 17.42 |
| 24 | 27 | 1 | 3 | 0.04 | 0.96 | 0.69 | 26.93 | 24 | 25 | 0 | 0 | 0.00 | 1.00 | 0.59 | 17.77 |
| 25 | 22 | 0 | 3 | 0.00 | 1.00 | 0.66 | 26.94 | 25 | 25 | 0 | 1 | 0.00 | 1.00 | 0.59 | 16.77 |
| 26 | 22 | 1 | 1 | 0.05 | 0.95 | 0.66 | 25.94 | 26 | 26 | 2 | 1 | 0.08 | 0.92 | 0.59 | 15.77 |
| 27 | 20 | 0 | 0 | 0.00 | 1.00 | 0.63 | 26.15 | 27 | 24 | 0 | 2 | 0.00 | 1.00 | 0.54 | 16.05 |
| 28 | 23 | 0 | 0 | 0.00 | 1.00 | 0.63 | 25.15 | 28 | 23 | 0 | 0 | 0.00 | 1.00 | 0.54 | 15.05 |
| 29 | 24 | 0 | 1 | 0.00 | 1.00 | 0.63 | 24.15 | 29 | 23 | 1 | 2 | 0.04 | 0.96 | 0.54 | 14.05 |
| 30 | 22 | 1 | 3 | 0.05 | 0.95 | 0.63 | 23.15 | 30 | 22 | 0 | 1 | 0.00 | 1.00 | 0.52 | 13.66 |
| 31 | 20 | 1 | 2 | 0.05 | 0.95 | 0.60 | 23.23 | 31 | 22 | 0 | 1 | 0.00 | 1.00 | 0.52 | 12.66 |
| 32 | 18 | 0 | 0 | 0.00 | 1.00 | 0.57 | 23.43 | 32 | 20 | 1 | 1 | 0.05 | 0.95 | 0.52 | 11.66 |
| 33 | 19 | 0 | 1 | 0.00 | 1.00 | 0.57 | 22.43 | 33 | 20 | 0 | 1 | 0.00 | 1.00 | 0.49 | 11.25 |
| 34 | 18 | 0 | 0 | 0.00 | 1.00 | 0.57 | 21.43 | 34 | 18 | 2 | 0 | 0.11 | 0.89 | 0.49 | 10.25 |
| 35 | 20 | 0 | 1 | 0.00 | 1.00 | 0.57 | 20.43 | 35 | 17 | 0 | 1 | 0.00 | 1.00 | 0.44 | 10.47 |
| 36 | 21 | 0 | 0 | 0.00 | 1.00 | 0.57 | 19.43 | 36 | 16 | 1 | 0 | 0.06 | 0.94 | 0.44 | 9.47 |
| 37 | 21 | 0 | 0 | 0.00 | 1.00 | 0.57 | 18.43 | 37 | 15 | 1 | 0 | 0.07 | 0.93 | 0.41 | 9.07 |
| 38 | 22 | 0 | 1 | 0.00 | 1.00 | 0.57 | 17.43 | 38 | 14 | 2 | 0 | 0.14 | 0.86 | 0.38 | 8.68 |
| 39 | 21 | 0 | 3 | 0.00 | 1.00 | 0.57 | 16.43 | 39 | 13 | 0 | 2 | 0.00 | 1.00 | 0.33 | 9.04 |
| 40 | 18 | 0 | 3 | 0.00 | 1.00 | 0.57 | 15.43 | 40 | 11 | 0 | 0 | 0.00 | 1.00 | 0.33 | 8.04 |
| 41 | 15 | 0 | 1 | 0.00 | 1.00 | 0.57 | 14.43 | 41 | 11 | 1 | 0 | 0.09 | 0.91 | 0.33 | 7.04 |
| 42 | 16 | 0 | 1 | 0.00 | 1.00 | 0.57 | 13.43 | 42 | 9 | 2 | 0 | 0.22 | 0.78 | 0.30 | 6.69 |
| 43 | 18 | 1 | 0 | 0.06 | 0.94 | 0.57 | 12.43 | 43 | 8 | 1 | 1 | 0.12 | 0.88 | 0.23 | 7.46 |
| 44 | 16 | 1 | 2 | 0.06 | 0.94 | 0.54 | 12.13 | 44 | 6 | 0 | 1 | 0.00 | 1.00 | 0.20 | 7.46 |
| 45 | 16 | 2 | 0 | 0.12 | 0.88 | 0.51 | 11.91 | 45 | 6 | 0 | 0 | 0.00 | 1.00 | 0.20 | 6.46 |
| 46 | 16 | 0 | 2 | 0.00 | 1.00 | 0.44 | 12.54 | 46 | 6 | 0 | 0 | 0.00 | 1.00 | 0.20 | 5.46 |
| 47 | 14 | 0 | 1 | 0.00 | 1.00 | 0.44 | 11.54 | 47 | 6 | 1 | 1 | 0.17 | 0.83 | 0.20 | 4.46 |
| 48 | 16 | 0 | 1 | 0.00 | 1.00 | 0.44 | 10.54 | 48 | 4 | 1 | 0 | 0.25 | 0.75 | 0.17 | 4.25 |
| 49 | 15 | 1 | 2 | 0.07 | 0.93 | 0.44 | 9.54 | 49 | 4 | 0 | 0 | 0.00 | 1.00 | 0.13 | 4.50 |
| 50 | 13 | 0 | 1 | 0.00 | 1.00 | 0.41 | 9.18 | 50 | 4 | 0 | 1 | 0.00 | 1.00 | 0.13 | 3.50 |
| 51 | 14 | 2 | 0 | 0.14 | 0.86 | 0.41 | 8.18 | 51 | 3 | 0 | 0 | 0.00 | 1.00 | 0.13 | 2.50 |
| 52 | 12 | 1 | 0 | 0.08 | 0.92 | 0.35 | 8.46 | 52 | 3 | 1 | 0 | 0.33 | 0.67 | 0.13 | 1.50 |
| 53 | 11 | 0 | 1 | 0.00 | 1.00 | 0.33 | 8.19 | 53 | 2 | 1 | 0 | 0.50 | 0.50 | 0.08 | 1.00 |
| 54 | 10 | 1 | 0 | 0.10 | 0.90 | 0.33 | 7.19 | 54 | 1 | 0 | 1 | 0.00 | 1.00 | 0.04 | 0.50 |
| 55 | 10 | 0 | 0 | 0.00 | 1.00 | 0.29 | 6.93 | 55 | 0 | 0 | 0 | NaN | NaN | NA | NA |
| 56 | 10 | 2 | 1 | 0.20 | 0.80 | 0.29 | 5.93 | 56 | 0 | 0 | 0 | NaN | NaN | NA | NA |
| 57 | 7 | 1 | 0 | 0.14 | 0.86 | 0.23 | 6.29 | 57 | 0 | 0 | 0 | NaN | NaN | NA | NA |
| 58 | 6 | 0 | 0 | 0.00 | 1.00 | 0.20 | 6.25 | 58 | 0 | 0 | 0 | NaN | NaN | NA | NA |
| 59 | 5 | 0 | 1 | 0.00 | 1.00 | 0.20 | 5.25 | 59 | 0 | 0 | 0 | NaN | NaN | NA | NA |
| 60 | 4 | 1 | 1 | 0.25 | 0.75 | 0.20 | 4.25 | 60 | 0 | 0 | 0 | NaN | NaN | NA | NA |
| 61 | 3 | 0 | 0 | 0.00 | 1.00 | 0.15 | 4.50 | 61 | 0 | 0 | 0 | NaN | NaN | NA | NA |
| 62 | 3 | 0 | 0 | 0.00 | 1.00 | 0.15 | 3.50 | 62 | 0 | 0 | 0 | NaN | NaN | NA | NA |
| 63 | 3 | 1 | 0 | 0.33 | 0.67 | 0.15 | 2.50 | 63 | 0 | 0 | 0 | NaN | NaN | NA | NA |
| 64 | 2 | 0 | 1 | 0.00 | 1.00 | 0.10 | 2.50 | 64 | 0 | 0 | 0 | NaN | NaN | NA | NA |
| 65 | 1 | 0 | 0 | 0.00 | 1.00 | 0.10 | 1.50 | 65 | 0 | 0 | 0 | NaN | NaN | NA | NA |
| 66 | 1 | 0 | 1 | 0.00 | 1.00 | 0.10 | 0.50 | 66 | 0 | 0 | 0 | NaN | NaN | NA | NA |
Measures defined in the text.
The total demographic sample includes 306 unique individuals and 3108 chimpanzee-years (“risk years”) of observation. This is the largest demographic dataset available for any community of wild chimpanzees. Our sample includes 166 individuals first identified as infants, less than one year of age. This set includes 86 females, 80 males, and 23 infants who died before observers could be certain of their sex. Half of the infants of unknown sex were randomly treated as females and half as males for analyses. We recorded 42 male deaths and 42 female deaths. The total sample includes 31 female immigrants and 18 female emigrants. As of May 2016, the community numbered 204 individuals, including 115 females and 89 males, of whom 35 were adult males (16 years and older) and 68 adult females (defined as having given birth or at least 14 years old).
Because of initial uncertainties about individual identities and because of the large community size, regular monitoring of all females has been impossible, and certainty regarding birth dates for individuals born since 1995 varies. Some birth dates were known to within a few days and many to within several weeks. However, some were known only to within two to three months; we estimated ages of these infants from their body size and physical development.
We estimated the ages of individuals alive at the start of observations based on visual assessment of growth, development, and signs of senescence, comparisons to other well-studied populations of eastern chimpanzees, and genealogies established through behavioral observations and genetic data (Langergraber et al., 2007). As one example that we used as a starting point for similar cases, we identified male BE as a young adult in 1995 and estimated his age at 18 years, making 1977 his birth year. Genetic data subsequently confirmed our suspicion that female SU was his mother. We assumed that he was her first offspring (SU has since had five more known offspring, all surviving as of May 2016) and assigned her an age of 14 years at his birth; this gave her estimated ages of 32 years in 1995 and 53 years in 2016. We have repeatedly re-assessed these initial estimates as we have observed known-aged individuals mature. Many natal females have remained at Ngogo as adults and reproduced there. We have birth dates for some, and we used data on their ages plus data from other eastern chimpanzee populations to assign an age of 14 years at first reproduction to adult natal females about whose ages we were less certain. Likewise, we used observations of known-aged Ngogo females who emigrated and data from other sites to assign an age of 13 years at the time of immigration to most females who joined the Ngogo community (cf. Muller and Wrangham, 2014). The only exceptions were three parous females who immigrated into the Ngogo community as adults (Langergraber, unpublished data) following the territorial expansion to the northeast (Mitani et al., 2010), to whom we assigned ages based on visual appearance. We used the values that resulted from these age assignments as the “best point estimates” (BPE) of individual ages. We use these point estimates “as is” in the life table calculations (Tables 2 and 3), but in a survivorship analysis (Fig. 4, and see below), we use them as central tendencies of distributions of possible ages subject to age estimation error.
Table 2.
Life table for chimpanzees in the Ngogo community, both sexes combined.a
| Age | Enter | Die | Censored | qx | px | lx | ex |
|---|---|---|---|---|---|---|---|
| 0 | 166 | 25 | 18 | 0.15 | 0.85 | 1.00 | 32.83 |
| 1 | 123 | 7 | 6 | 0.06 | 0.94 | 0.85 | 37.56 |
| 2 | 117 | 0 | 6 | 0.00 | 1.00 | 0.80 | 38.80 |
| 3 | 113 | 1 | 7 | 0.01 | 0.99 | 0.80 | 37.80 |
| 4 | 108 | 1 | 12 | 0.01 | 0.99 | 0.79 | 37.13 |
| 5 | 100 | 0 | 15 | 0.00 | 1.00 | 0.79 | 36.47 |
| 6 | 87 | 2 | 4 | 0.02 | 0.98 | 0.79 | 35.47 |
| 7 | 85 | 1 | 2 | 0.01 | 0.99 | 0.77 | 35.30 |
| 8 | 88 | 0 | 6 | 0.00 | 1.00 | 0.76 | 34.71 |
| 9 | 85 | 0 | 6 | 0.00 | 1.00 | 0.76 | 33.71 |
| 10 | 78 | 0 | 8 | 0.00 | 1.00 | 0.76 | 32.71 |
| 11 | 74 | 0 | 10 | 0.00 | 1.00 | 0.76 | 31.71 |
| 12 | 67 | 0 | 5 | 0.00 | 1.00 | 0.76 | 30.71 |
| 13 | 92 | 0 | 4 | 0.00 | 1.00 | 0.76 | 29.71 |
| 14 | 94 | 0 | 10 | 0.00 | 1.00 | 0.76 | 28.71 |
| 15 | 85 | 2 | 5 | 0.02 | 0.98 | 0.76 | 27.71 |
| 16 | 78 | 0 | 7 | 0.00 | 1.00 | 0.74 | 27.37 |
| 17 | 75 | 0 | 7 | 0.00 | 1.00 | 0.74 | 26.37 |
| 18 | 71 | 1 | 2 | 0.01 | 0.99 | 0.74 | 25.37 |
| 19 | 67 | 0 | 7 | 0.00 | 1.00 | 0.73 | 24.72 |
| 20 | 63 | 2 | 8 | 0.03 | 0.97 | 0.73 | 23.72 |
| 21 | 57 | 2 | 1 | 0.04 | 0.96 | 0.71 | 23.48 |
| 22 | 59 | 2 | 6 | 0.03 | 0.97 | 0.68 | 23.32 |
| 23 | 54 | 2 | 3 | 0.04 | 0.96 | 0.66 | 23.12 |
| 24 | 52 | 1 | 3 | 0.02 | 0.98 | 0.64 | 22.99 |
| 25 | 47 | 0 | 4 | 0.00 | 1.00 | 0.62 | 22.43 |
| 26 | 48 | 3 | 2 | 0.06 | 0.94 | 0.62 | 21.43 |
| 27 | 44 | 0 | 2 | 0.00 | 1.00 | 0.58 | 21.83 |
| 28 | 46 | 0 | 0 | 0.00 | 1.00 | 0.58 | 20.83 |
| 29 | 47 | 1 | 3 | 0.02 | 0.98 | 0.58 | 19.83 |
| 30 | 44 | 1 | 4 | 0.02 | 0.98 | 0.57 | 19.25 |
| 31 | 42 | 1 | 3 | 0.02 | 0.98 | 0.56 | 18.68 |
| 32 | 38 | 1 | 1 | 0.03 | 0.97 | 0.55 | 18.13 |
| 33 | 39 | 0 | 2 | 0.00 | 1.00 | 0.53 | 17.60 |
| 34 | 36 | 2 | 0 | 0.06 | 0.94 | 0.53 | 16.60 |
| 35 | 37 | 0 | 2 | 0.00 | 1.00 | 0.50 | 16.55 |
| 36 | 37 | 1 | 0 | 0.03 | 0.97 | 0.50 | 15.55 |
| 37 | 36 | 1 | 0 | 0.03 | 0.97 | 0.49 | 14.97 |
| 38 | 36 | 2 | 1 | 0.06 | 0.94 | 0.47 | 14.38 |
| 39 | 34 | 0 | 5 | 0.00 | 1.00 | 0.45 | 14.20 |
| 40 | 29 | 0 | 3 | 0.00 | 1.00 | 0.45 | 13.20 |
| 41 | 26 | 1 | 1 | 0.04 | 0.96 | 0.45 | 12.20 |
| 42 | 25 | 2 | 1 | 0.08 | 0.92 | 0.43 | 11.67 |
| 43 | 26 | 2 | 1 | 0.08 | 0.92 | 0.40 | 11.64 |
| 44 | 22 | 1 | 3 | 0.05 | 0.95 | 0.37 | 11.56 |
| 45 | 22 | 2 | 0 | 0.09 | 0.91 | 0.35 | 11.09 |
| 46 | 22 | 0 | 2 | 0.00 | 1.00 | 0.32 | 11.15 |
| 47 | 20 | 1 | 2 | 0.05 | 0.95 | 0.32 | 10.15 |
| 48 | 20 | 1 | 1 | 0.05 | 0.95 | 0.30 | 9.66 |
| 49 | 19 | 1 | 2 | 0.05 | 0.95 | 0.29 | 9.14 |
| 50 | 17 | 0 | 2 | 0.00 | 1.00 | 0.27 | 8.62 |
| 51 | 17 | 2 | 0 | 0.12 | 0.88 | 0.27 | 7.62 |
| 52 | 15 | 2 | 0 | 0.13 | 0.87 | 0.24 | 7.57 |
| 53 | 13 | 1 | 1 | 0.08 | 0.92 | 0.21 | 7.66 |
| 54 | 11 | 1 | 1 | 0.09 | 0.91 | 0.19 | 7.25 |
| 55 | 10 | 0 | 0 | 0.00 | 1.00 | 0.17 | 6.93 |
| 56 | 10 | 2 | 1 | 0.20 | 0.80 | 0.17 | 5.93 |
| 57 | 7 | 1 | 0 | 0.14 | 0.86 | 0.14 | 6.29 |
| 58 | 6 | 0 | 0 | 0.00 | 1.00 | 0.12 | 6.25 |
| 59 | 5 | 0 | 1 | 0.00 | 1.00 | 0.12 | 5.25 |
| 60 | 4 | 1 | 1 | 0.25 | 0.75 | 0.12 | 4.25 |
| 61 | 3 | 0 | 0 | 0.00 | 1.00 | 0.09 | 4.50 |
| 62 | 3 | 0 | 0 | 0.00 | 1.00 | 0.09 | 3.50 |
| 63 | 3 | 1 | 0 | 0.33 | 0.67 | 0.09 | 2.50 |
| 64 | 2 | 0 | 1 | 0.00 | 1.00 | 0.06 | 2.50 |
| 65 | 1 | 0 | 0 | 0.00 | 1.00 | 0.06 | 1.50 |
| 66 | 1 | 0 | 1 | 0.00 | 1.00 | 0.06 | 0.50 |
Measures defined in the text.
Figure 4.

Simulated survivorship curves for Ngogo and Kanyawara incorporating error into age estimates. The centralcurvefor a given site shows theresults of 100 Kaplan–Meier survivorship analyses, each based on a set of values generated using Equation (1) (see text); the upper and lower curves show the corresponding 95% confidence intervals.
Fission-fusion dynamics also introduce varying degrees of uncertainty about the timing of deaths. At Ngogo, we have observed females carrying the bodies of their infants for a few days after the infants died. We have rarely found the corpses of dead chimpanzees otherwise. Following Muller and Wrangham (2014), we assumed that all infants, juveniles, adolescent males, and adult males who disappeared had died. For adolescent and adult males, our standard for ascribing death was six months of no sightings, while for adult females and their dependent offspring, the standard was one year of no sightings. We assumed that dependent infants and juveniles had died whenever we observed their mothers without them. We define adolescent females as those who exhibit early sexual swellings. If an adolescent female disappeared from the community, but was healthy when last seen, we coded her as having emigrated. In contrast, we assumed that most adult females who disappeared had died, because transfer by parous females is rare in chimpanzees (Langergraber et al., 2014). The only exceptions were two of the three adult females who immigrated into Ngogo as adults following a territorial expansion to the northeast (Mitani et al., 2010). These two females disappeared after spending several years at Ngogo, but genetic and camera trap data indicate that they emigrated back to the northeastern community instead of dying (Langergraber and Angedakin, unpublished data).
2.3. Construction of Ngogo life table and survivorship curves
We used the total demographic sample, which includes observations of 306 individuals, to construct period life tables for the population as a whole and for males and females separately (Tables 2 and 3). We calculated how many individuals survived to each integer age and how many died at each age. Following methods used in prior studies of chimpanzee mortality (Hill et al., 2001; Muller and Wrangham, 2014), we calculate qx, the probability of death before age x + 1 conditional on having survived to age x, as the number of deaths within the age interval divided by the number of individuals who entered the interval. All individuals who were censored during an age interval were included in the denominator in the calculation of qx. The probability of living to age x+1 conditional on having survived to age x (px) is simply 1 − qx. In the resulting life tables (Tables 2 and 3), lx refers to the fraction of a birth cohort expected to be living at age x given observed mortality rates. At the start of life (age 0), l0 = 1. For each subsequent year, lx = l(x−1) * p(x−1). We computed ex, defined as future life expectancy at age x, by summing the values from lx+1 to the last year in the life table, ln, and dividing this sum by lx. We added half a year to this value, assuming that, on average, individuals live a half year in the year that they die.
We used the R package ‘Survival’ version 2.38 (Therneau, 2015) to calculate continuous-time Kaplan–Meier estimates of survivorship over the life course. Kaplan–Meier estimates are step functions that provide maximum likelihood estimates of the fraction of a birth cohort expected to survive beyond age x (Kaplan and Meier, 1958). As in the construction of life tables, we calculated estimates from the total demographic sample and for males and females separately. M. Muller (pers. comm., Sept. 2015) kindly provided individual-level Kanyawara mortality data, which we used to construct Kaplan–Meier estimates of Kanyawara survivorship and compare survivorship and mortality in both communities.
We created a second set of survivorship models based on “young samples”. We constructed young samples by sub-sampling from the Ngogo total demographic sample and from individual-level Kanyawara data. The young samples comprised individuals who were age two or younger when they were firmly recognized and entered the mortality risk pool. There are 173 and 66 individuals in the Ngogo and Kanyawara young samples, respectively. The young samples are valuable because they include chimpanzees with the most accurate age estimations, and thus provide a credible depiction of survivorship through adolescence and young adulthood, which typically correlates positively with survivorship to later ages (Gurven and Kaplan, 2007).
2.4. Model of age estimation error
Age estimates based on a combination of genealogical data and visual criteria of growth and development are not perfect, and the error in estimates is probably not distributed evenly among subjects. The intuition of human demographers and primatologists is that as the actual age of subjects increases, the error in estimates of age also increases (Blurton Jones, 2016).
To assess how age estimation error influences our survivorship estimates, we built a simulation that treated BPE values as the central tendencies of distributions of possible ages rather than precise values. To model the distribution of possible ages, we used uniform distributions whose ranges increased as BPE increased. We specified the relationship between BPE and the range of the uniform distribution by the following formula:
| (1) |
We treated the BPE as the median value of the uniform distribution; thus simulated ages were distributed uniformly across an interval with a minimum value of BPE − BPE*0.1 and a maximum value of BPE + BPE*0.1. We chose a scaling factor of 0.2 because it produces estimates that accord with experience. For example, a chimpanzee who was actually 10 years old might have been visually estimated as nine to 11 years old, while individuals estimated to be ages 20, 30, or 40 when first identified were treated as having probabilistic ages uniformly distributed in the intervals 18–22, 27–33, and 36–44 years, respectively. In principal, applying this method to demographic data from other chimpanzee datasets would be easy, provided that information is available on each individual’s estimated age when first observed and when they were censored or died. Using the individual level data from Kanyawara, we compared Kanyawara and Ngogo survivorship in three ways: using the young samples, using the total samples, and using the total samples again, but analyzing them with a model that simulated the effects of age estimation error. We used the model to generate 100 simulated survivorship curves each for Kanyawara and Ngogo and to plot maximum likelihood estimates of survivorship and the 95% confidence intervals of these estimates.
2.5. Alternative demographic sample
To investigate the robustness of our results, we created a conservative sub-sample of our total demographic sample. This sample includes only male data from the first nine years of research at Ngogo (1995–2003), and includes both male and female data from 2004 to 2016. This sample was constructed because more observer effort was focused on males than females in the period 1995–2003. During this period, a few adult females apparently died before they were identified well. In 2001, researchers began regular intensive observational study of adult females and collection of fecal samples from all community members for genetic analyses. By 2004 all community members were individually identified and genotyped, making this a conservative starting point for the monitoring of female vital events. In the Supplementary Online Material (SOM), we provide detailed descriptions and analyses of this alternative conservative sub-sample. Importantly, our results do not substantively change when analysis is restricted to this more conservative sub-sample.
2.6. Analysis of Ngogo–Kanyawara mortality rate differences
We compared the hazard of mortality during the first year of life in the Ngogo young sample to that for an equivalent young sample from Kanyawara with logistic regression and used discrete time event history analysis (Grambsch and Therneau, 1994; Singer and Willett, 2003) to investigate the effects of age and community on mortality hazards in the young samples after the first year of life. We used these methods because the survivorship curves for the two sites cross, which violates assumptions of Cox proportional hazards modeling (Grambsch and Therneau, 1994). Logistic regression and discrete time event history analysis do not permit analysis of censored outcomes, so we included only those individuals who either died in or survived each one-year age interval. Our logistic regression analysis of mortality in the first year of life included study community (a categorical variable) and the intercept as predictor variables; the outcome variable was whether the individual survived. Sample sizes were 63 risk years for Kanyawara and 148 for Ngogo. Our analysis of mortality after the first year of life included as predictor variables a categorical term for the study community, an integer term for the age of each individual during each year of observation, and the intercept; the outcome variable was whether the individual survived each year of observation. Sample sizes were 500 risk years for Kanyawara and 1120 for Ngogo.
We were interested in whether the more abundant and less variable food supply at Ngogo than at Kanyawara led to differences in mortality rates between these two populations despite their documented genetic similarity (Langergraber et al., 2011a,b), and if it did, at which age(s) the mortality difference was greatest. Sensitivity analysis allows one to determine how a change in a single vital rate affects fitness with other vital rates held constant (Caswell, 2001; Jones, 2009). For these analyses, which can be used to make predictions about how the mortality rates of genetically similar populations might vary among environments, we defined the fitness of a demographic schedule as the population growth rate (λ) that it generates. If natural selection has shaped chimpanzee life histories to respond to increases in energy availability in ways that maximize fitness, increased energy availability should have the strongest effect on survival in those ages where increases in survival increase population growth rates (λ) the most (i.e., ages with higher sensitivity of fitness to mortality). Alternatively, if the impact of nutrient availability on mortality rates is similar at all ages, any survival difference between Ngogo and Kanyawara should be roughly equal for all ages. We used the R packages popbio (Stubben and Milligan, 2007) and demogR (Jones, 2007) to perform sensitivity analyses. Our dependent variable was the “Ngogo survival difference” at each age, defined as (Ngogo px Kanyawara px) and taken from the life tables of females. These analyses treat Kanyawara as the “baseline” mortality context. The mathematical limit to the “Ngogo survival difference” at each age is the Kanyawara qx value, because increasing survival by this amount would have led to 100% survival.
3. Results and preliminary discussion
3.1. Life expectancy
Life expectancy at birth (e0) for both sexes combined was 32.8 years (Table 2). It was higher for females (35.8) than for males (29.6) (Table 3); this sex difference remained throughout life. Life expectancy at birth for Ngogo chimpanzees falls within the range of human hunter-gatherers (27–37, Gurven and Kaplan, 2007; Hill et al., 2007) and is similar to values for the Hadza, for whom life expectancy at birth is 35.5 for females and 30.8 for males (Blurton Jones, 2016). At 5 years of age, by which time Ngogo infants are typically weaned, future life expectancy was 36.5 years for the combined sample, 41.9 years for females, and 31 years for males. These increases relative to life expectancy at birth are due to the concentration of early mortality in year 1 (below). Values for females declined steadily thereafter, with no steep drop at any age. Notably, female life expectancy was still 15.4 years at age 40 and 9.2 years at age 50. Male ex values also showed no abrupt drop, although they declined more rapidly than those of females, and at age 20, life expectancy (17 years) was about half that of females (30.9 years).
These results stand in stark contrast to those previously reported for wild chimpanzees. Muller and Wrangham (2014) found that life expectancy at birth was about 20 years for both sexes combined at Kanyawara; values for males and females were 17.1 years and 21.6 years, respectively. In turn, the Kanyawara values were considerably higher than that of Hill et al.’s (2001) earlier four-site sample, which estimated e0 to be 14.6 for females and 11.2 for males. For both sexes combined, future life expectancy at age 14 (e14) was 24 years at Kanyawara (Muller and Wrangham, 2014) and 14 years for the four-site sample (Hill et al., 2001). Females at Kanyawara who survived to age 14 (and who were then assumed to be reproductively mature) could expect to live another 24 years, while Ngogo females at age 14 could expect to live another 36.1 years. By age 40, female life expectancy at Kanyawara dropped to 8 years, about half the Ngogo value. Thus wild chimpanzee life expectancies at adulthood can vary by more than a decade among communities in close proximity, in the absence of epidemic diseases or other catastrophic sources of mortality.
3.2. Survivorship
We first report survivorship for both sexes combined based on the total sample. As at other sites, early life mortality at Ngogo was highest in the first two years of life. However, mortality at Ngogo was then very low until around age 20, followed by a relatively steep drop in survivorship, and thereafter, a relatively consistent rate of decline (Fig. 1).
Figure 1.

Kaplan–Meier survivorship at Ngogo for both sexes combined. Solid line shows expected survival to a given age; dashed lines show 95% confidence intervals.
Logistic regression analysis of mortality in the first year of life showed that mortality was higher at Ngogo than at Kanyawara, but the difference was not significant (p = 0.081). This difference is also apparent in Figure 2, which shows that expected survivorship in the young samples was lower at Ngogo until age three years. In both the young samples and the total samples, survivorship was clearly higher at Ngogo after age three (Figs. 2 and 3 see below).
Figure 2.

Kaplan–Meier survivorship curves at Ngogo and Kanyawara for those individuals two years old or younger when first identified.
Figure 3.

Kaplan–Meier survivorship curves at Ngogo and Kanyawara, for both sexes combined. Solid lines show expected survival to a given age; dashed lines show 95% confidence intervals.
Inspection of life tables for Ngogo (Table 2) and Kanyawara (Muller and Wrangham, 2014, their Table 1) indicates that Ngogo chimpanzees experienced lower mortality rates after the first year of life. The average yearly mortality rate (qx) for Kanyawara chimpanzees (males and females combined) between age 1 and 10 was 0.05, while it was 0.01 for Ngogo. Discrete event history analysis of the young samples excluding the first year of life (Table 4) indicated that mortality hazards significantly increased with age at Kanyawara, and that the mortality hazards for Kanyawara chimps were significantly higher than those for Ngogo chimpanzees. At Kanyawara, each year increase in age from age 1 onward was associated with a 16% decrease in the odds of survival (p < 0.001). When age controlled, the odds of a chimpanzee surviving a year at Ngogo were 2.54 times those at Kanyawara (p < 0.001).
Table 4.
Discrete event history analysis of survival after the first year of life at Ngogo and Kanyawara in young samples.
| Term | Estimate | Odds ratio | p Value |
|---|---|---|---|
| Intercept | 3.63 | – | <0.001 |
| Age | −0.18 | 0.84 | <0.001 |
| Community is Ngogo | 0.93 | 2.54 | <0.001 |
Figure 3 plots the survivorship curve of the total Ngogo sample next to that from Kanyawara. Starting at year 4, expected survivorship was higher at Ngogo. The 95% confidence intervals diverge after the curves cross and do not overlap between age 11 and age 53, indicating that survivorship was significantly higher at Ngogo. Median survival for both sexes combined was 34.5 years at Ngogo, but only 11.2 years at Kanyawara (Fig. 3). The time depth of the Ngogo data is far less than the maximum lifespan of chimpanzees in the wild, although the number of individuals and, thus, risk years in the sample is large. Thus the 95% confidence intervals for the survivorship curve derived from the total sample are wide (Figs. 1 and 3), as they were for Kanyawara. Nevertheless, even when we take the estimated variance into account, the Ngogo–Kanyawara contrasts remain, and survivorship between ages 1 and 20 years at Ngogo did not exhibit the abrupt decline apparent in the Kanyawara data (Fig. 3).
Applying our model of age estimation error (Fig. 4) leads to a spread in the range of our 95% confidence intervals of survivorship and shows that estimates of survivorship at Ngogo were more likely to be affected by age estimation error after age 20 than at younger ages. However, this conservative approach did not change the overall shape of the survivorship curves for either Ngogo or Kanyawara, nor did it substantially lower the central tendency of the survivorship curve for Ngogo; the distribution of expected values for Ngogo survivorship remained above those of Kanyawara from age 4 on (Fig. 4). The wide distributions of 95% confidence intervals in Figure 4 remind us that our survivorship estimates have high variance; the 95% confidence intervals of median survivorship range between 25.5 and 45.3 years at Ngogo and between 9 and 20.5 years at Kanyawara.
3.3. Sex differences in survivorship
The overall survivorship curve masks sex differences in mortality. Median survival at Ngogo was 44.9 years for females and 32 years for males (Fig. 5). Male survivorship at Ngogo appeared to commence a steep decline around age 21, and expected survivorship of males was lower than that of females from age 22 onward. Female survivorship reached a plateau around age two and remained remarkably high into the mid-40s. At Ngogo, the probability that a female would survive to the age of reproductive maturity (14) was 70%, and the probability that a male would reach adulthood at 16 years old was 80% (Fig. 5, Table 3). In contrast, Kanyawara values (Muller and Wrangham, 2014, their Table 1) were only 50% for females and 37% for males.
Figure 5.

Kaplan–Meier survivorship curves at Ngogo for males and females considered separately.
Muller and Wrangham’s (2014) logistic regression analysis of Kanyawara mortality rates (qx) showed that male mortality was higher than female mortality in the 0–14 age group, but the difference was non-significant, and there was no significant sex difference in the 15–30 age group. In contrast, although discrete event history analysis indicates that no significant sex difference in mortality existed in the 0–14 age group at Ngogo (p = 0.144), there was significantly higher (p = 0.027) male mortality in the 15–30 age group, in which males faced yearly odds of death 4.2 times those of females (Table 5).
Table 5.
Discrete event history analysis of mortality in 0–14 and 15–30 age groups at Ngogo.
| Age Group | Term | Estimate | Odds ratio | p Value |
|---|---|---|---|---|
| 0–14 | Intercept | −1.63 | NA | <0.001 |
| Age | −0.67 | 0.51 | <0.001 | |
| Sex is male | −0.52 | 0.60 | =0.144 | |
| 15 – 30 | Intercept | −5.78 | NA | <0.001 |
| Age | 0.04 | 1.04 | =0.479 | |
| Sex is male | 1.42 | 4.16 | =0.027 |
3.4. Detailed differences between Kanyawara and Ngogo mortality
Clearly, mortality was generally lower at Ngogo than at Kanyawara. To gain a more detailed picture of the differences, we plotted the Ngogo survival difference in relation to the mathematical limit of survival improvement (i.e., Kanyawara qx) at each age.
Female Ngogo chimpanzees had survival rates equal to or higher than those of Kanyawara chimpanzees for 35 out of the first 40 years of life (Fig. 6a). The loess curve through the increase in female survival at Ngogo tracks a loess curve through the mathematical limit closely from age 10 through 40. Improvement in male survival at Ngogo was not as great as that of females, but the data indicate that male Kanyawara chimpanzees had a particularly difficult time, relative to Ngogo males, during their growth period: their survival rates were lower for 12 of their first 16 years of life (Fig. 6b). This superimposition of a sex difference on the overall Ngogo advantage was mirrored in life expectancies at birth: the advantage for Ngogo females was an increase of 14.2 years (35.8 years versus 21.6 years), while that for males was an increase of 12.2 years (35.8 years versus 17.1 years).
Figure 6.
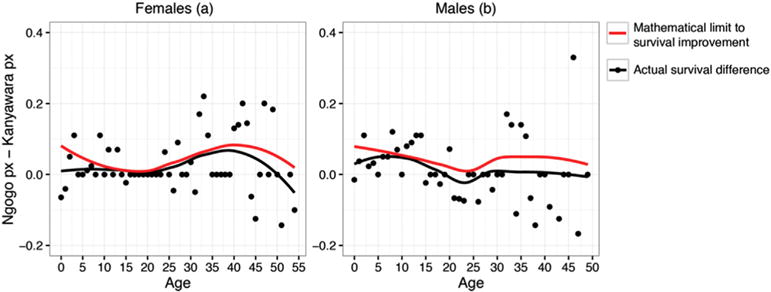
Differences in yearly survival rates (px) between Ngogo and Kanyawara, by sex. The values of px are taken from life tables. The red curve is a loess smoothing through the distribution (points not shown) of the maximum improvement of survival that is mathematically possible at each age. The black curve is a loess smoothing though the distribution of the actual survival difference, with points shown in black.
Sensitivity analysis (Fig. 7) showed that an increase in survival rates early in life (ages 0–10) have a much higher impact on fitness than do increases in survival later in life. An optimal allocation hypothesis would predict that Ngogo survival improvements should be particularly high for individuals aged 0–10.
Figure 7.

The sensitivity of population growth rates to survival rates of each age. Sensitivity is calculated from the perspective of Kanyawara, the baseline group for this analysis.
Partially consistent with this hypothesis, survival rates were higher at Ngogo in five out of 10 of these ages, equal in three, and lower in only two. However, similar mortality reduction also occurred at older ages with lower fitness sensitivities. Female survivorship at Ngogo, relative to Kanyawara, generally tracked the mathematically possible limit across ages 10–40 (Fig. 6a). Thus increases in survival occurred both at ages that have a large influence on fitness and at ages that have less effect on population growth rates or individual fitness.
3.5. Infant survivorship and maternal parity
Relatively high early infant mortality at Ngogo was mostly due to relatively poor survival of first-born infants. Our total sample includes 138 infants age <1 when first identified for whom we knew maternal parity. The mothers of 29 infants were primiparous, while multiparas gave birth to 109 infants. As of May 2016, 29 of these infants had died, 21 before reaching 1 year old. Mortality in the first year of life was significantly higher for first-born infants (10 dying, 17 surviving) than for later-born infants (11 dying, 83 surviving; χ2 =7.7, df =1, p = 0.006).
3.6. Comparisons to other chimpanzee communities and human hunter-gatherers
Figure 8 displays the survivorship curves of Ngogo relative to those of other chimpanzee communities (Fig. 8a) and those of human hunter-gatherers (Fig. 8b). Variation among the chimpanzee communities is extensive, but survivorship at Ngogo was remarkably higher than elsewhere. In fact, Ngogo survivorship overlapped a great deal with the distribution of human hunter-gatherer survivorship curves and was more similar overall to those than to survivorship curves for other chimpanzee communities. Importantly, Ngogo survivorship was higher than other chimpanzee communities that have also not been subject to predation by large carnivores, including Taï (stable period), Kanyawara, and Gombe. This indicates that lack of predators alone was not the primary cause of Ngogo’s high survivorship values.
Figure 8.

Survivorship at Ngogo for both sexes combined compared to that of: a) other wild chimpanzee communities and b) human hunter-gatherer populations. Lines plot the values of lx as reported in life tables (Kanyawara: Muller and Wrangham, 2014, their Table 1; Taï all periods: Hill et al., 2001; Taï stable period: Boesch and Boesch-Achermann, 2000; Mahale: Nishida et al., 2003, their Table 3; Gombe: Bronikowski et al., 2016; Aché forest period: Hill and Hurtado, 1996; Hadza: Blurton Jones, 2016, their Table SI 8.3; Hiwi: Hill et al., 2007; Dobe !Kung: Howell, 2010).
A notable distinction between Ngogo and human foragers, however, was Ngogo’s higher survivorship early in life, starting in the first year. The same distinction held for Kanyawara. Based on a sample of 14 societies, Hewlett (1991) found that, on average, 20.3% of human hunter-gatherer children died in their first year of life. This is higher than q0 values for Ngogo and Kanyawara. The Ngogo lx curve actually lies substantially above the Aché curve until the mid-20s and remains higher than that of the Hadza until age 43 (Fig. 8b). The Ngogo lx curve intercepts that of the less acculturated pre-1950 Dobe !Kung around age 45 (Howell, 2010). At Kanyawara, one female might have reached her sixth decade (Muller and Wrangham, 2014). The oldest individuals reported from all other wild communities are in their 50s (Nakamura and Nishie, 2012), and the oldest captive chimpanzee is estimated to be in her seventies (Ross, 2015). The Ngogo community includes five females who we estimate to have survived into their 60s. Nevertheless, although chimpanzees have a much greater probability of living into their fifth and sixth decades at Ngogo than at other chimpanzee research sites, maximum lifespan at Ngogo is considerably less than that of human hunter-gatherers (Fig. 8).
Based on Ngogo life tables, individuals who reached age 45 had a future life expectancy of 11.1 years. Females were more than twice as likely to reach this age (l45female = 0.51 versus l45male = 0.2) and had about twice the future life expectancy of males at this age (e45female = 11.9 years versus e45male = 6.5 years). These values do not differ greatly from those of Kanyawara chimpanzees, whose e45 values were 9.5 years for females and 8.2 years for males. Though a much larger fraction of the Ngogo community is expected to reach age 45 than at Kanyawara (l45 = 0.35 versus l45 = 0.19), the favorable environmental conditions at Ngogo did not seem to greatly increase future life expectancy at age 45. A chimpanzee’s future life expectancy of 6–12 years at age 45 is surprisingly high, but is still less than that reported for five groups of human hunter-gatherers, who have future life expectancies at age 45 of 13.7–24.2 years (mean weighted by sample sizes = 20.7; Gurven and Kaplan, 2007). These data support the idea that chimpanzee adults senesce more rapidly than humans.
Year-by-year comparison of mortality probabilities further illuminates similarities and contrasts between chimpanzees at Ngogo and Hadza hunter-gatherers (Fig. 9). Hadza mortality rates were higher than those of Ngogo chimpanzees for 17 of the first 20 years of life (Blurton Jones, 2016). We should interpret such mortality differences cautiously, owing to small sample sizes; deaths at any given age were rare events. However, the Ngogo data seem to show: (1) higher mortality among Hadza early in life; (2) a switch to higher chimpanzee mortality at around 20 years, with mortality risk becoming considerably higher for the chimpanzees and remaining so during most of the third decade (which reflects the increase in male mortality at Ngogo; Fig. 5); and (3) a widening divergence in mortality risk at Ngogo starting around age 40 years. The few exceptions to (2) and (3) are, presumably, small sample effects.
Figure 9.

Difference in mortality profiles (annual probabilities of death, qx) for Ngogo chimpanzees and Hadza hunter-gatherers. Values give [qx(Ngogo) qx(Hadza)] for each age; positive values indicate that mortality was higher at Ngogo, negative values that it was higher for the Hadza. Data are for both sexes combined; Hadza data are from Blurton Jones (2016).
3.7. Sources of mortality
The Ngogo community is characterized by high fission-fusion dynamics typical of chimpanzees, and individuals are seen intermittently. Researchers rarely find dead chimpanzees and most often infer that individuals have died after not having seen them for prolonged periods; thus causes of death were usually unknown. The body of male WB, who died at the age of 26 in 2014, was found; he had been suffering from a respiratory infection that was the presumed cause of death. A few individuals who died around the same time also had respiratory infections, and some of those (e.g., male BE, 36 years old) looked weak and emaciated when last seen (A. Tumusiime, pers. com.). Other chimpanzees were noticeably ill when last seen, and we assume that disease and/or the general effects of senescence are common sources of mortality. Male GZ apparently died from a fall – his body was found at the base of a tree – and D. Watts and J. Mitani saw an infant fall to its death as its mother fled from a male who was charging in the top of the canopy. Three females have been seen carrying dead infants presumed to have died of disease, but observers were unable to recover the bodies. Five infants (three of them first-born and two second-born to their respective mothers) have been victims of within-community infanticides, and one was a suspected victim of between-community infanticide.
Between-group aggression is likely to be a major source of mortality (Wilson et al., 2014). Male chimpanzees from Ngogo have killed many individuals in neighboring communities (Mitani et al., 2010; Wilson et al., 2014), but several chimpanzees in the Ngogo community also have been victims of intercommunity aggression. Observers found the bodies of three Ngogo males (estimated ages 18, 23, and 32 years) who had been lethally attacked by neighbors, and we suspect that seven or more adolescent and adult males, who often ranged in peripheral parts of the Ngogo territory, likewise were victims of such attacks. A 22 year-old male (GR) was a victim of lethal within-community coalitionary aggression (Watts, 2004). In 2004, female DAN suffered serious wounds most likely inflicted by males from a neighboring community during a presumed attempted infanticide. Her 1-year old infant looked only slightly wounded, but DAN and the infant disappeared shortly after the attack. Another female (ATW) lost her young infant and suffered less serious bite wounds while she apparently was in a peripheral part of the territory and was not associating with Ngogo males; we assume that the infant was an infanticide victim.
4. Discussion
4.1. Comparisons with other chimpanzee communities
Compared to mortality in other chimpanzee communities, the three most striking findings of this study are: 1) throughout most of their lifespan, Ngogo chimpanzees had lower mortality than reported from any other chimpanzee community, resulting in high life expectancy at birth; 2) Ngogo females experienced a plateau of high survivorship across their reproductive years; 3) a decline in male survivorship at Ngogo appeared after the second decade of life, later than reported for other sites.
High survivorship at Ngogo presumably results largely from favorable ecological circumstances. High survivorship in turn contributes to large community size and high population density (~5 individuals/km2) at Ngogo. The high-quality territory and large size of the Ngogo community are both a cause and a consequence of this community’s success in between-group competition; in 2009, the community expanded its territory to the northeast after killing many neighbors in this area during the previous 10 years (Mitani et al., 2010). Chimpanzee survivorship at Ngogo was probably lower when nonhuman predators were more common, and we do not claim that the site is typical of chimpanzee demography throughout the species’ evolutionary history or range. The Ngogo community has been growing, at a rate that could not represent a long-term average for the species. This indicates that they are experiencing “good times”; conversely, non-sustainable population declines observed in other communities might represent particularly hard times (Hill et al., 2001). However, high survivorship at Ngogo reinforces the argument that data in the “four site” sample of Hill et al. (2001) were not entirely representative for chimpanzees (Muller and Wrangham, 2014) and that survivorship data from sites like Kanyawara (and Ngogo) indicate lower mortality rates (Emery Thompson et al., 2007; Muller and Wrangham, 2014). Most importantly, the wide range of mortality regimes among chimpanzee communities (Fig. 8) means that our focus should be on explaining the variation, not on trying to identify a “representative” site. We should seek to understand how ecological factors influence demographic parameters and examine theories of life history evolution in light of such data.
Muller and Wrangham (2014) argued that variation in pathogen exposure and in types and extent of anthropogenic disturbance largely explained inter-site variation in chimpanzee mortality and that the highest mortality rates (at Taï and Mahale) in the four-site sample reflected recent catastrophic human impacts. Ngogo data, which were not then available, are consistent with this argument. Exposure to pathogens carried by humans is relatively low at Ngogo and is probably lower than at Kanyawara, where the chimpanzees often raid crops (Wilson et al., 2014). Also, the Ngogo study area has suffered relatively little recent human disturbance. In fact, considerable forest regeneration in former anthropogenic grasslands has occurred in the Ngogo chimpanzee community territory since we began our study (Lwanga, 2003; personal observation). Ngogo has not experienced the devastating effects of Ebola and anthrax like those known at Taï, nor is SIVcpz, which has caused considerable mortality at Gombe, present in Kibale.
Low pathogen impact is an insufficient explanation for the major differences in survivorship between Ngogo and Kanyawara, which must also stem from contrasts in feeding ecology. These include the effects of different histories of logging (see Methods above), but also important differences in forest composition and food availability not obviously due to anthropogenic influence. Fruit makes up most of the chimpanzee diet at both sites (Emery Thompson and Wrangham, 2008; Potts et al., 2011; Watts et al., 2012a). The fruit supply varies less at Ngogo; this allows the chimpanzees there to maintain higher net energy intake rates on an annual timescale (Potts et al., 2011), and almost certainly on longer timescales, given that periods of fruit abundance at Ngogo are longer on a multi-annual scale and periods of fruit scarcity are shorter (Gilby and Wrangham, 2007; Watts et al., 2012b). Three tree species that are major food sources at Ngogo, but not Kanyawara, may be the key drivers of differences in survivorship. Stems of F. mucuso are relatively abundant at Ngogo; each stem can produce an enormous fruit crop and might do so at any time of year (Watts et al., 2012b). The figs, which are relatively rich in fructose and glucose and have moderately high gross energy value (Hohmann et al., 2010; K. Potts, unpublished data), are the top food in terms of feeding time at Ngogo and a major staple food (Watts et al., 2012a), but are extremely rare at Kanyawara and a negligible part of the chimpanzee diet there. C. albidum is common at Ngogo but absent at Kanyawara. The tree is a mast-fruiting species and occasional masting events produce super-abundant fruit (Potts et al., 2011; Watts et al., 2012b) that has high energy value (K. Potts, unpublished data). Because of these and other differences in the fruit components of diets at the two sites, chimpanzees at Ngogo quite likely maintain proportionately higher intakes of easily-digested sugars than those at Kanyawara (Potts et al., 2009). Finally, P. mildbraedii is common at Ngogo but rare at Kanyawara. Seeds and seed wings from fruit produced by mature stems of this species are important foods at Ngogo and are often available when overall fruit abundance is low (Potts et al., 2009); they have a moderately high energy value and are high in protein. Leaves from saplings of this species are also a major food at Ngogo; they are perennially available and serve as a fallback when non-fig fruit is scarce (Watts et al., 2012b). They are especially high in protein and, while less rich in easily-assimilated energy than fruit, are likely to be a better energy source than are the pith and stems that are major fallback foods at Kanyawara (Carlson et al., 2013; K. Potts, unpublished data).
Variation in predation pressure also contributes to mortality rate variation among chimpanzee communities (Boesch and Boesch-Achermann, 2000; Muller and Wrangham, 2014). Leopard predation has been documented at Taï (Boesch, 1991) and examination of leopard scat has documented feeding on chimpanzees at other sites (Furuichi, 2000; Nakazawa et al., 2013). Radio-collared leopards at Taï did not approach chimpanzee parties after hearing the chimpanzees call (Zuhberbuhler and Jenny, 2002), and a single leopard might have made all the attacks documented there (Boesch and Boesch-Achermann, 2000). While this might imply that leopards do not commonly attack chimpanzees, Nakazawa et al. (2013) suggested that the frequency of leopard predation has been underestimated. The attacks at Taï targeted individuals of all age/sex classes and at least temporarily had a major impact on mortality and the pattern of survivorship (Boesch, 1991; Boesch and Boesch Achermann, 2000). Leopards are now absent from Kibale (Struhsaker, 1997), and no cases of leopard predation on chimpanzees are known, but they probably contributed to mortality in the past. However, the current absence of leopard predation at Ngogo obviously cannot explain the remarkable difference in mortality rates between this site and Kanyawara, given that leopards are also absent there. Leopards were present at Gombe at least in the early years of work there, and researchers saw two encounters between leopards and chimpanzees, but they did not have evidence of leopard predation. Lions have been reported to prey on chimpanzees at one field site, Mahale (Tsukahara, 1993). While lions and spotted hyenas have been known to occasionally enter Kibale from Queen Elizabeth Park to the south, no predation events on chimpanzees have been documented. Poaching can be considered a form of predation, and chimpanzees at Ngogo risk being trapped in snares set by poachers. About 10% of individuals older than three years (and thus likely to spend considerable time off their mothers) in our sample suffered known or suspected snare injuries, but as far as we know, snare-induced morbidity has not directly caused any deaths. In contrast, about 29% of individuals have suffered snare injuries at Kanyawara (Wrangham and Mugume, 2000). While such injuries have caused only one known death there (Wrangham and Mugume, 2000) and poaching has not been a common source of mortality at Gombe (Williams et al., 2008), we cannot rule out the possibility that detrimental effects of snare injuries on foraging efficiency contribute to differences in mortality. Still, differences in feeding ecology and in the history of anthropogenic influence provide a more compelling explanation for at least most of the Ngogo–Kanyawara contrasts.
We have possibly underestimated mortality by missing early infant deaths and those of some females who died in the early years of the study. For example, parous females SIL and MER both had two discrete periods of repeated cycles, separated by periods longer than the length of gestation in two consecutive years (Watts, 2015); they were not seen with infants between those periods, but might have given birth to infants who died before researchers or field assistants saw them. We might also have over-estimated the ages of some females who were adult when first identified. However, we were more likely to underestimate female ages, because in many cases we assumed that a female’s oldest known offspring was her first born, when she might actually have given birth to previous offspring who died or dispersed before observations began. Our stochastic model of age estimation error allows us to visualize how such error could influence the Ngogo–Kanyawara comparison and shows that despite such error, the Ngogo–Kanyawara difference in survivorship is real and quite large.
In mammals with polygynous or polygynandrous mating systems, male mortality typically exceeds that of females throughout life and males commonly engage in tradeoffs between reproductive effort and survivorship (e.g., red deer, Cervus elaphus: Clutton-Brock et al., 1982). Lower male life expectancy has also been repeatedly found among nonhuman primates, including sifakas (Propithecus verreauxi), capuchins (Cebus capucinus), yellow baboons (Papio cynocephalus), gorillas (Gorilla beringei), and chimpanzees at Gombe (Bronikowski et al., 2016). Higher male mortality was also evident at Kanyawara, but only early in life, perhaps because of the relatively small sample (Muller and Wrangham, 2014). Pre-adult mortality was not higher among males than females at Ngogo, but mortality was higher for males after about age 15, and male life expectancy was considerably less than that of females. Several reasons may account for these sex differences. Chimpanzees have a complex polygynandrous mating system in which males compete directly to gain mating opportunities and to achieve and maintain dominance ranks; in turn, dominance status can influence mating opportunities and reproductive success (Boesch et al., 2006; Inoue et al., 2008; Wroblewski et al., 2009; Newton-Fisher et al., 2010; Langergraber et al., 2013). In this competition, males expend considerable energy during charging displays and other forms of aggression that may affect mortality. Testosterone levels increase when males compete directly for estrous females (Muller and Wrangham, 2004; Sobolewski et al., 2013) and can be positively associated with rank even in the absence of such direct competition (Muller and Wrangham, 2004; Muehlenbein and Watts, 2010). The resulting trade-off between testosterone-mediated mobilization of energy for mating effort and use of that energy to maintain immune function may influence male mortality (Muehlenbein and Bribiescas, 2005). Male chimpanzee body mass is about 1.3 times that of females (Stumpf, 2007; Bribiescas et al., 2012), and this difference in body mass may also contribute to differential mortality between the sexes because of associated differences in energy needed for growth. Finally, males are quite likely subject to higher mortality due to intraspecific aggression (see above).
In a recent survey of lethal aggression among chimpanzees and bonobos, Wilson et al. (2014) reported that most intercommunity killings occurred when parties of attackers overwhelmingly outnumbered their victims. Ngogo had the highest observed rate of killing chimpanzees from neighboring communities and the most males of any study community. At Ngogo, attacking parties contained on average 17.4 individuals, while attacking parties at other sites contained 8.8, a significant difference (data taken from Wilson et al., 2014, Table 7; t = 4.2, p < 0.001). On average, attacking parties of Ngogo chimps outnumbered their victims’ parties by 10 to 1. Ngogo’s large community size and high population density appears to create advantages in intergroup competition, which represents a kind of positive feedback process further increasing both the territory and size of the community.
Mortality is often higher for infants born to primiparous mothers than for infants of multiparas, both in primates (reviewed in Pusey, 2012; see also Arlet et al., 2014) and other iteroparous mammals (e.g., red deer, C. elaphus; Clutton-Brock et al., 1982). We will discuss in a future publication the possible importance of life history tradeoffs in explaining lower survival of first-born offspring at Ngogo. For now, we will simply point out that mortality of firstborn infants contributed disproportionately to infant mortality. The higher mortality at Ngogo relative to Kanyawara during year 1 is intriguing. Perhaps the large size of the Ngogo community results in a greater hazard of intragroup infanticide than is typical for other sites. At Kanyawara, no intracommunity infanticides during the first year of life have been observed (Wilson et al., 2014), while at Ngogo, we observed two such cases and inferred from circumstantial evidence that at least three others have occurred. However, a Fisher’s exact test indicates that the rate of infanticide in year 1 is not significantly different (p = 0.32) between Ngogo and Kanyawara.
Female mortality between the ages of 15 and 30 years at Kanyawara during the period covered by Muller and Wrangham (2014) was near zero. They argued that confirmation of a prolonged period of flat adult mortality from this or other sites would imply that chimpanzees, like humans, invest more in immune function and in somatic maintenance and repair during adulthood than most other primates do. Our findings provide confirming evidence of the potential for prolonged low adult mortality. They may also indicate that adult somatic investment varies in association with ecological factors and is generally higher in energy-rich habitats. Recently published female survivorship curves from seven primate species (Bronikowski et al., 2016) show that two other large-bodied primates mountain gorillas (G. beringei) and muriquis (Brachyteles hypoxanthus) living in environments with little dietary seasonality and low predation risks also exhibit survivorship plateaus (Fig. 10). Perhaps plateaus in adult female survivorship will be found in other primate populations in environmental contexts with low variance feeding ecologies and low predation.
Figure 10.
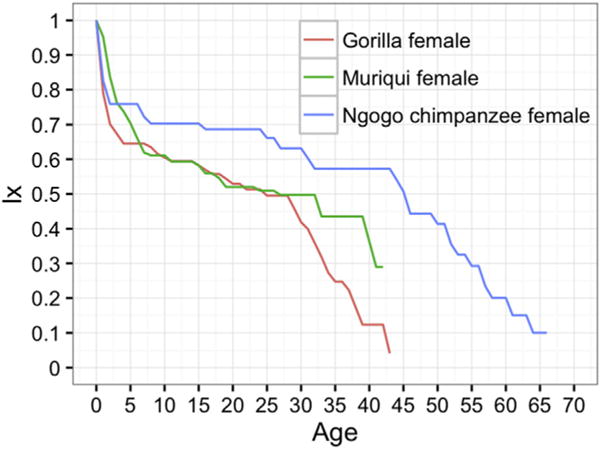
Female survivorship (lx) in mountain gorillas (data from Bronikowski et al., 2016), muriquis (data from Bronikowski et al., 2016) and Ngogo chimpanzees.
Our sensitivity analysis shows that increasing survivorship early in life has a strong impact on fitness in chimpanzee demographic regimes, and so we should expect their survival early in life to increase appreciably when environmental conditions permit. Our results indicate that energy-rich habitats may lead to a general reduction of mortality across all ages, not just those at which mortality rates have the greatest impact on fitness.
4.2. Comparisons with human hunter-gatherers
In many respects, the pattern of survivorship at Ngogo more closely resembles that of human-hunter gatherers than it does other chimpanzee communities (Fig. 8). These data indicate that changes in diet that provide higher and less variable intake rates of easily digested foods enable remarkable shifts in survivorship and age structure of chimpanzee communities. Advantageous ecological contexts might also have produced large changes in survivor-ship and age structure in past hominin communities, providing opportunities for stronger selection on traits expressed relatively late in life. Prominent models of human life history evolution propose that lowered mortality in the hominin line arose from increased food sharing, larger brains, high adult productivity and provisioning, cooperation, and associated changes in social organization (Hawkes et al., 1998; Kaplan et al., 2000; Marlowe, 2000).
Our study is useful for imagining the conditions, and especially the non-genetic factors, that could have initially changed age structures in early hominin populations in ways that more resembled our species today. Our findings are consistent with the general claim that increases in dietary quality would have significantly lowered juvenile, adolescent, and adult mortality rates in the past. We suggest that these mortality-reducing effects could have been realized by the occupation of favorable habitats or adoption of new technologies, independent of changes in food sharing patterns or social relationships. But any changes in habitat, technology, or behavior that increased access to high quality foods and lowered rates of predation would have been important. The control of fire, food sharing, and increasingly effective extractive technologies would have provided notable gains in nutrient supply and probably lowered rates of predation (Wrangham, 2009). By whatever means, ecological contexts of lowered mortality and altered age structures like those seen at Ngogo would have been conducive to positive selection on life-extending genetic variants and would have helped the relevant phenotypic traits to become established.
Ngogo’s favorable ecology results in an age structure that includes a relatively large number of post-reproductive females, although survivorship to such ages is not fitness enhancing. We will explore this result in more detail elsewhere, but note here that the presence of old individuals in a population, some of them post-reproductive, can simply reflect advantageous ecological conditions leading to a general lowering of mortality.
Two of our findings are particularly surprising in comparative perspective. First, Ngogo and other chimpanzee infants experience lower intrinsic mortality rates than human hunter-gatherers even though human socioecology is characterized by high levels of investment in offspring by mothers and others. High levels of offspring care in hunter-gatherers are apparently either offset by higher demands owing to higher human fertility or are simply ineffective at keeping infant mortality low. Babysitting, food sharing, and other forms of allocare might be more important and have a greater impact when children are already weaned. Hence the second surprise: unexpectedly, Ngogo mortality rates were also lower than the Hadza’s across the juvenile and adolescent periods.
The range of variation in chimpanzee mortality rates associated with differences in local ecology raises questions about how much of the difference between human and chimpanzee mortality rates can be ascribed to genetic differences. Equally impressive mortality variation exists among human societies. Burger et al. (2012) pointed out that differences in mortality profiles between wealthy, low-mortality human populations and recent hunter-gatherers exceeded those between hunter-gatherers and chimpanzees. The Ngogo data further reinforce this finding, because they narrow the difference between known ranges of hunter-gatherer and chimpanzee life expectancies. Much of the remaining fraction of survivorship variation that separates human hunter-gatherer and chimpanzee populations may also not result directly from genetic differences. Variation in culture obviously has enormous impacts on mortality in humans; cultural traits that all humans possess most likely increase our species’ survivorship relative to chimpanzees.
5. Conclusion
Ngogo data considerably extend the range of variation in chimpanzee survivorship and show that chimpanzee mortality can be remarkably low in the absence of serious anthropogenic disturbance and predation. Favorable ecological conditions can increase chimpanzee life expectancy to within the range of human hunter-gatherers. Still, future life expectancy at age 45 at Ngogo was markedly lower than among human hunter-gatherers, and maximum lifespan is much less than among hunter-gatherer populations. These contrasts apply for all chimpanzee populations; in our view they qualify as fundamental differences between chimpanzee and human life histories. The Ngogo data are especially informative about how a chimpanzee-like life history might have evolved into one more resembling that of our own species. Much of the difference can be bridged in favorable ecological contexts, without changes to social structure, cooperation, or post-weaning food sharing, socioecological features often proposed to account for our species’ longevity.
Favorable ecological conditions at Ngogo include removal of an “environmental shock” – leopard predation – and a food supply that bestows relatively high energetic and nutritional status and that might thereby decrease pathogen-induced morbidity and mortality. This result should be incorporated into future modeling of the transition from a chimpanzee-like life history to that of modern humans, regardless of when that transition occurred. Our data emphasize the value of evolutionary scenarios for human lifespan extension that begin with improvements in foraging efficiency and anti-predator defense made possible by technology and the occupation of more productive and/or safer habitats.
Supplementary Material
Acknowledgments
We thank The Uganda Wildlife Authority and the Uganda National Council for Science and Technology for permission to conduct research in Kibale National Park, and Makerere University for access to Ngogo and permission to use the facilities of the Makerere University Biological Field Station (MUBFS) there. We are grateful to John Kasenene and Gilbert Isibirye-Basuta for their support in our initial years of research and to Tom Struhsaker for establishing the Ngogo research station and for his continued support over the years. We thank the many researchers who have contributed to the Ngogo demography data base, notably Sylvia Amsler, Melanie Beurlein, Sholly Gunter, Bethany Hansen, Brent Pav, Kevin Potts, Racahna Reddy, Aaron Sandel, Lauren Sarringhaus, Hogan Sherrow, Marissa Sobelewski, Jacob Negrey and Monica Wakefield. Collection of those data, as with all of our work at Ngogo, would not have been possible without the invaluable assistance of Adolph Magoba, Godfrey Mbabazi, Lawrence Ngandizi, Alfred Tumusiime, and Ambrose Twineomujuni. We are indebted to Samuel Angedakin for his expert management of the Ngogo Chimpanzee Project and for facilitating our ongoing work, and especially to the late Jeremiah Lwanga for all the help he provided, over many years, as a researcher and Project Manager at Ngogo and as Director of MUBFS. We thank Martin Muller for providing demographic data from Kanyawara, and Anne Pusey for providing Gombe data. Jamie Jones provided valuable discussion of our methods and results. Three anonymous reviewers provided very helpful comments. Our research at Ngogo has been supported by NSF Awards SBR-9253590, BCS-0215622, and IOB-0516644, NIH grant R01AG049395, and by the Detroit Zoological Society, L.S.B. Leakey Foundation, the National Geographic Society, Primate Conservation Inc., the Wenner-Gren Foundation, the Institute of Human Origins, Arizona State University, Boston University, the University of Michigan, Yale University, and the Max Planck Society. We dedicate this paper to the memory of Jeremiah Lwanga.
Footnotes
For a video synopsis of this article, see http://dx.doi.org/10.1016/j.jhevol.2017.01.003.
Supplementary Online Material
Supplementary online material related to this article can be found at http://dx.doi.org/10.1016/j.jhevol.2017.01.003.
References
- Alberts SC, Altmann J, Brockman DK, Cords M, Fedigan LM, Pusey A, Stoinski TS, Strier KB, Morris WF, Bronikowski AM. Reproductive aging patterns in primates reveal that humans are distinct. Proc Natl Acad Sci. 2013;110:13440–13445. doi: 10.1073/pnas.1311857110. [DOI] [PMC free article] [PubMed] [Google Scholar]
- Arlet ME, Isbell LA, Molleman F, Kaasik A, Chancellor RL, Chapman CA, Mänd R, Carey JR. Maternal investment and infant survival in gray-cheeked mangabeys (Lophocebus albigena) Int J Primatol. 2014;35:476–490. [Google Scholar]
- Blurton Jones N. Demography and Evolutionary Ecology of Hadza Hunter-Gatherers. Cambridge University Press; Cambridge: 2016. [Google Scholar]
- Boesch C. The effects of leopard predation on grouping patterns in forest chimpanzees. Behaviour. 1991;117:220–241. [Google Scholar]
- Boesch C, Boesch-Achermann H. The Chimpanzees of the Taï Forest: Behavioural Ecology and Evolution. Oxford University Press; Oxford: 2000. [Google Scholar]
- Boesch C, Kohou G, Néné H, Vigilant L. Male competition and paternity in wild chimpanzees of the Taï forest. Am J Phys Anthropol. 2006;130:103–115. doi: 10.1002/ajpa.20341. [DOI] [PubMed] [Google Scholar]
- Boesch C, Boesch H, Bi ZBG, Normand E, Herbinger I. The contribution of long-term research by the Tai Chimpanzee Project to conservation. In: Wrangham R, Ross E, editors. Science and Conservation in African Forests: The Benefits of Long-Term Research. Cambridge University Press; Cambridge: 2008. pp. 184–200. [Google Scholar]
- Bogin BA. Evolutionary hypotheses for human childhood. Yearb Phys Anthropol. 1997;40:63–89. [Google Scholar]
- Bribiescas RG, Ellison PT, Gray PB. Male life history, reproductive effort, and the evolution of the genus Homo. Curr Anthropol. 2012;53:S424–S435. [Google Scholar]
- Bronikowski AM, Cords M, Alberts SC, Altmann J, Brockman DK, Fedigan LM, Pusey A, Stoinski T, Strier KB, Morris WF. Female and male life tables for seven wild primate species. Scientific Data. 2016;3:160006. doi: 10.1038/sdata.2016.6. [DOI] [PMC free article] [PubMed] [Google Scholar]
- Burger O, Baudisch A, Vaupel JW. Human mortality improvement in evolutionary context. Proc Natl Acad Sci. 2012;109:18210–18214. doi: 10.1073/pnas.1215627109. [DOI] [PMC free article] [PubMed] [Google Scholar]
- Carlson BA, Rothman JM, Mitani JC. Diurnal variation in nutrients and chimpanzee foraging behavior. Am J Primatol. 2013;75:342–349. doi: 10.1002/ajp.22112. [DOI] [PubMed] [Google Scholar]
- Caswell H. Matrix Population Models, Second ed. Sinauer Associates, Inc; Sunderland, MA: 2001. [Google Scholar]
- Chan MH, Hawkes K, Kim PS. Evolution of longevity, age at last birth and sexual conflict with grandmothering. J Theor Biol. 2016;393:145–157. doi: 10.1016/j.jtbi.2015.12.014. [DOI] [PubMed] [Google Scholar]
- Clutton-Brock TH, Guinness FE, Albon SD. Red Deer: Behavior and Ecology of Two Sexes. University of Chicago Press; Chicago: 1982. [Google Scholar]
- Duda P, Zrzavý J. Evolution of life history and behavior in Hominidae: Towards phylogenetic reconstruction of the chimpanzee–human last common ancestor. J Hum Evol. 2013;65:424–446. doi: 10.1016/j.jhevol.2013.07.009. [DOI] [PubMed] [Google Scholar]
- Emery Thompson M, Wrangham RW. Diet and reproductive function in wild female chimpanzees (Pan troglodytes schweinfurthii) at Kibale National Park, Uganda. Am J Phys Anthropol. 2008;135:171–181. doi: 10.1002/ajpa.20718. [DOI] [PubMed] [Google Scholar]
- Emery Thompson M, Jones JH, Pusey AE, Brewer-Marsden S, Goodall J, Marsden D, Matsuzawa T, Nishida T, Reynolds V, Sugiyama Y. Aging and fertility patterns in wild chimpanzees provide insights into the evolution of menopause. Curr Biol. 2007;17:2150–2156. doi: 10.1016/j.cub.2007.11.033. [DOI] [PMC free article] [PubMed] [Google Scholar]
- Furuichi T. Possible case of predation on a chimpanzee by a leopard in the Petit Loango Reserve, Gabon. Pan Afr News. 2000;7:21–23. [Google Scholar]
- Ghiglieri MP. The Chimpanzees of Kibale Forest: A Field Study of Ecology and Social Structure. Columbia University Press; New York, NY: 1984. [Google Scholar]
- Gilby IC, Wrangham RW. Risk-prone hunting by chimpanzees (Pan troglodytes schweinfurthii) increases during periods of high diet quality. Behav Ecol Sociobiol. 2007;61:1771–1779. [Google Scholar]
- Grambsch PM, Therneau TM. Proportional hazards tests and diagnostics based on weighted residuals. Biometrika. 1994;81:515–526. [Google Scholar]
- Gurven M, Kaplan H. Longevity among hunter-gatherers: A cross-cultural examination. Popul Dev Rev. 2007;33:321–365. [Google Scholar]
- Hawkes K, O’Connell JF, Jones NGB, Alvarez H, Charnov EL. Grand-mothering, menopause, and the evolution of human life histories. Proc Natl Acad Sci. 1998;95:1336–1339. doi: 10.1073/pnas.95.3.1336. [DOI] [PMC free article] [PubMed] [Google Scholar]
- Hewlett BS. Demography and childcare in preindustrial societies. J Anthropol Res. 1991;47:1–37. doi: 10.1086/jar.47.1.3630579. [DOI] [PubMed] [Google Scholar]
- Hill K, Hurtado AM. Cooperative breeding in South American huntergatherers. P Roy Soc Lond B Bio. 2009;276:3863–3870. doi: 10.1098/rspb.2009.1061. [DOI] [PMC free article] [PubMed] [Google Scholar]
- Hill K, Boesch C, Goodall J, Pusey A, Williams J, Wrangham R. Mortality rates among wild chimpanzees. J Hum Evol. 2001;40:437–450. doi: 10.1006/jhev.2001.0469. [DOI] [PubMed] [Google Scholar]
- Hill K, Hurtado AM, Walker RS. High adult mortality among Hiwi huntergatherers: Implications for human evolution. J Hum Evol. 2007;52:443–454. doi: 10.1016/j.jhevol.2006.11.003. [DOI] [PubMed] [Google Scholar]
- Hill KR, Hurtado AM. Aché Life History: The Ecology and Demography of a Foraging People. Aldine de Gruyter; New York: 1996. [Google Scholar]
- Hockings KJ, Anderson JR, Matsuzawa T. Socioecological adaptations by chimpanzees, Pan troglodytes verus, inhabiting an anthropogenically impacted habitat. Anim Behav. 2012;83:801–810. [Google Scholar]
- Hohmann G, Potts K, N’Guessan A, Fowler A, Mundry R, Ganzhorn JU, Ortmann S. Plant foods consumed by Pan: exploring the variation of nutritional ecology across Africa. Am J Phys Anthropol. 2010;141:476–485. doi: 10.1002/ajpa.21168. [DOI] [PubMed] [Google Scholar]
- Howell N. Life Histories of the Dobe !Kung: Food, Fatness, and Well-Being Over the Life-Span. Second. University of California Press; Berkeley: 2010. [Google Scholar]
- Hrdy SB. Mothers and Others. Harvard University Press; Cambridge, MA: 2011. [Google Scholar]
- Inoue E, Inoue-Murayama M, Vigilant L, Takenaka O, Nishida T. Relatedness in wild chimpanzees: influence of paternity, male philopatry, and demographic factors. Am J Phys Anthropol. 2008;137:256–262. doi: 10.1002/ajpa.20865. [DOI] [PubMed] [Google Scholar]
- Jones JH. demogR: A package for the construction and analysis of age-structured demographic models in R. J Stat Soft. 2007;22:11–28. [Google Scholar]
- Jones JH. The force of selection on the human life cycle. Evol Hum Behav. 2009;30:305–314. doi: 10.1016/j.evolhumbehav.2009.01.005. [DOI] [PMC free article] [PubMed] [Google Scholar]
- Kachel AF, Premo LS. Disentangling the evolution of early and late life history traits in humans. Evol Biol. 2012;39:638–649. [Google Scholar]
- Kaplan EL, Meier P. Nonparametric estimation from incomplete observations. J Amer Stat Assoc. 1958;53:457–481. [Google Scholar]
- Kaplan H, Hill K, Lancaster J, Hurtado AM. A theory of human life history evolution: Diet, intelligence, and longevity. Evol Anthropol. 2000;9:156–185. [Google Scholar]
- Keele BF, Jones JH, Terio KA, Estes JD, Rudicell RS, Wilson ML, Li Y, Learn GH, Beasley TM, Schumacher-Stankey J. Increased mortality and AIDS-like immunopathology in wild chimpanzees infected with SIVcpz. Nature. 2009;460:515–519. doi: 10.1038/nature08200. [DOI] [PMC free article] [PubMed] [Google Scholar]
- Koenig A, Borries C. Socioecology of Hanuman langurs: the story of their success. Evol Anthropol. 2001;10:122–137. [Google Scholar]
- Köndgen S, Kühl H, N’Goran PK, Walsh PD, Schenk S, Ernst N, Biek R, Formenty P, Mätz-Rensing K, Schweiger B. Pandemic human viruses cause decline of endangered great apes. Curr Biol. 2008;18:260–264. doi: 10.1016/j.cub.2008.01.012. [DOI] [PubMed] [Google Scholar]
- Kramer KL. Cooperative breeding and its significance to the demographic success of humans. A Rev Anthropol. 2010;39:417–436. [Google Scholar]
- Langergraber KE, Mitani JC, Vigilant L. The limited impact of kinship on cooperation in wild chimpanzees. Proc Natl Acad Sci. 2007;104:7786–7790. doi: 10.1073/pnas.0611449104. [DOI] [PMC free article] [PubMed] [Google Scholar]
- Langergraber K, Mitani J, Vigilant L. Kinship and social bonds in female chimpanzees (Pan troglodytes) Am J Primatol. 2009;71:840–851. doi: 10.1002/ajp.20711. [DOI] [PubMed] [Google Scholar]
- Langergraber K, Schubert G, Rowney C, Wrangham R, Zommers Z, Vigilant L. Genetic differentiation and the evolution of cooperation in chimpanzees and humans. P Roy Soc Lond B Bio. 2011a;278:2546–2552. doi: 10.1098/rspb.2010.2592. [DOI] [PMC free article] [PubMed] [Google Scholar]
- Langergraber KE, Boesch C, Inoue E, Inoue-Murayama M, Mitani JC, Nishida T, Pusey A, Reynolds V, Schubert G, Wrangham RW, Wroblewski E, Vigilant L. Genetic and ‘cultural’ similarity in wild chimpanzees. P Roy Soc Lond B Bio. 2011b;278:408–416. doi: 10.1098/rspb.2010.1112. [DOI] [PMC free article] [PubMed] [Google Scholar]
- Langergraber KE, Mitani JC, Watts DP, Vigilant L. Male–female socio-spatial relationships and reproduction in wild chimpanzees. Behav Ecol Sociobiol. 2013;67:861–873. [Google Scholar]
- Langergraber KE, Rowney C, Crockford C, Wittig R, Zuberbühler K, Vigilant L. Genetic analyses suggest no immigration of adult females and their offspring into the Sonso community of chimpanzees in the Budongo Forest Reserve, Uganda. Am J Primatol. 2014;76:640–648. doi: 10.1002/ajp.22258. [DOI] [PubMed] [Google Scholar]
- Lee PC. Growth and investment in hominin life history evolution: patterns, processes, and outcomes. Int J Primatol. 2012;33:1309–1331. [Google Scholar]
- Leendertz FH, Ellerbrok H, Boesch C, Couacy-Hymann E, Mätz-Rensing K, Hakenbeck R, Bergmann C, Abaza P, Junglen S, Moebius Y. Anthrax kills wild chimpanzees in a tropical rainforest. Nature. 2004;430:451–452. doi: 10.1038/nature02722. [DOI] [PubMed] [Google Scholar]
- Lonsdorf EV, Murray CM, Lonsdorf EV, Travis DA, Gilby IC, Chosy J, Goodall J, Pusey AE. A retrospective analysis of factors ccorrelated to chimpanzee (Pan troglodytes schweinfurthii) respiratory health at Gombe National Park, Tanzania. EcoHealth. 2011;8:26–35. doi: 10.1007/s10393-011-0683-0. [DOI] [PubMed] [Google Scholar]
- Lwanga JS. Localized tree mortality following the drought of 1999 at Ngogo, Kibale National Park, Uganda. Afr J Ecol. 2003;41:194–196. [Google Scholar]
- Lwanga JS, Butynski TM, Struhsaker TT. Tree population dynamics in Kibale National Park, Uganda 1975–1998. Afr J Ecol. 2000;38:238–247. [Google Scholar]
- Marlowe F. The patriarch hypothesis - An alternative explanation of menopause. Hum Nat. 2000;11:27–42. doi: 10.1007/s12110-000-1001-7. [DOI] [PubMed] [Google Scholar]
- Mitani JC, Watts DP, Amsler SJ. Lethal intergroup aggression leads to territorial expansion in wild chimpanzees. Curr Biol. 2010;20:R507–R508. doi: 10.1016/j.cub.2010.04.021. [DOI] [PubMed] [Google Scholar]
- Muehlenbein MP, Bribiescas RG. Testosterone-mediated immune functions and male life histories. Am J Hum Biol. 2005;17:527–558. doi: 10.1002/ajhb.20419. [DOI] [PubMed] [Google Scholar]
- Muehlenbein MP, Watts DP. The costs of dominance: testosterone, cortisol and intestinal parasites in wild male chimpanzees. BioPsychoSoc Med. 2010;4:1–12. doi: 10.1186/1751-0759-4-21. [DOI] [PMC free article] [PubMed] [Google Scholar]
- Muller MN, Wrangham RW. Dominance, aggression and testosterone in wild chimpanzees: a test of the ‘challenge hypothesis’. Anim Behav. 2004;67:113–123. [Google Scholar]
- Muller MN, Wrangham RW. Mortality rates among Kanyawara chimpanzees. J Hum Evol. 2014;66:107–114. doi: 10.1016/j.jhevol.2013.10.004. [DOI] [PubMed] [Google Scholar]
- Mumby H, Vinicius L. Primate growth in the slow lane: a study of inter-species variation in the growth constant A. Evol Biol. 2008;35:287–295. [Google Scholar]
- Nakamura M, Nishie H. Death of the oldest female at Mahale and some notes about longevity of wild chimpanzees. Pan Afr News. 2012;19:19–21. [Google Scholar]
- Nakazawa N, Hanamura S, Inoue E, Nakatsukasa M, Nakamura M. A leopard ate a chimpanzee: First evidence from East Africa. J Hum Evol. 2013;65:334–337. doi: 10.1016/j.jhevol.2013.04.003. [DOI] [PubMed] [Google Scholar]
- Newton-Fisher NE, Thompson ME, Reynolds V, Boesch C, Vigilant L. Paternity and social rank in wild chimpanzees (Pan troglodytes) from the Budongo Forest, Uganda. Am J Phys Anthropol. 2010;142:417–428. doi: 10.1002/ajpa.21241. [DOI] [PubMed] [Google Scholar]
- Nishida T, Corp N, Hamai M, Hasegawa T, Hiraiwa-Hasegawa M, Hosaka K, Hunt KD, Itoh N, Kawanaka K, Matsumoto-Oda A. Demography, female life history, and reproductive profiles among the chimpanzees of Mahale. Am J Primatol. 2003;59:99–121. doi: 10.1002/ajp.10068. [DOI] [PubMed] [Google Scholar]
- Pepper JW, Mitani JC, Watts DP. General gregariousness and specific social preferences among wild chimpanzees. Int J Primatol. 1999;20:613–632. [Google Scholar]
- Potts KB, Chapman CA, Lwanga JS. Floristic heterogeneity between forested sites in Kibale National Park, Uganda: insights into the fine-scale determinants of density in a large-bodied frugivorous primate. J Anim Ecol. 2009;78:1269–1277. doi: 10.1111/j.1365-2656.2009.01578.x. [DOI] [PubMed] [Google Scholar]
- Potts KB, Watts DP, Wrangham RW. Comparative feeding ecology of two communities of chimpanzees (Pan troglodytes) in Kibale National Park, Uganda. Int J Primatol. 2011;32:669–690. [Google Scholar]
- Pruetz JD, Marchant LF, Arno J, McGrew WC. Survey of savanna chimpanzees (Pan troglodytes verus) in southeastern Senegal. Am J Primatol. 2002;58:35–43. doi: 10.1002/ajp.10035. [DOI] [PubMed] [Google Scholar]
- Pusey A. Magnitude and sources of variation in female reproductive performance. In: Mitani J, Call J, Kappeler P, Palombit R, Silk J, editors. The Evolution of Primate Societies. University of Chicago Press; Chicago: 2012. pp. 343–366. [Google Scholar]
- Pusey AE, Pintea L, Wilson ML, Kamenya S, Goodall J. The contribution of long-term research at Gombe National Park to chimpanzee conservation. Conserv Biol. 2007;21:623–634. doi: 10.1111/j.1523-1739.2007.00704.x. [DOI] [PubMed] [Google Scholar]
- Pusey AE, Wilson ML, Collins DA. Human impacts, disease risk, and population dynamics in the chimpanzees of Gombe National Park, Tanzania. Am J Primatol. 2008;70:738–744. doi: 10.1002/ajp.20567. [DOI] [PubMed] [Google Scholar]
- Reynolds V. The Chimpanzees of the Budongo Forest: Ecology, Behaviour, and Conservation. Oxford University Press; Oxford: 2005. [Google Scholar]
- Ross C. Primate life histories. Evol Anthropol. 1998;6:54–63. [Google Scholar]
- Ross SR. North American Regional Studbook for Chimpanzees. Lincoln Park Zoo; Chicago: 2015. [Google Scholar]
- Schwartz GT. Growth, development, and life history throughout the evolution of Homo. Curr Anthropol. 2012;53:S395–S408. [Google Scholar]
- Singer JD, Willett JB. Applied Longitudinal Data Analysis: Modeling Change and Event Occurrence. Oxford University Press; Oxford: 2003. [Google Scholar]
- Smith TM. Teeth and human life-history evolution. A Rev Anthropol. 2013;42:191–208. [Google Scholar]
- Sobolewski ME, Brown JL, Mitani JC. Female parity, male aggression, and the challenge hypothesis in wild chimpanzees. Primates. 2013;54:81–88. doi: 10.1007/s10329-012-0332-4. [DOI] [PubMed] [Google Scholar]
- Struhsaker TT. Ecology of an African Rain Forest: Logging in Kibale and the Conflict Between Conservation and Exploitation. University Press of Florida; Gainseville: 1997. [Google Scholar]
- Stubben C, Milligan B. Estimating and analyzing demographic models using the popbio package in R. J Stat Soft. 2007;22:1–23. [Google Scholar]
- Stumpf R. Chimpanzees and bonobos: Diversity within and between species. In: Campbell C, Fuentes A, MacKinnon K, Bearder S, Stumpf R, editors. Primates in Perspective. Oxford University Press; New York: 2007. pp. 321–344. [Google Scholar]
- Therneau T. A Package for Survival Analysis in S. 2015 http://CRAN.R-project.org/package=survival.
- Tsukahara T. Lions eat chimpanzees: the first evidence of predation by lions on wild chimpanzees. Am J Primatol. 1993;29:1–11. doi: 10.1002/ajp.1350290102. [DOI] [PubMed] [Google Scholar]
- van Noordwijk MA, Kuzawa CW, van Schaik CP. The evolution of the patterning of human lactation: a comparative perspective. Evol Anthropol. 2013;22:202–212. doi: 10.1002/evan.21368. [DOI] [PubMed] [Google Scholar]
- van Schaik CP, Isler K. Life-history evolution. In: Mitani J, Call J, Kappeler P, Palombit R, Silk J, editors. The Evolution of Primate Societies. University of Chicago Press; Chicago: 2012. pp. 220–244. [Google Scholar]
- Watts DP. Coalitionary mate guarding by male chimpanzees at Ngogo, Kibale National Park, Uganda. Behav Ecol Sociobiol. 1998;44:43–55. [Google Scholar]
- Watts DP. Grooming between male chimpanzees at Ngogo, Kibale National Park. I. Partner number and diversity and grooming reciprocity. Int J Primatol. 2000;21:189–210. [Google Scholar]
- Watts DP. Intracommunity coalitionary killing of an adult male chimpanzee at Ngogo, Kibale National Park, Uganda. Int J Primatol. 2004;25:507–521. doi: 10.1007/s10764-020-00185-0. [DOI] [PMC free article] [PubMed] [Google Scholar]
- Watts DP. Long-term research on chimpanzee behavioral ecology in Kibale National Park, Uganda. In: Kappeler P, Watts D, editors. Long-Term Field Studies of Primates. Springer-Verlag; Berlin: 2012. pp. 313–338. [Google Scholar]
- Watts DP. Mating behavior of adolescent male chimpanzees (Pan troglodytes) at Ngogo, Kibale National Park, Uganda. Primates. 2015;56:163–172. doi: 10.1007/s10329-014-0453-z. [DOI] [PubMed] [Google Scholar]
- Watts DP, Mitani JC. Infanticide and cannibalism by male chimpanzees at Ngogo, Kibale National Park, Uganda. Primates. 2000;41:357–365. doi: 10.1007/BF02557646. [DOI] [PubMed] [Google Scholar]
- Watts DP, Potts KB, Lwanga JS, Mitani JC. Diet of chimpanzees (Pan troglodytes schweinfurthii) at Ngogo, Kibale National Park, Uganda, 1. Diet composition and diversity. Am J Primatol. 2012a;74:114–129. doi: 10.1002/ajp.21016. [DOI] [PubMed] [Google Scholar]
- Watts DP, Potts KB, Lwanga JS, Mitani JC. Diet of chimpanzees (Pan troglodytes schweinfurthii) at Ngogo, Kibale National Park, Uganda, 2. Temporal variation and fallback foods. Am J Primatol. 2012b;74:130–144. doi: 10.1002/ajp.21015. [DOI] [PubMed] [Google Scholar]
- Williams J, Lonsdorf E, Wilson M, Schumacher-Stankey J, Goodall J, Pusey A. Causes of death in the Kasekela chimpanzees of Gombe National Park, Tanzania. Am J Primatol. 2008;70:766–777. doi: 10.1002/ajp.20573. [DOI] [PubMed] [Google Scholar]
- Wilson ML, Boesch C, Fruth B, Furuichi T, Gilby IC, Hashimoto C, Hobaiter CL, Hohmann G, Itoh N, Koops K, Lloyd JN, Matsuzawa T, Mitani JC, Mjungu DC, Morgan D, Muller MN, Mundry R, Nakamura M, Pruetz J, Pusey AE, Riedel J, Sanz C, Schel AM, Simmons N, Waller M, Watts DP, White F, Wittig RM, Zuberbuhler K, Wrangham RW. Lethal aggression in Pan is better explained by adaptive strategies than human impacts. Nature. 2014;513:414–417. doi: 10.1038/nature13727. [DOI] [PubMed] [Google Scholar]
- Wrangham R. Catching Fire: How Cooking Made Us Human. Basic Books; New York, New York: 2009. [Google Scholar]
- Wrangham R, Mugume S. Snare removal program in Kibale National Park: a preliminary report. Pan Afr News. 2000;7:18–20. [Google Scholar]
- Wroblewski EE, Murray CM, Keele BF, Schumacher-Stankey JC, Hahn BH, Pusey AE. Male dominance rank and reproductive success in chimpanzees, Pan troglodytes schweinfurthii. Anim Behav. 2009;77:873–885. doi: 10.1016/j.anbehav.2008.12.014. [DOI] [PMC free article] [PubMed] [Google Scholar]
- Zuhberbuhler K, Jenny D. Leopard predation and human evolution. J Hum Evol. 2002;43:873–886. doi: 10.1006/jhev.2002.0605. [DOI] [PubMed] [Google Scholar]
Associated Data
This section collects any data citations, data availability statements, or supplementary materials included in this article.