Abstract
Ribosomes have the capacity to selectively control translation through changes in their composition that enable recognition of specific RNA elements1. However, beyond differential subunit expression during development2,3, evidence for regulated ribosome specification within individual cells has remained elusive1. Here, we report that a poxvirus kinase phosphorylates serine/threonine residues in the small ribosomal subunit protein, Receptor for Activated C Kinase (RACK1) that are not phosphorylated in uninfected cells or cells infected by other viruses. These modified residues cluster in an extended loop in RACK1, phosphorylation of which selects for translation of viral or reporter mRNAs whose 5’ untranslated regions (UTRs) contain adenosine repeats, so-called polyA-leaders. Structural and phylogenetic analysis revealed that although RACK1 is highly conserved, this loop is variable and contains negatively charged amino acids in plants, where these leaders act as translational enhancers for poorly understood reasons. Phosphomimetics and inter-species chimeras demonstrated that negative charge in the RACK1 loop dictates ribosome selectivity towards viral RNAs. By converting human RACK1 to a charged, plant-like state, poxviruses remodel host ribosomes so that adenosine repeats erroneously generated by slippage of the viral RNA polymerase4 confer a translational advantage. Our findings uncover ribosome customization through a novel trans-kingdom mimicry and the mechanics of species-specific leader activity that underlie the enigmatic poxvirus polyA-leaders4.
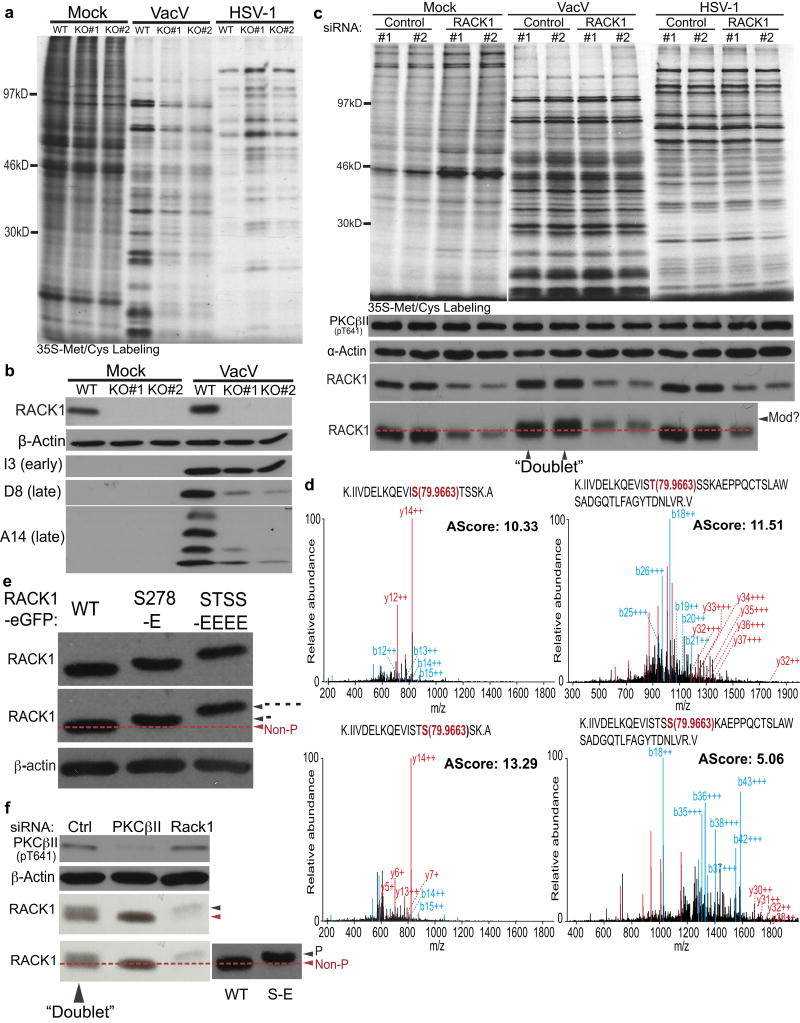
Regulated mRNA translation allows precise temporal and spatial control of protein production. Changes in translation rates for individual mRNAs are often attributed to the controllable activity of eukaryotic initiation factors5. However, it is postulated that ribosomes can specialize through alterations in subunit composition or post-translational modifications to control mRNA-specific translation1. Curiously, some ribosomal subunits exhibit tissue-specific expression patterns and are associated with disease states termed “ribosomopathies”1. Recently, regulons in homeobox (HOX) mRNAs were found to bind RPL38 and mediate their selective translation2,3, revealing how tissue-specific ribosomal protein expression contributes to development. Similar to developmental systems, genetic screens have identified ribosomal proteins required for translation of certain viral but not host mRNAs6. This includes the small ribosomal protein RACK17–10, which contributes to cap-independent Internal Ribosome Entry Site (IRES)-mediated translation by some RNA viruses11. By contrast, most DNA viruses produce capped mRNAs that are structurally similar to their host counterparts. To determine if RACK1 regulates translation of mRNAs encoded by DNA viruses, we infected wildtype or RACK1 knockout human Hap1 cells with the poxvirus, Vaccinia Virus (VacV), or herpes simplex virus type 1 (HSV-1). Unlike VacV, where viral protein synthesis was suppressed in RACK1 knockouts, HSV-1 protein synthesis was unaffected (Fig. 1a). While RACK1 is implicated in regulating poorly understood aspects of 80S ribosome assembly12 and translation of short open reading frames13, both viruses encode similar sized capped mRNAs. Moreover, RACK1 was required for late but not early VacV protein production (Fig. 1b), implying a specific function for RACK1 in late VacV mRNA translation.
Figure 1. RACK1 regulates poxvirus protein synthesis.
a, Protein synthesis in wildtype or RACK1 knockouts (KO#1, KO#2). b, Western blot analysis of samples from a. c, Protein synthesis and Western blot analysis in siRNA-treated NHDFs. “Mod?” highlights mobility-shifted RACK1 forming “doublets”. d, MS/MS spectra of RACK1 peptides from VacV-infected cells. Peptide amino acid sequence and phosphorylated residue (red), b-ions (blue) and y-ions (red), and AScore are indicated. e, Glutamic acid substitutions at S278-E (-) or S276T277S278S279-EEEE (----) cause RACK1 mobility shifts. f, VacV-infected samples depleted of PKCβII or RACK1. RACK1 WT and S278-E mutants from e. illustrate migration of non-phosphorylated (non-P) and single-site phosphorylated (P) RACK1. Data represents 3 biological replicates, except d., 2 replicates. For raw gel data see Supplementary Fig. 1.
Unexpectedly, RNAi-mediated depletion of RACK1 in primary normal human dermal fibroblasts (NHDFs) did not affect HSV-1 or VacV translation (Fig. 1c). However, RACK1 migrated as a close-running doublet in VacV-infected samples, and VacV appeared to convert residual RACK1 in RACK1-depleted cells to the slower-migrating form. Liquid chromatography tandem mass spectrometry (LC-MS/MS) identified a cluster of serine/threonine residues (S276T277S278S279) uniquely phosphorylated in VacV-infected cells (Fig. 1d and Extended Data Fig. 1a). Although LC-MS/MS pointed to potential modifications to any of the STSS residues, only one modification was likely per RACK1 peptide, with S278 exhibiting the highest confidence score. Phosphomimetic substitutions at S278 or the entire STSS motif caused increasing RACK1 mobility shifts (Fig. 1e). Alignment of these samples alongside infected samples supported the notion of single-site modifications by VacV, explaining the close migration of RACK1 doublets (Fig. 1f). In VacV-infected cells RACK1 phosphorylation was prevented by depleting or inhibiting the RACK1 binding protein, PKCβII, while remaining RACK1 in RACK1-depleted cells was phosphorylated (Fig. 1f and Extended Data Fig. 2). This suggested VacV did not need to modify the entire RACK1 population under normal conditions, and generated enough modified RACK1 to support viral protein synthesis in RACK1 siRNA-treated cells. Only when RACK1 was completely unavailable to modify, namely in knockout cells, was VacV protein synthesis suppressed.
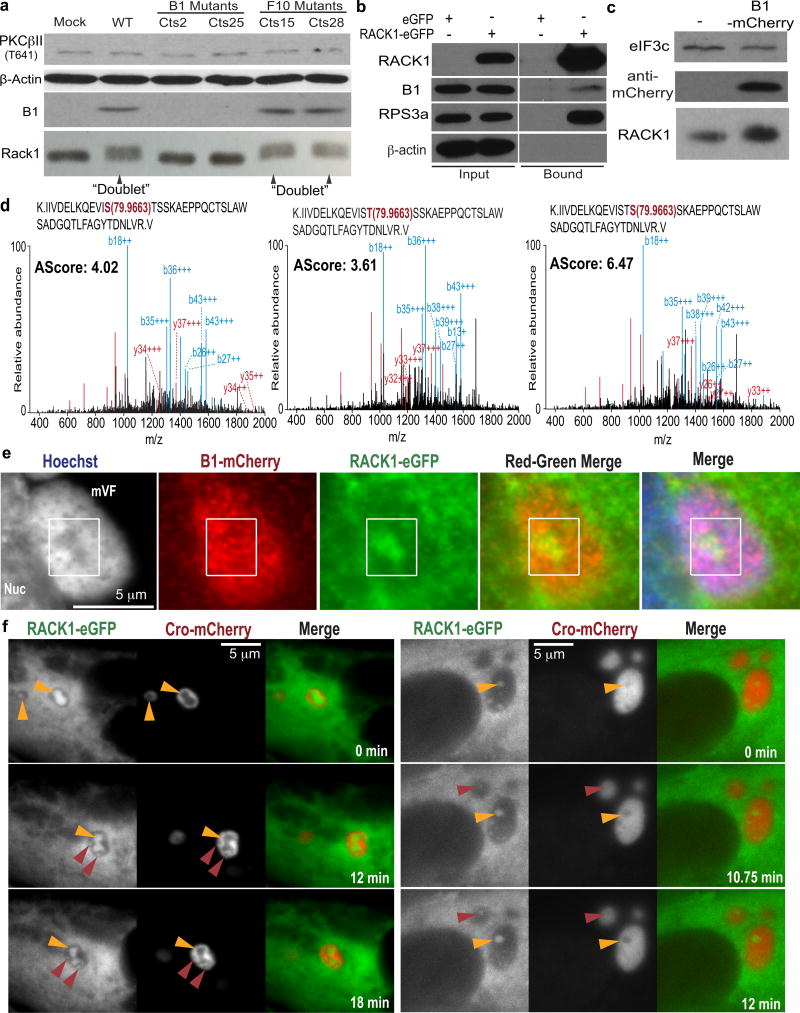
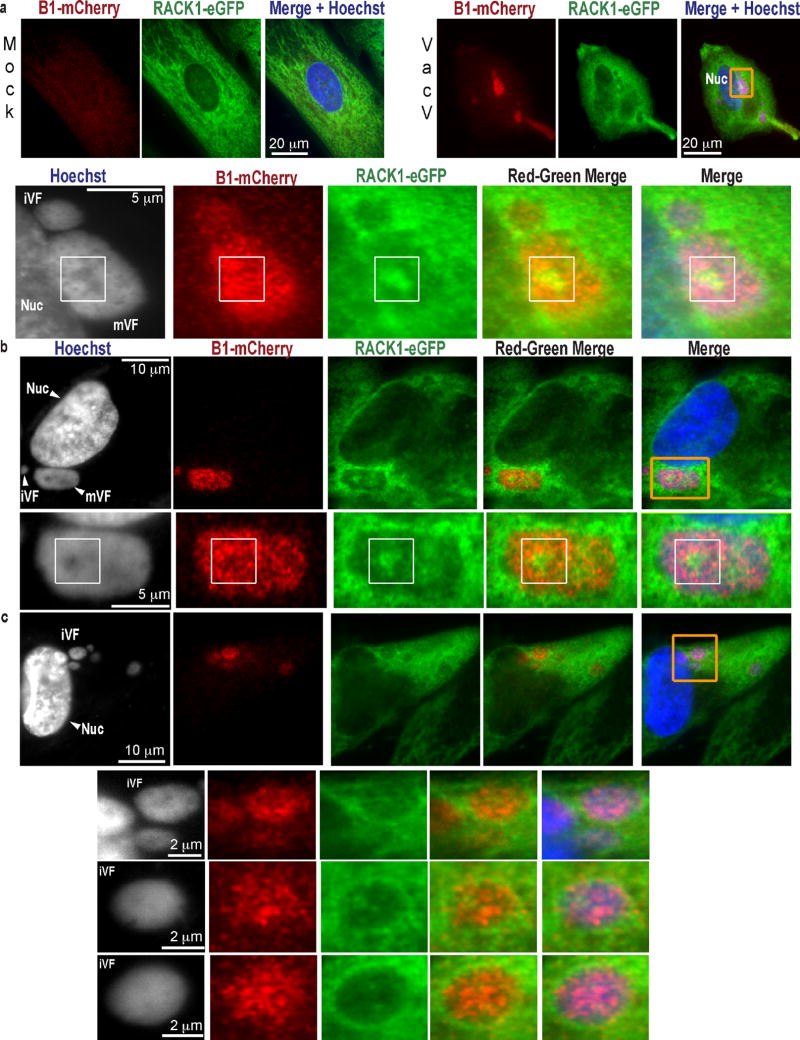
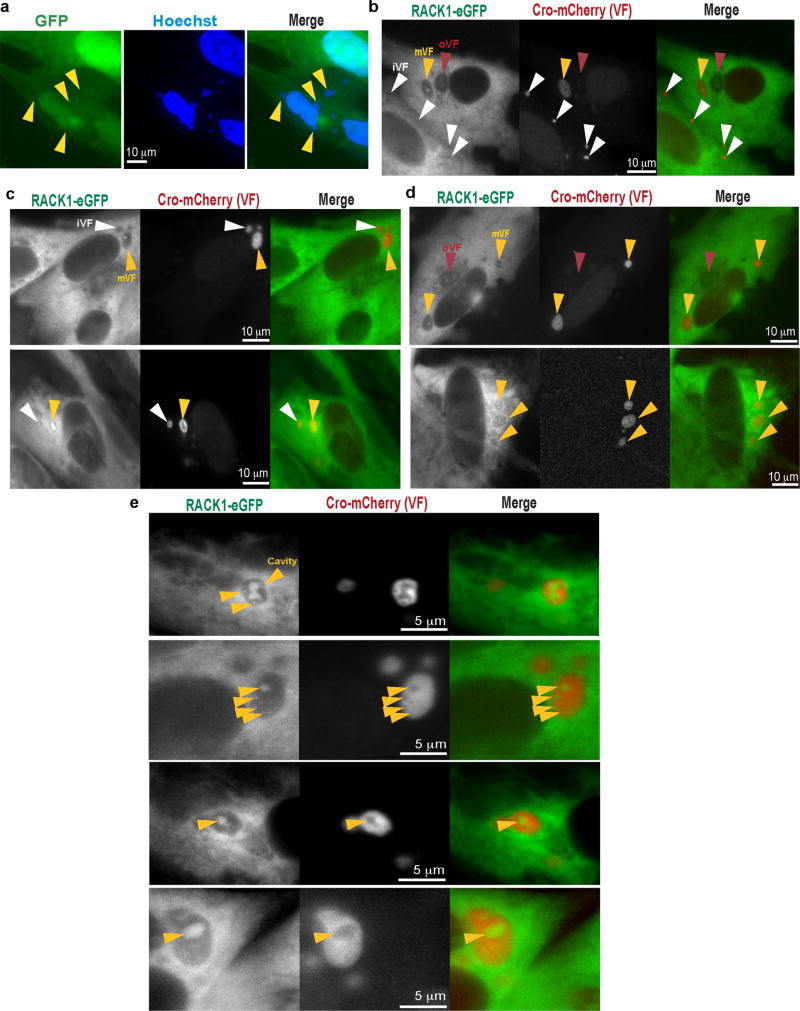
Although VacV required PKCβII to modify RACK1, PKCβII inhibition prevented both the formation of cytoplasmic replication compartments, called Viral Factories (VFs)4 and host translational shut-off associated with late poxvirus infection (Extended Data Fig. 3). Moreover, phosphorylation of the STSS motif could not be detected in uninfected or HSV-1-infected cells, or cells infected with RNA viruses that employ cap-dependent or cap-independent initiation5, all of which contained phosphorylated PKCβII (Extended Data Fig. 4). S276T277S278S279 phosphorylation has not been identified in RACK1 modification screens14, suggesting this is unique to VacV and only indirectly affected by effects of PKCβII inactivation on VacV replication. VacV encodes two kinases, B1 and F104. Using temperature-sensitive (Ts) mutants15,16, RACK1 doublets indicating STSS phosphorylation were detected in cells infected with wildtype- or F10 mutant-, but not B1 mutant-viruses, despite PKCβII phosphorylation (Fig. 2a). “Ts” is a misnomer, as mutant B1 proteins are kinase deficient and unstable at many temperatures15. While host kinases substitute for some B1 functions at permissive temperatures17,18, RACK1 doublets were undetectable with B1 mutants at either temperature, indicative of B1-specific substrates (Extended Data Fig. 4e). B1 also associated with RACK1 complexes (Fig. 2b). Testing this further, B1-mCherry was expressed in NHDFs. Like prior reports15, B1 expressed at low, heterogeneous levels, limiting detection of mobility-shifts against the background of unmodified RACK1 (Fig. 2c). However, LC-MS/MS confirmed that B1 expression recapitulated the RACK1 STSS phosphorylation profile of VacV-infected cells, with S278 again exhibiting the highest confidence score (Fig. 2d and Extended Data Fig. 1b). B1-mCherry also localized to VFs upon infection (Fig. 2e and Extended Data Fig. 5). While broadly distributed throughout VFs, a subpopulation of B1 colocalized with RACK1 within VFs. Live cell imaging of NHDFs expressing RACK1-eGFP and mCherry-Cro (labeling VFs19), further revealed dynamic RACK1 accumulation around VFs and within cavities that formed as VFs matured (Fig. 2f, Extended Data Fig. 6 and Videos 1–9). VFs are the sites of late viral protein synthesis and viral mRNAs localize to VF cavities and peripheries20, further implicating RACK1 in their translation.
Figure 2. VacV B1 kinase phosphorylates RACK1.
a, RACK1 modification requires B1. b, B1 associates with RACK1 complexes from VacV-infected cells. c, B1-mCherry expression in uninfected cells. d, MS/MS spectra of RACK1 peptides from B1-mCherry-expressing cells. Peptide amino acid sequence and phosphorylated residue (red), b-ions (blue) and y-ions (red), and AScore are indicated. e, B1-mCherry and RACK1-eGFP localization to VFs. f, Still images from Supplemental Videos showing RACK1-eGFP and VFs (Cro-mCherry). Red Arrows highlight new cavities filling with RACK1. Yellow arrows highlight RACK1 dynamics within cavities. Data represents 3 biological replicates, except d., MS confirmation was performed once. For raw gel data see Supplementary Fig. 1.
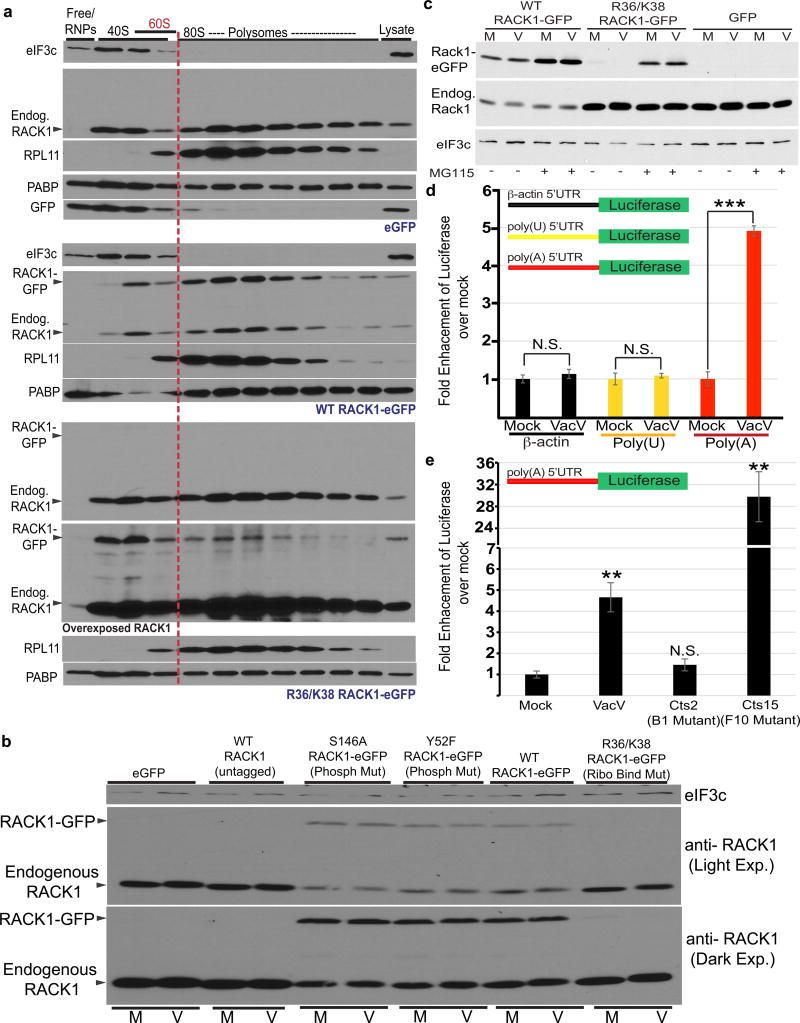
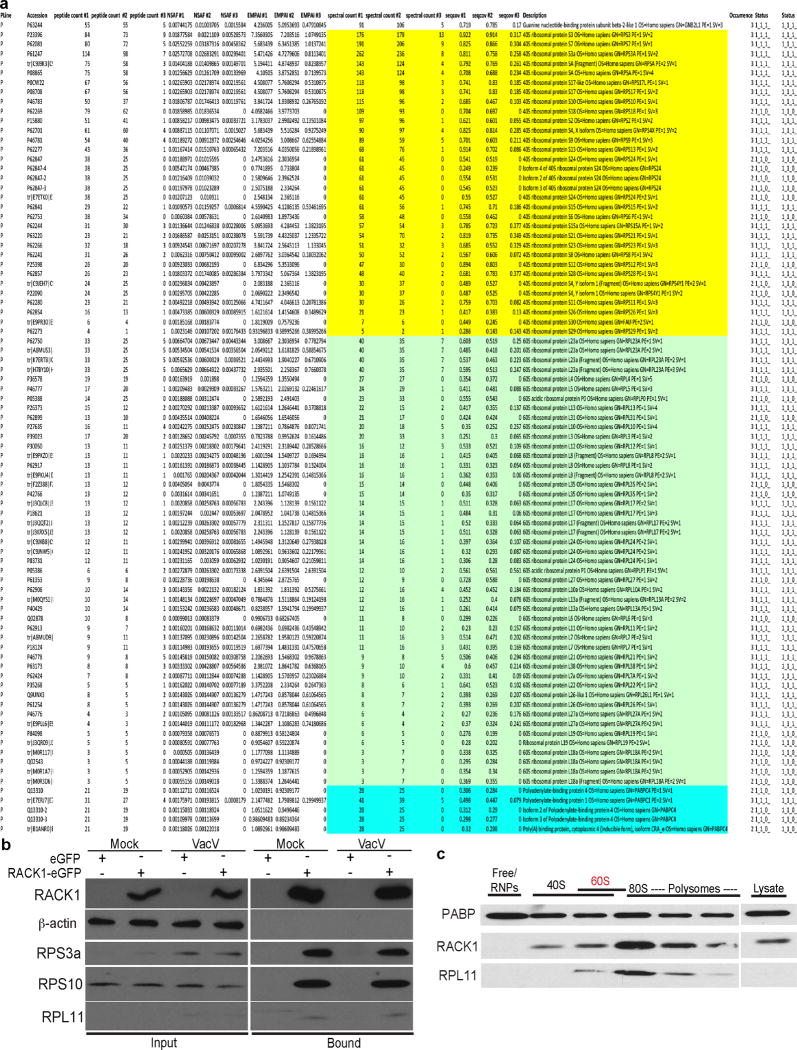
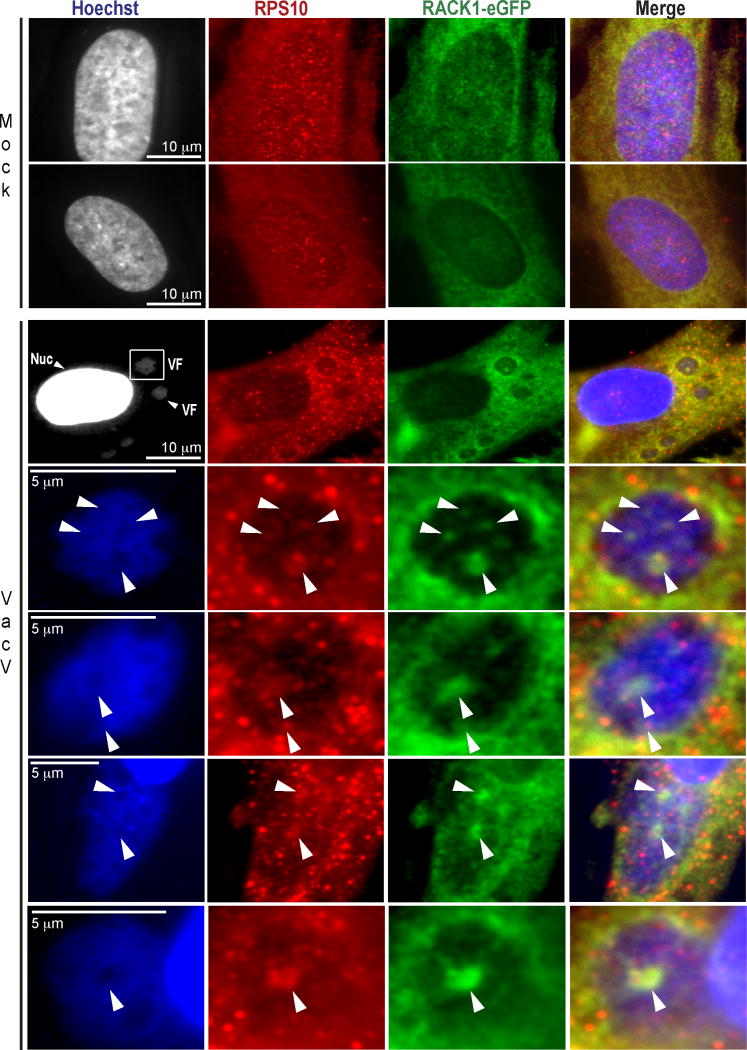
Although RACK1 has extra-ribosomal functions21, VacV did not reduce RACK1 association with ribosomal subunits, and modified RACK1 was found in ribosomal but not free fractions (Extended Data Fig. 7, 8). RACK1 does not appear to be extra-ribosomal in cells from several species22 (Fig. 3a), suggesting this only arises under specific conditions such as transformation8,21,22. Indeed, RACK1 could not be overexpressed in primary NHDFs, and endogenous RACK1 was downregulated upon exogenous RACK1-eGFP expression (Fig. 3b). This did not require RACK1 phosphorylation at canonical sites, but required RACK1 association with ribosomes (Fig. 3a–b). The RACK1 ribosome-binding mutant was poorly expressed due to proteasomal degradation (Fig. 3c). This instability is not intrinsic to the mutation itself11,23, but phosphorylation at T143 stabilizes ribosome-binding mutants14. LC-MS/MS did not detect T143 phosphorylation in uninfected or infected NHDFs, suggesting this only occurs in certain contexts. This revealed careful homeostatic control of RACK1 levels through coupling of its ribosome association with protection from proteasomal degradation, and suggests RACK1 has limited potential for extra-ribosomal functions in normal human fibroblasts.
Figure 3. RACK1 modification correlates with enhanced polyA-leader activity.
a, RACK1 is predominantly ribosome-bound in NHDFs. RACK1 R36/K38 ribosome-binding only residually binds ribosomes. b, RACK1-eGFP, but not R36/K38, downregulates endogenous RACK1. c, Proteasome inhibitor MG115 stabilizes R36/K38. M = Mock; V = VacV. d, VacV enhances luciferase production from polyA-leader reporters. Mean luciferase activity, relative to mock of respective leader. Bars represent s.e.m. n= 5/group. ***p value = 0.00004; two tailed t-test. e, VacV-mediated stimulation of polyA-leaders requires B1. Mean luciferase activity, relative to mock. Bars represent s.e.m. n = 4/group, **p value < 0.01 relative to Mock; two tailed t-test. Data represents 3 or more replicates. For raw data see Supplementary Fig. 1 and 2.
To explore the role of modified RACK1 in VacV translation, we noted that 5’UTRs of late VacV mRNAs contain unusual polyA-leaders4. Luciferase reporters containing β-actin-, polyU- or polyA-leaders revealed that none of these elements naturally act as enhancers in mammalian cells, but upon VacV infection, the polyA-leader became a specific enhancer in a B1-dependent manner (Fig. 3d, e and Extended Data Fig. 9). Luciferase levels in F10-mutant samples suggest F10 may limit B1-dependent polyA-enhancer stimulation during WT infection (Extended Data Fig. 4e). F10 suppresses phosphorylation of several host and viral proteins16, and viruses often restrain stress-inducing processes to avoid killing cells too quickly.
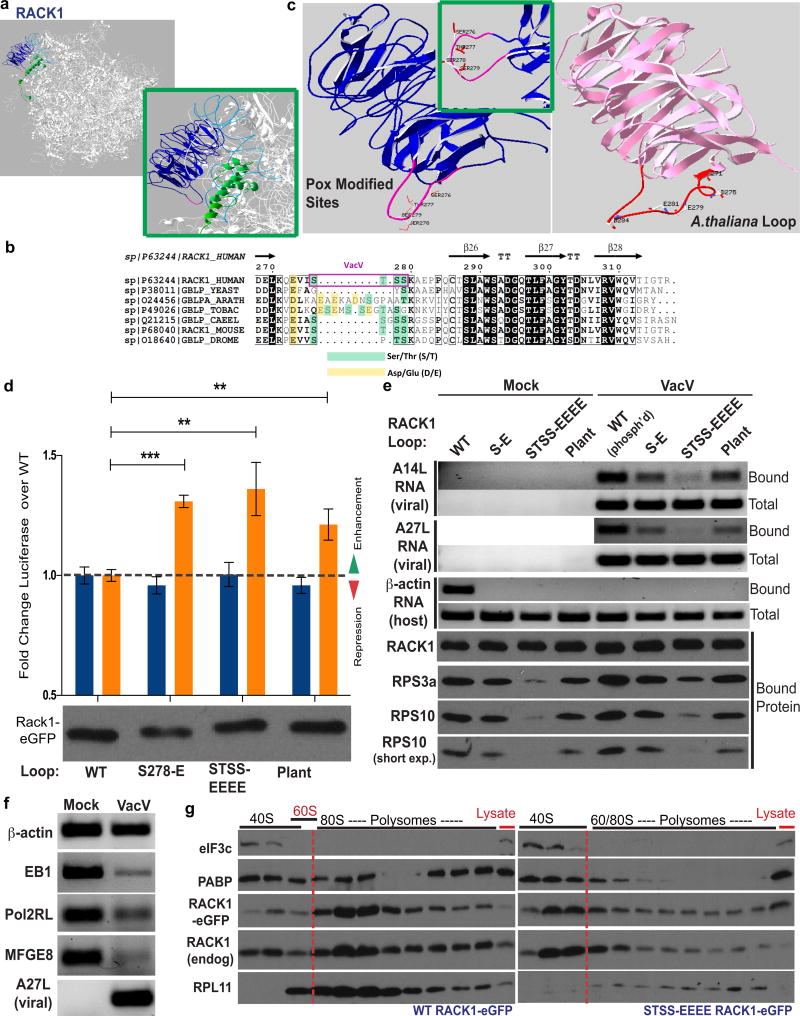
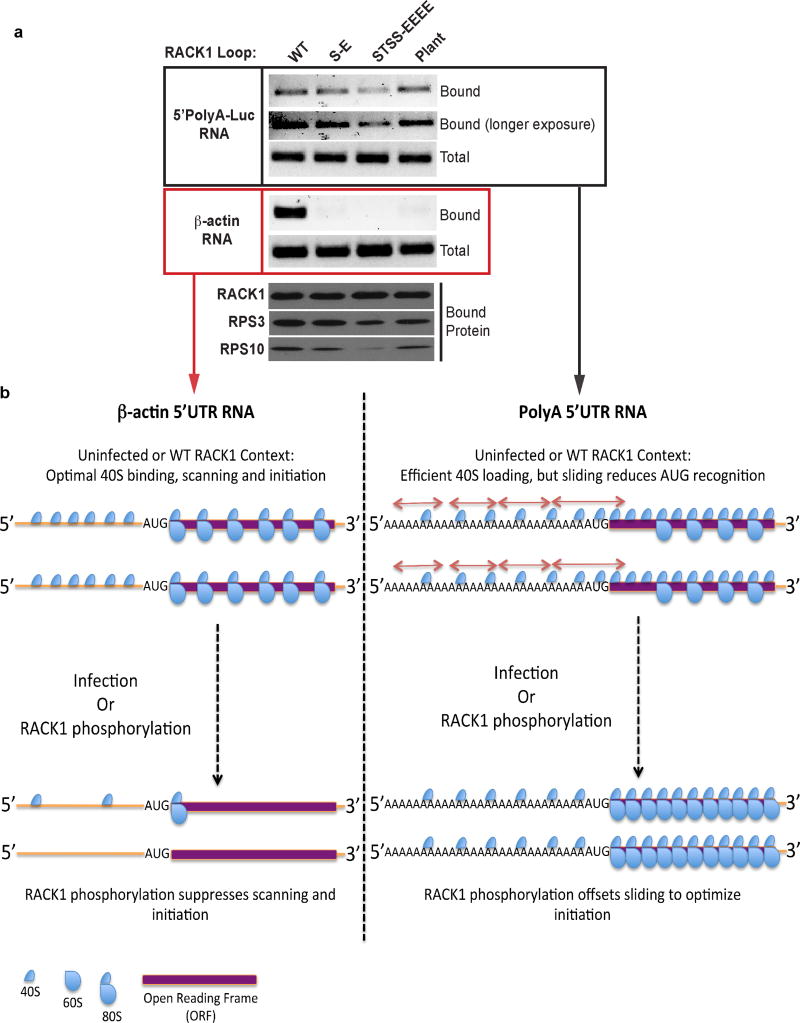
The RACK1 STSS motif lies at the tip of an extended loop that contacts 18s rRNA and other ribosomal subunits at the mRNA exit channel7–10,23 (Fig. 4a). Phylogenetic comparisons revealed that although RACK1 is highly conserved, this loop region is variable23 (Fig. 4b, c and Extended Data Fig. 9). In mammals it is uncharged but in plants, where these leaders act as natural enhancers, the loop is extended and contains non-consecutive negatively charged amino acids. To test effects of loop modifications, NHDFs stably expressing luciferase reporters together with WT RACK1, S278-E or STSS-EEEE phosphomimetics, or human RACK1 in which its loop was replaced with the plant loop were generated. Both phosphomimetic substitutions and the plant loop chimera produced higher levels of polyA-leader luciferase compared to WT RACK1, while β-actin reporters were modestly suppressed (Fig. 4d). Although suggesting RACK1 loop modifications confer an advantage to polyA-leader mRNAs, steady state protein levels are not a direct measure of translation, nor do these assays discern whether transcripts are translated by ribosomes containing endogenous or exogenous RACK1 forms. Testing this, when ribosomes were paused and those containing WT or mutant RACK1-eGFP were isolated from mock-infected or infected cells using GFP-TRAP sepharose, β-actin RNA recovery was significantly reduced by all three charged loops (Fig. 4e). In infected cells, virus-modified WT RACK1 selected against β-actin while viral RNAs were readily detected (Fig. 4e–f). Similarly, 5’polyA-luciferase RNA exhibited a selective advantage over β-actin RNA in the presence of RACK1 phosphomimetics or the plant loop chimera (Extended Data Fig. 10a). Notably, viral RNA was recovered at equivalent levels from complexes containing the S278-E phosphomimetic or plant loop chimera. However, recovery was reduced in the STSS-EEEE phosphomimetic, suggesting that while selective against β-actin and enhancing polyA-luciferase accumulation, clustered loop charge afforded suboptimal selectivity. The plant loop chimera co-migrated with the STSS-EEEE phosphomimetic (Fig. 4d), but its charge is interspersed (Fig. 4b). As B1 phosphorylates single sites in the STSS motif of the smaller, human loop, this highlights the exquisite refinement with which VacV modifies RACK1 to mimic its plant counterpart. Effects of RACK1 loop modifications on viral RNA recovery mirrored effects on RPS subunit association (Fig. 4e). As the STSS-EEEE mutant is stable, it is either a poor proteasome substrate or these differences reflect translational changes, such as altered RACK1 cycling between ribosomes. In the extreme case of the STSS-EEEE phosphomimetic, polysomes were reduced and 40S ribosomes became predominant (Fig. 4g). Based on effects on RPS recovery, this would be more refined with S278-E or plant loops. RACK1 can regulate ribosome movement on mRNAs as the yeast RACK1 ortholog suppresses frameshifts24. Slower scanning rates could conceivably offset “ribosome sliding” that occurs on long polyA sequences25–27, simultaneously customizing ribosomes to a state optimal for viral mRNAs yet suboptimal for host mRNAs (Extended Data Fig. 10b). This represents an alternative mode of ribosome specification distinct from RPL38-mediated binding to Hox mRNAs2,3.
Figure 4. Plant RACK1 loop mimicry controls selectivity toward viral RNAs.
a, RACK1 on the 40S ribosome. Pink; loop modification sites. Green; RPS17. Grey ribbons; 18S rRNA (blue helix 39 and 40). b, RACK1 loop phylogenetic comparisons. Yellow; naturally charged residues. Green; potential phosphorylation sites. Purple; VacV-modified sites. c, Structure-modeling of human and plant (A. thaliana) RACK1 loops, showing poxvirus-modified and negatively charged amino acids, respectively. Inset; different view of human loop. d, RACK1 S278-E or STSS-EEEE phosphomimetics, or the plant loop chimera, enhance luciferase production from polyA-leaders. n = 3/group. ***p value = 0.0001 poly A-Luc WT vs. S278-E, **p value = 0.0054 poly A-Luc WT vs. STSS-EEE, **p value = 0.0061 poly A-Luc WT vs. plant; two-tailed students t-test. e, Host and viral RNA, or RPS3a and RPS10 recovery with RACK1-eGFP WT or loop mutants. f, PCR analysis shows β-actin RNA escapes degradation by VacV. g, Western blot analysis of polysomes in NHDFs expressing WT or STSS-EEEE RACK1. Data represents 3 biological replicates. For raw data see Supplementary Fig. 1 and 2.
The biological significance of poxvirus’ polyA-leaders has been a long-standing enigma. Together with the Tobacco Mosaic Virus (TMV) “Omega leader”, consisting of CAA repeats, these leaders mysteriously exhibit little or no enhancer activity in mammalian systems, but function efficiently in plants27–29. Early experiments hinted the enhancer-responsive activity in plants resided in ribosomal fractions30. Here, we show that enhancer function is regulated by the RACK1 loop that differs in charge between species. Through precise phosphorylation events a poxvirus kinase converts human ribosomes to a plant-like state to exploit polyA-leaders generated by an erroneous viral RNA polymerase, illuminating the mystery of their species-specific leader activity.
Methods
Cell Culture and Viruses
Validated and certified primary NHDFs were purchased from Lonza Walkersville Inc, USA (CC-2509). BSC40, Vero and 293T cells used to propagate viruses were obtained from Dr. Ian Mohr, NYU School of Medicine31. These cells were cultured in Dulbecco’s Modified Eagle’s Medium (DMEM; MT15013CV, Fisher Scientific) supplemented with 2mM L-Glutamine, 1× penicillin-streptomycin and 5% Fetal Bovine Serum (FBS). Hap1 cells were purchased from Horizon, USA (C859) and are fully characterized by the supplier. Hap1 cells were grown in Iscove’s Modified Dulbecco’s medium (IMDM; SH3022801, Fisher Scientific) supplemented with 2 mM L-glutamine, 1× penicillin-streptomycin and 5% FBS. All cultures were confirmed negative for mycoplasma using Hoechst staining. Wildtype and mutant strains of VacV were grown and titrated on BSC40 cells, as described previously15,32,33. HSV-1 was grown and titrated on Vero cells as described previously31. All VacV or HSV-1 infections were performed at multiplicity of infection (MOI) 3–10 for 20h, unless otherwise stated. VSV and EMCV were grown and titrated as described previously34, and infections were performed at MOI 5 for 8h. Lentivirus vectors were produced by co-transfection of 293T cells with pLVX-hygro-based plasmids, described below, together with p8.91 (gag-pol) and p-VSV-G (envelope). Supernatants containing lentivirus were then filtered and used to transduce NHDFs. Transduced cultures were then selected with 100µg/ml hygromycin to generate pools of NHDFs stably expressing proteins of interest. Retroviruses were produced by transfection of pBABE-puro-based plasmids, described below, in Phoenix-Ampho cells (ATCC). Supernatants containing retrovirus were then filtered and used to transduce NHDFs, which were selected with 0.8µg/ml puromycin to generate stably expressing pools.
CRISPR-Cas9 Knockout
To generate RACK1 knockout cells, DNA oligonucleotides (GNB2L1 Exon 2 CACCGATTCCACAGCGTGCTCTTGCG and AAACCGCAAGAGCACGCTGTGGAATC, and GNB2L1 Exon 3 CACCGACCACCACGAGGCGATTTGT and AAACACAAATCGCCTCGTGGTGGTC) representing sgRNA sequences targeting exons 2 and 3 were annealed and cloned into pX458 (Addgene), then transfected into Hap1 cells35,36. Forty-eight hours post transfection, GFP+ cells were FACS sorted, subcloned and clonal cell lines were screened by immunoblotting with RACK1 antibody. Potential CRISPR KO cell lines were then genotyped using the primers CCAGTGTGTTAAACGGGCTGC and GGAAGAGATCCTTGGAGATGG for amplification and sequencing (Supplementary Information Fig. 3).
RNAi, Inhibitors and Metabolic Labeling
Pre-designed siRNAs were obtained from Life Technologies (Thermo Fisher Scientific): Control siRNAs (AM4635 and AM4637), RACK1 (siRNA#1 ID 520341, siRNA#2 ID 520342) or PKCβII (siRNA#1 ID 103396, siRNA#2 ID 261007, siRNA#3 103309). Cells were transfected with 30pmol/ml RACK1 siRNA or 150pmol/mL PKCβII siRNA on two consecutive days using RNAiMax (Invitrogen). 72 hr post-transfection cells were harvested or infected as indicated. For inhibitors, cultures were treated with DMSO solvent control or 50nM PMA (Calbiochem) dissolved in DMSO 1h after infection. Cells were treated with 30µM MG115 dissolved in DMSO for 20 hours. Where shown, cultures were metabolically labeled by incubation in methionine/cysteine-free DMEM (17-204-CL; Corning) supplemented with 77µCi 35S-Methionine/Cysteine (NEG072; Amersham)37 for 30 min prior to cell lysis.
Plasmids, Cloning and Mutagenesis
Human Receptor for activated C kinase 1 (RACK1) with a C-terminal eGFP tag was purchased from Addgene (pEGFP-N1-RACK1; Plasmid #41088)38. RACK1-eGFP cDNA was amplified using forward primer with SpeI site: 5′- AAAAAACTAGTCTCAAGCTTATGACTGAGCAGATG -3′ and reverse primer with NotI site: 5′- AAAAAGCGGCCGCTTACTTGTACAG -3′. PCR amplified cDNA was digested with SpeI and NotI (NEB Biolabs) and ligated into pLVX-IRES-Hygromycin plasmid (Takara Bio USA, Inc) following standard cloning procedures. PCR and Gel extraction kits used were from Qiagen, restriction enzymes and T4 DNA ligase were from NEB Biolabs, and subcloning efficiency DH5α competent cells were from Thermo Fisher Scientific. All constructs were verified by sequencing at the NUSeq Core Facility, Northwestern University.
Site directed mutagenesis of RACK1 was performed with two separate pairs of primers using QuickChange II XL Site-Directed Mutagenesis Kit (Agilent Technologies) or Q5 High-Fidelity DNA polymerase reaction followed by Dpn1 treatment (NEB Biolabs).
Primers used for site directed mutagenesis were:
-
1)
R36/K38 Ribosome Binding Mutant:
Fwd 5′-CTCCGCCTCTGATGATGAGACCA-3′, Rev 5′-TGGTCTCATCATCAGAGGCGGAG-3′
-
2)
Y52F Phosphorylation Site Mutant:
Fwd 5′-GATGAGACCAACTTTGGAATTCCACAGCGTG-3′, Rev 5′- CACGCTGTGGAATTCCAAAGTTGGTCTCATC-3′
-
3)
S146A Phosphorylation Site Mutant:
Fwd 5′- CAGGATGAGGGCCACTCAGAGTGG-3′, Rev 5′- CCACTCTGAGTGGCCCTCATCCTG-3′
-
4)
Untagged RACK1:
Fwd 5′- GCACACGCTAGGGTACCGCGG-3′, Rev 5′- CCGCGGTACCCTAGCGTGTGC-3′
-
5)
S278-E Phosphomimetic Mutant:
Fwd 5′-GTTATCAGTACCGAAAGCAAGGCAG-3′, Rev 5′-GTTATCAGTACCGAAAGCAAGGCAG-3′
-
6)
S276T277S278S279-EEEE Phosphomimetic Mutant:
Fwd 5′-CAAGAAGTTATCGAAGAGGAAGAAAAGGCAGAACCAC-3′, Rev 5′-GTGGTTCTGCCTTTTCTTCCTCTTCGATAACTTCTTG-3′
The plant loop chimera was created by Gibson cloning 39 using Gibson assembly master mix (NEB Biolabs) and a gBlock DNA fragment (Integrated DNA Technologies), digested with BamHI and assembled with into pEGFP-N1-RACK1 treated with BamHI. Insertions were confirmed by sequencing before being used as templates for PCR amplification and sub-cloning in pLVX-IRES-Hygromycin (using SpeI-NotI digestion). All PCR-amplified mutants ligated into pLVX vectors were verified by sequencing at NUSeq Core Facility, Northwestern University. The gBLOCK sequence for the Arabidopsis thaliana loop was:
Plant Loop Chimera (VISTSS -> LKAEAEKADNSGPAAT): gtgactgtctctccagatggatccctctgtgcttctggaggcaaggatggccaggccatgttatgggatctcaacgaaggcaaacacctttacacgctagatggtggggacatcatcaacgccctgtgcttcagccctaaccgctactggctgtgtgctgcTacaggccccagcatcaagatctgggatttagagggaaagatcattgtagatgaactgaagcaagaaCTCAAGGCTGAGGCTGAAAAGGCTGACAACAGTGGTCCTGCTGCCACCaaggcagaaccaccccagtgcacctccctggcctggtctgctgatggccagactctgtttgctggctacacggacaacctggtgcgagtgtggcaggtgaccattggcacacgcGGGGTACCGCGGGCCCGGGATCCACCGGTCGCCACCatggt
Luciferase reporters containing β-actin, polyU or polyA leaders were generated by PCR amplification of the Luciferase gene using the following primers:
-
9)
Poly-A leader Luciferase:
Fwd: 5′-AAAACCGGTAAAAAAAAAAAAAAAAAAAAAAAAAAAAAACATATGGAAGACGCCAAAAAC-3′
Rev: 5′- AAAAAGGATCCTTACAATTTGGACTTTCCGCCC-3′
-
10)
Poly-U leader Luciferase:
Fwd: 5′-AAAACCGGTTTTTTTTTTTTTTTTTTTTTTTTTTTTTTTCATATGGAAGACGCCAAAAAC-3′
Rev: 5′- AAAAAGGATCCTTACAATTTGGACTTTCCGCCC-3′
-
11)
β-Actin leader Luciferase:
Fwd: 5′-AAAACCGGTTCCGCCCGTCCACACCCGCCGCCAGCTCACCATATGGAAGACGCCAAAAAC-3′
Rev: 5′- AAAAAGGATCCTTACAATTTGGACTTTCCGCCC-3′
PCR products were ligated into the retroviral vector pBABE-puro using AgeI and BamHI restriction and T4 ligation (NEB Biolabs).
B1-mCherry was generated by PCR amplification of the B1 gene from VacV genomic DNA using the following primers:
Fwd : 5′-AAAAAGCCGGCATGAACTTTCAAGGACTTGTG-3′
Rev : 5′- AAAAACTCGAGCATATGATAATATACACCCTGCATTAATATG-3′
The PCR product was subcloned into the retroviral vector, pBABE-puro using NgoMIV and XhoI restriction digestion and T4 ligation. The B1-mCherry insert was confirmed by sequencing.
pmCherry-Cro was a gift of Dr. David Evans19. mCherry-Cro was subcloned into pBABE-puro by restriction digestion with Age1 and BamH1, followed by T4 ligation. The insert was confirmed by sequencing.
Western blotting and Antibodies
Whole cell lysates were prepared in lysis buffer (62.5 mM Tris-HCl at pH 6.8, 2% SDS, 10% glycerol, 0.7 M β-mercaptoethanol), followed by boiling for 3 min40. Samples were resolved using 10% Tris-glycine SDS PAGE performed under reducing conditions40. Proteins resolved by gel electrophoresis were transferred to a 0.2 µm pore size nitrocellulose membrane (GE Healthcare Life Sciences, Pittsburgh, PA, USA) using a wet electro blotting system (Mini Trans-Blot, Bio-Rad Laboratories, Inc.) at 57 V for 70 min. After transfer, the membrane was blocked (5% non-fat dry milk, 0.1% Tween in TBS) for 1h at room temperature. Blocking buffer was then removed and membranes were rinsed before incubation with primary antibody (diluted in 3% BSA, 0.1% Tween in TBS) overnight at 4°C. Membranes were washed before incubation with HRP-conjugated secondary antibody (GE Healthcare Life Sciences) diluted 1:3000 in 5% non-fat dry milk , 0.1% tween in TBS for 1h at room temperature, followed by washing. For detection, membrane was incubated with Pierce ECL Western Blotting Substrate (Thermo Fisher Scientific) for 1 min before exposure to x-ray film.
The following antibodies were used: RACK1: Rabbit mAb #5432(D59D5), β-Actin: Mouse mAb #3700 (8H10D10), RPL11: Rabbit polyclonal Ab (#14382), GFP for Western blotting: Rabbit mAb #2956 (D5.1), eIF3c: Rabbit polyclonal Ab (#2068) from Cell Signaling Technology. α-Actin: Rabbit Polyclonal Ab #A2103 from Sigma-Aldrich. Rabbit mAb [EPR8545] to Ribosomal protein S10 was from Abcam (Ab151550). Rabbit anti-VacV polyclonal antibody (#8101) was from Virostat. Anti-GFP for IF was from Novus Biologicals (NB100-62622). Rabbit Anti-phospho-PKCβII (Thr641) Polyclonal Antibody was from EMD Millipore. Anti-mCherry/RFP antibodies were Mouse mAb [6G6] for western blotting or Rat mAb [5f8] for IF, Chromotek. Total 4E-BP1 antibody #A300-501A from Bethyl Laboratories. Rabbit PABP antiserum was from Simon Morley, University of Sussex, UK. Rabbit anti-B1 was from Paula Traktman, the Medical University of North Carolina, USA. Mouse anti-I3 was from David Evans and Nicole Favis, University of Alberta, Canada. Mouse anti-D8 and anti-A14 mAbs were from Yan Xiang, University of Texas Health Science Center, TX,USA.
PCR and RT-qPCR
RNA was isolated using Trizol (Invitrogen, Thermo Fisher Scientific). 0.1 μg of RNA was reverse transcribed using Transcriptor First Strand cDNA Synthesis Kit (Roche Applied Science Mannheim) followed by PCR using Q5 High-Fidelity DNA polymerase (NEB Biolabs). 1µl cDNA was used as template and amplification products were resolved on 1% Agarose gels, staining using SYBR safe. Real-time PCR was performed was performed using FastStart Universal SYBR Green Master (Rox) on a 96-well plate using 7500 Fast Real-Time PCR System (Applied Biosystems). RNA quantitation was done using comparative Ct methods (ΔΔCt method). β-actin was used as endogenous control and mock sample was used as calibrator. Average Ct values were used to calculate fold change or 2^(−ΔΔCt). Primers used were: Luciferase forward primer 5′-TCAAAGAGGCGAACTGTGTG-3′, Luciferase reverse primer 5′-TTTTCCGTCATCGTCTTTCC-3′. β-actin forward primer 5′-CATGTACGTTGCTATCCAGGC-3′, β-actin reverse primer 5′-CTCCTTAATGTCACGCACGAT-3′. POLR2L forward primer 5’-AGGAGAGCCTTCCATCTCG-3’, POLR2L reverse primer 5’-ATCTGGCTCTTCAGATTCCG-3’, MFGE8 forward primer 5’-CACTCTGCGCTTTGAGCTAC-3’, MFGE8 reverse primer 5’-TCCAGCTGAAGAGATGCAAG-3’, EB1 forward primer 5’-ctgtatgccacagatgaagg-3’, EB1 reverse primer 5’-ccagacacaatgtcaaacgc-3’, A14 forward primer 5’-GGACATGATGCTTATGATTGG-3’; A14 reverse primer 5’-CTTTCCATGTACGAGTGGGACTG-3’; A27 forward primer 5’- CTAAACGCG AAGCAATTGTTAAAG-3’; A27 reverse primer 5’- CTTCATCGTTGCGTTTACAACAC-3’. Amplicons were resolved on 1.5% agarose gel and stained with SYBR safe stain.
Luciferase and RNA Selectivity assays
For infected cell luciferase assays, NHDFs were seeded on 12-well plates and transfected with 200ng plasmid DNA encoding luciferase reporters harboring 5’ PolyA, polyU or β-Actin leaders, described above. 48h post-transfection cells were mock infected or infected with VacV at MOI 10. 20h post-infection cultures were washed with PBS and lysed with 200 μl Luciferase Cell Culture Lysis Reagent (Promega, Madison). Lysates were clarified by centrifugation at 10,000Xg for 2 min. 20μl supernatant was added to 96-well plates and luciferase activity was measured using a Spectramax microplate reader.
For RNA selectivity assays, to isolate RACK1-containing ribosomes and associated mRNAs 6cm dishes were seeded with NHDFs stably expressing WT, plant loop or phosphomimetic forms of RACK1-eGFP, described above. Cells were either mock-infected or infected with VacV at MOI 3 for 20 h. Cells were then pre-treated for 10 min with 100 μg/ml cycloheximide, washed with ice cold PBS, and harvested in lysis buffer (50 mM HEPES pH 7.4, 150 mM NaCl, 1.5 mM MgCl2, 2 mM EDTA, 1.6 mM Na3VO4, 25 mM glycerophosphate, 1.5% NP-40, 100 μg/ml cycloheximide, 25 U/ml Ribolock RNase inhibitor and complete mini EDTA-free protease inhibitor cocktail [Roche]). After 40 min rocking at 4°C, lysates were clarified by centrifugation and incubated for 4h with GFP-TrapA beads (ChromoTek). Beads were then washed with lysis buffer prior to elution of bound protein by boiling in Laemmli buffer, or isolation of RNA using TRIzol (Invitrogen, Thermo Fisher Scientific). Samples were then subject to western blotting analysis of proteins isolated, or Reverse Transcription PCR (RT-PCR) analysis of bound mRNA. For RT-PCR, 10 μl of RNA was reverse-transcribed using Transcriptor First Strand cDNA Synthesis Kit (Roche Applied Science Mannheim). 1.3 μg of cDNA was used as template for PCR using Q5 High-Fidelity DNA polymerase (NEB Biolabs) and primers outlined above.
Immunofluorescence and Live Cell Imaging
For fixed imaging, NHDFs expressing RACK1-eGFP were infected at MOI 3 for 20h. Cultures were then rinsed in PBS and fixed in 4% paraformaldehyde for 20 min. After washing, samples were blocked in PBS containing 10%FBS/0.25% Saponin and then incubated at 4°C overnight with anti-RSP10 antibody diluted in PBS containing 10%FBS/0.025% Saponin. The following day, samples were washed in PBS containing 0.025% Saponin and incubated with Alexa Fluor-conjugated anti-mouse secondary antibody (Thermo Fisher Scientific) for 1h at room temperature. After washing, samples were stained with Hoechst 33342, followed by washing and mounting in FluorSave Reagent (Calbiochem). For experiments involving B1-mCherry, cells were infected and processed as described above except to compensate for low-level B1 expression fixed samples were stained with anti-mCherry/RFP and anti-GFP antibodies to enhance signals (Chromotek). For experiments examining the effects of PMA on VF formation, cells were infected in the presence of DMSO or 50nM PMA and processed as described above, staining with anti-I3 antiserum. Images were acquired using a Leica DMI6000B microscope using a 100× objective (HC PL APO 100×/1.44NA OIL), ORCA FLASH 4.0 cMOS camera and Metamorph software. All sample sets were imaged using the same acquisition settings, and all post-acquisition processing was minimized and applied equally throughout samples using Metamorph software. For live cell imaging, NHDFs expressing RACK1-eGFP and Cro-mCherry were seeded on 35mm MatTek glass-bottom dishes (P35G-1.5-14-C) and infected with VacV at MOI 10. For imaging, culture medium was changed to CO2-independent medium (Gibco, 18045-088) and cultures were transferred to a Leica DMI6000B-AFC microscope with an InVivo environmental chamber at 37°C. Images were acquired approximately 20h.p.i. at the indicated frame rate with intermittent fast filter switching, using a 100× objective (HC PL APO 100×/1.44NA OIL) and an ORCA FLASH 4.0 cMOS camera with Metamorph software.
Sucrose gradient centrifugation
For polysome analysis NHDF were treated for 10 min with 100µg/ml cycloheximide to freeze ribosomes, washed with ice-cold PBS containing cycloheximide and then scraped into ice-cold 1X lysis buffer (1% triton 100u/ml RNase inhibitor, Complete EDTA-free protease inhibitor tablet, 20 mM Tris-Cl pH 7.5, 10 mM MgCl2, 100 mM potassium acetate, 1 mM DTT, 100μg/ml cycloheximide). Cells were lysed for 30 min. Lysates were clarified by spinning at 10,000 ×g for 10 min before layering on top of 10ml of 5–50% sucrose gradient made in 1X polysome buffer (20 mM Tris-Cl pH 7.5, 10 mM MgCl2, 100 mM potassium acetate, 1 mM DTT, 100μg/ml Cycloheximide) and centrifuged in Beckman Coulter SW 41-Ti rotor (Beckman Coulter, Inc., Brea, CA, USA) at 41,000 rpm, 4°C for 2h. Following centrifugation, sucrose gradients were fractionated using an automated Density Gradient Fractionation System (Brandel Biomedical Research & Development Laboratories, Inc.) with continuous monitoring at 254 nm using an UA-6 absorbance detector and recorded using PeakChart Software. For Western blot analysis, fractions were TCA precipitated as follows: samples were incubated at 4 °C overnight in Trichloroacetic Acid (TCA) at a final concentration of 10%. Samples were then centrifuged at 10,000 ×g for 15 min. Pellets were washed in a 1:4 solution of 1X polysome buffer:acetone followed by centrifugation at 10,000 ×g for 15 min. Supernatants were removed and protein pellets were air dried. Pellets were suspended in 1X Laemmli buffer and boiled for 3 min.
Isolation of RACK1 complexes and Mass Spectrometry
For Mass Spectrometry analysis, eGFP or RACK1-eGFP were isolated from soluble cell lysates as follows. 4 × 30cm dishes were seeded with NHDFs stably expressing RACK1-eGFP or eGFP control. Cells were mock infected or infected with VacV at MOI 10 for 20h. Cells were then washed with ice cold PBS and scraped into lysis buffer (50 mM HEPES pH 7.4, 150 mM NaCl. 0.5 mM MgCl2, 2 mM EDTA, 2 mM Na3VO4, 25 mM glycerophosphate, 1.5% NP-40 and complete mini EDTA-free protease inhibitor cocktail [Roche]). After incubation at 4°C with continuous rocking for 40 min, lysates were clarified by centrifugation and incubated for 2–4h with sepharose resin covalently conjugated to GFP-binding protein41. Samples were then extensively washed prior to boil-elution followed by TCA precipitation. Precipitated protein pellets were solubilized in 100 μl of 8M Urea for 30 minutes and then 100 μl of 0.2% ProteaseMAX (Promega, Madison, WI, USA) was added for 2h. Protein extracts were reduced and alkylated as previously described42, followed by the addition of 300 μl 50 mM ammonium bicarbonate, 5 μl 1% ProteaseMAX and 0.5μg sequence-grade trypsin (Promega). Samples were digested overnight in a 37° C thermomixer (Eppendorf).
For Orbitrap Fusion Tribrid MS analysis, the tryptic peptides were purified with Pierce C18 spin columns (Thermo Scientific). Three micrograms of peptide was auto-sampler loaded with a Thermo EASY nLC 1000 UPLC pump onto a vented Acclaim Pepmap 100, 75um by 2cm, nanoViper trap column coupled to a nanoViper analytical column (Thermo- 164570, 3 µm, 100 Å, C18, 0.075 mm, 500 mm) with stainless steel emitter tip assembled on the Nanospray Flex Ion Source with a spray voltage of 2000 V. Buffer A contained 94.785 % H2O with 5 % ACN and 0.125 % formic acid (FA), and buffer B contained 99.875 % Acetonitrile (ACN) with 0.125 % FA. The chromatographic run was for 4 hours in total with the following profile: 0–7 % over 7 minutes, ramp to 10 % over 6 minutes, ramp to 25 % over 160 minutes, ramp to 33 % over 40 minutes, ramp to 50 % over 7 minutes, ramp to 95 % for 5 minutes and stay at 95 % for 15 additional minutes. Additional MS parameters include: Ion transfer tube temp to 300 °C, Easy-IC internal mass calibration, the default charge state was set to 2 and cycle time was set to 3 seconds. Detector type set to Orbitrap, with 60,000 resolution, with wide quad isolation, mass range was set to normal, scan range was set to 300–1500 (m/z), max injection time was set to 50 ms, AGC target was set to 200,000, microscans was set to 1, S-lens RF level was set to 60, without source fragmentation, and datatype was set to positive and centroid. Monoisotopic precursor selection was set as on, included charge states equal to 2–6 (and reject unassigned). Dynamic exclusion enabled and set to 1 for 30 seconds and 45 second exclusion duration at 10 ppm for high and low. Precursor selection decision was set to most intense, top 20, isolation window was set to 1.6, scan range was set to auto normal, first mass was set to 110, collision energy was set to 30 %. For CID, we used the ion trap (IT) detector, IT resolution was set to 30K, IT scan rate was set to rapid, max injection time was set to 75 ms, AGC target was set to 10,000, and Q was set to 0.25, finally we injected ions for all available parallelizable time.
Spectrum raw files were extracted into ms1 and ms2 files using in-house program RawXtractor or RawConverter (http://fields.scripps.edu/downloads.php)43, and the tandem mass spectra were searched against UniProt human database (downloaded on 03-27-2015) (The UniProt Consortium 2015) and matched to sequences using the ProLuCID databse search program (ProLuCID ver. 3.1)44–46.ProLuCID searches were done on an Intel Xeon cluster running under the Linux operating system. The search space included all fully and half-tryptic peptide candidates that fell within the mass tolerance window with no miscleavage constraint. Carbamidomethylation (+57.02146 Da) of cysteine was considered as a static modification and a differential modification of 79.9663 on serine, threonine, or tyrosine. The validity of peptide / spectrum matches (PSMs) was assessed in DTASelect2 (using two SEQUEST-defined parameters, the cross-correlation score (XCorr), and normalized difference in cross-correlation scores (DeltaCN) 47–49. The search results were grouped by charge state (+1, +2, +3, and greater than +3) and tryptic status (fully tryptic, half-tryptic, and nontryptic), resulting in 12 distinct subgroups. In each of these subgroups, the distribution of Xcorr, DeltaCN, and DeltaMass values for (a) direct and (b) decoy database PSMs was obtained; then the direct and decoy subsets were separated by discriminant analysis. Full separation of the direct and decoy PSM subsets is not generally possible; therefore, peptide match probabilities were calculated based on a nonparametric fit of the direct and decoy score distributions. A peptide confidence of 0.95 was set as the minimum threshold. The FDR was calculated as the percentage of reverse decoy PSMs among all the PSMs that passed the confidence threshold. Each protein identified was required to have a minimum of one half-tryptic peptide; however, this peptide had to be an excellent match with an FDR less than 0.001 which represents at least one excellent peptide match. After this last filtering step, protein FDRs were below 1% for each sample analysis based on decoy hits. To quantitatively assess the confidence of the phosphorylated peptides we used the probability-based protein phosphorylation analysis and site localization algorithm Ascore 50. All mass spectrometry files can be found in the public data repository MassIVE: http://massive.ucsd.edu/ProteoSAFe/dataset.jsp?task=70c7c763026d4eadb102b21a9afef755 and ftp://massive.ucsd.edu/MSV000080661
Statistical Analysis
Statistical analyses were performed using one-way analysis of variance (ANOVA) followed by Tukey HSD test for post-hoc comparisons of three or more experimental groups (only when ANOVA was significant). This was done using online tools available at http://astatsa.com/OneWay_Anova_with_TukeyHSD. The p-value for all cases was set to <0.01 for significant difference. Two-tailed T-test was also used for testing significance between two groups. The p-value for all cases was set to <0.05 for significant difference.
Structure Modeling and Phylogenetic Analysis
RACK1 sequence alignment was done using Clustal omega program and further processed using ESPript 3.051. All conserved residues are highlighted in black and similar residues are bold. Human RACK1 (PDB: 4AOW) structure was used to generate structural data presented on top of the alignment. Alignment was done between RACK1 from Homo sapiens (UniProt ID: P63244), Saccharomyces cerevisiae (UniProt ID: P38011), Arabidopsis thaliana (UniProt ID: P68040), Nicotiana tabacum (UniProt ID: P49026), Caenorhabditis elegans (UniProt ID: Q21215), Mus musculus (UniProt ID: P68040), Drosophila melanogaster (UniProt ID: O18640).
The structure of A. thaliana RACK1A (PDB: 3DM0) were overlayed on the 80S Mammalian ribosome (PDB: 4UG0). The loop between blade 6 and 7 was highlighted in figures. A. thaliana RACK1 was modeled using Modeller 9.1652 using human RACK1 (PDB: 4AOW) as template. Modeling was done because the loop between blade 6 and 7 in the A. thaliana RACK1A (PDB: 3DM0) crystal structure was disordered. All coordinates were retrieved from protein data bank (PDB) (www.rcsb.org) and visualized by Swiss-Pdb Viewer v4.153.
Extended Data
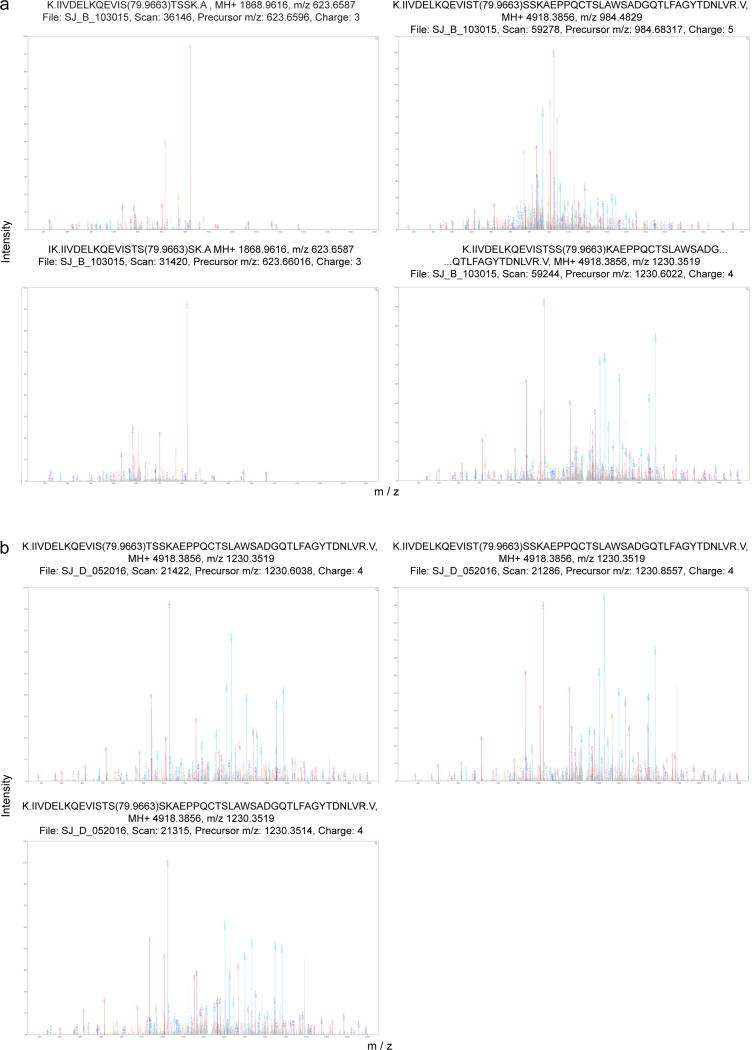
Extended Data Figure 1. Annotated MS/MS Spectra for RACK1 modifications detected in VacV-infected or B1-mCherry expressing NHDFs.
a, Fully annotated MS / MS spectra including scan and charge state of indicated RACK1 peptides from VacV-infected cells. b, Fully annotated MS / MS spectra including scan and charge state of indicated RACK1 peptides from B1-mCherry-expressing cells. MS analysis represents 2 replicates for a, one for b.
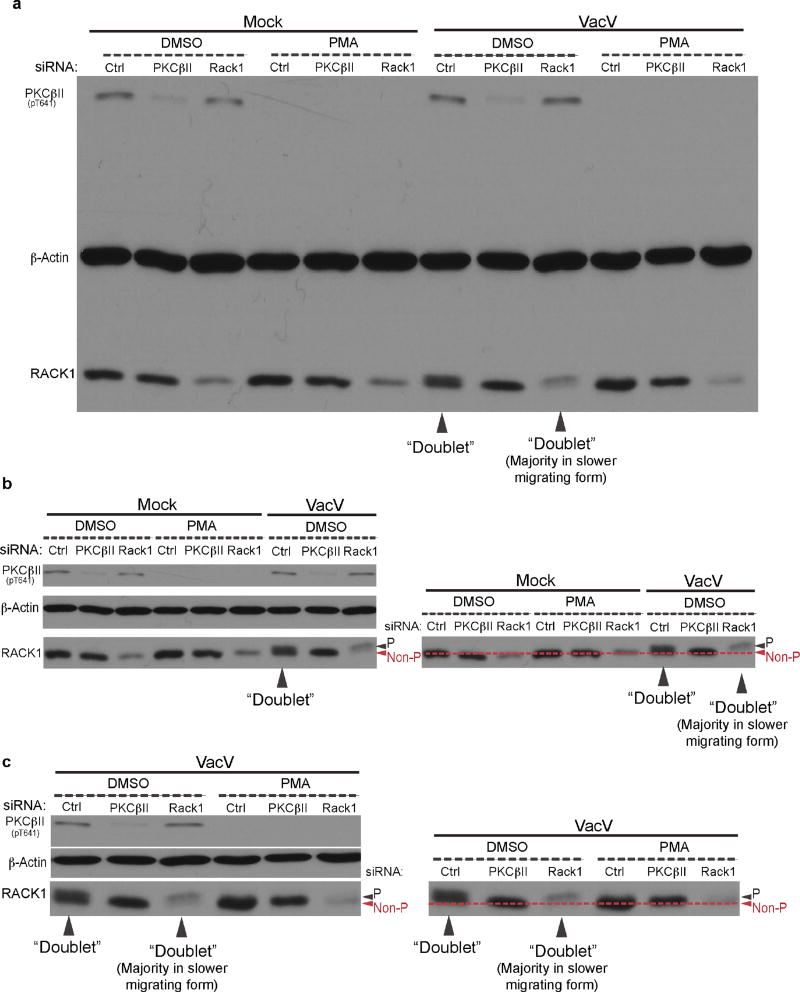
Extended Data Figure 2. PKCβII inhibition suppresses RACK1 modification.
a, Effects of RACK1 or PKCβII depletion, or PKCβII inhibition using phorbol 12-myristate 13-acetate (PMA) on the formation of RACK1 doublets and RACK1 mobility in uninfected or VacV-infected NHDFs. Doublets and migration shifts to majority of RACK1 in the slower-migrating form are indicated. b–c, To compensate for natural “bowing” in the outer lanes in SDS-PAGE gels when analyzing multiple samples, portions of the uncropped blot in a. are aligned to illustrate the presence of doublets and the migration of phosphorylated (P) and non-phosphorylated (non-P) species of RACK1 under each condition. Data is representative of 3 independent replicates. For raw gel data see Supplementary Fig. 1.
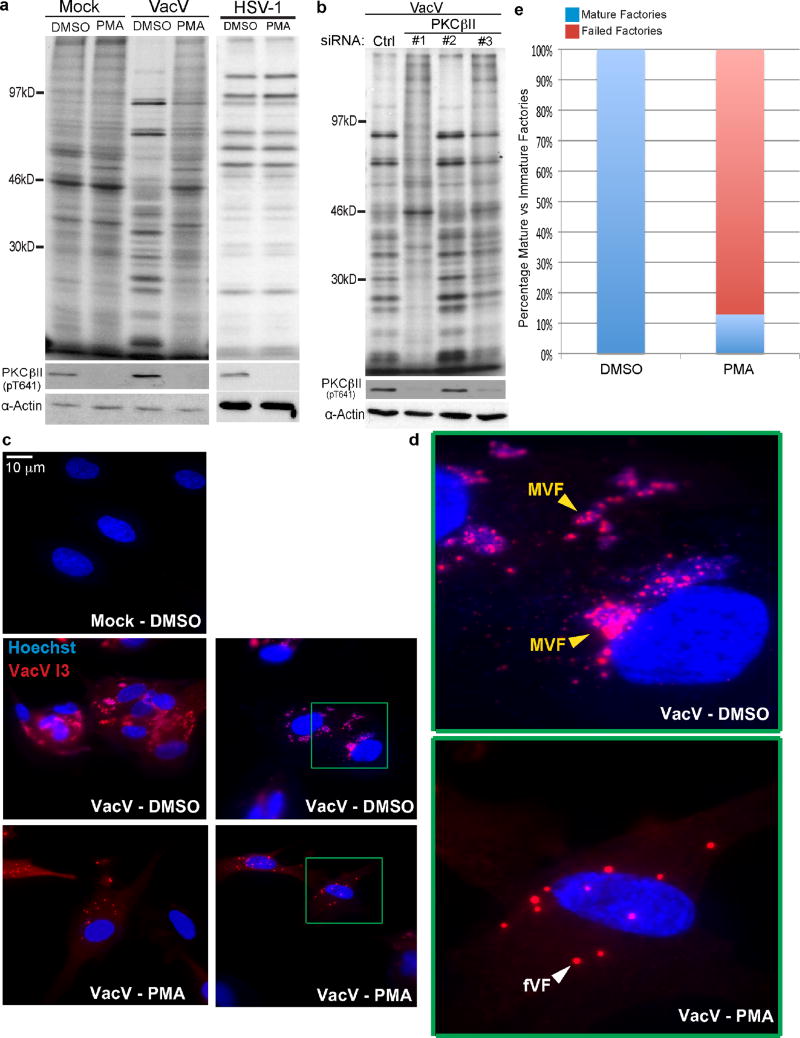
Extended Data Figure 3. PKCβII inhibition prevents host shut-off and formation of viral factories associated with late stages of VacV infection.
a, Inhibition of PKCβII using 50nM PMA reduces rates of late viral protein synthesis and prevents the inhibition of host translation (host shut-off) associated with late stages of VacV infection. PMA does not affect HSV-1. b, Depletion of PKCβII using three independent siRNAs results in a dose-dependent effect on the inhibition of host shut-off and the rates of late viral protein synthesis. c, Representative images of the effects of PMA treatment on viral factory formation relative to DMSO solvent controls. Fixed samples were stained with Hoechst to detect nuclei and viral factories, and anti-I3 antibody. d, Zoomed regions highlighted in c. Mature viral factories (MVFs) stain intensely for DNA and I3. Failed viral factories (fVFs) exhibit punctate staining for I3, characteristic of early VFs but do not stain strongly for DNA. e, The percentage of mature and failed VFs in cells treated with DMSO solvent control or PMA. n > 45 viral factories per condition. Note: Although small I3 puncta are seen in DMSO-treated cells, these stain strongly for DNA unlike PMA-treated samples. These may represent new factories forming, or fragments of growing factories but failed factories could not be detected. All data represents 3 or more replicates. For raw gel data see Supplementary Fig. 1.
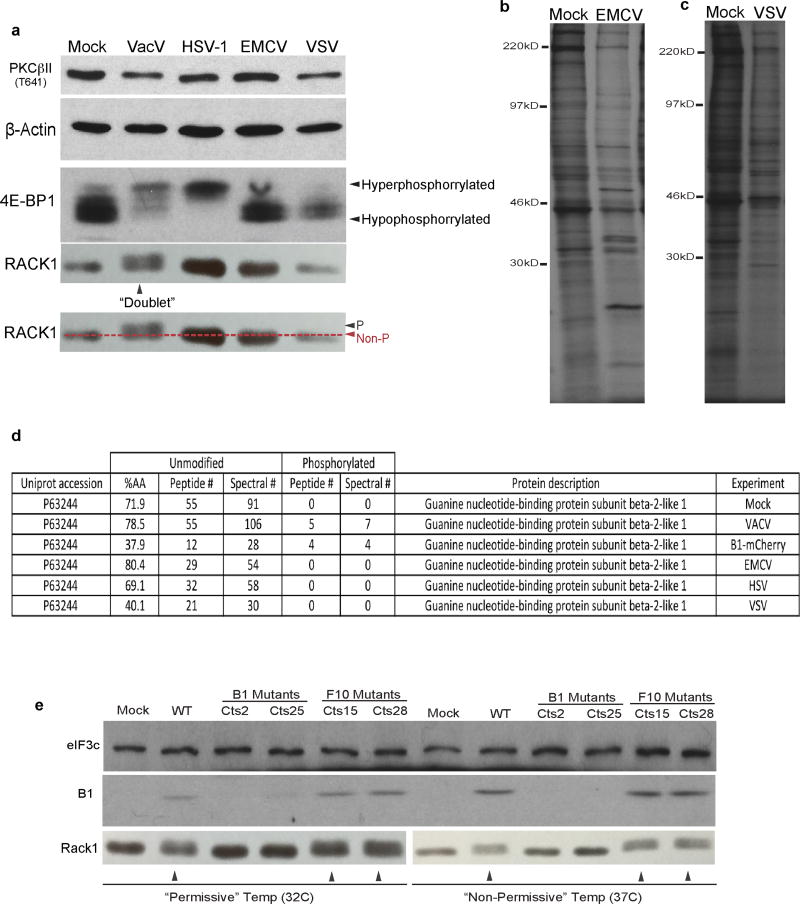
Extended Data Figure 4. RACK1 is not modified by other viruses, and its modification in VacV-infected cells is dependent upon the viral B1 kinase.
a–d. RACK1 is not modified in uninfected cells, or cells infected by other DNA or RNA viruses. a, RACK1 doublets are only detectable in NHDFs infected with VacV, but not in uninfected cells or cells infected with HSV-1, Encephalomyocarditis Virus (EMCV) or Vesicular Stomatitis Virus (VSV). Mobility shifts in 4E-BP1 indicative of hypo- or hyper-phosphorylation illustrate expected mTOR activation upon VacV or HSV-1 infection, and mTOR suppression by EMCV or VSV. b–c, Patterns of protein synthesis further confirm that samples analyzed in a, were infected with b, EMCV or c, VSV. d, Summary table displaying MS/MS results of unmodified and phosphorylated peptides of RACK1 from uninfected NHDFs, NHDFs infected with the indicated viruses, or B1-mCherry expressing NHDFs. %AA = percentage of amino acids detected, peptide # = number of peptides identified, spectral # = number of MS/MS spectral counts. In all analysis the protein FDR ≤ 1% based on the target decoy strategy. e, B1 mutants fail to form RACK1 doublets at permissive and non-permissive temperatures. Western blot analysis showing that B1 mutants do not produce B1 protein at either permissive (32°C) or non-permissive (37°C) temperatures. In line with unique B1 substrates not complemented by host kinases, RACK1 doublets (arrows) are not detected at either temperature. Notably, the extent of doublet formation correlates with B1 expression levels. At 32°C WT virus produces less B1 than at 37°C, modifying RACK1 to a lesser extent. F10 mutants produce more B1 than WT virus at 32°C and modify RACK1 more efficiently. This suggests F10 has the potential to negatively regulate B1, in line with results from luciferase assays in Figure 3e. Data represents 3 or more replicates, except d., MS represents 2 replicates. For raw gel data see Supplementary Fig. 1.
Extended Data Figure 5. B1-mCherry localizes to viral factories along with RACK1.
a, Immunofluorescence analysis of cells expressing B1-mCherry and RACK1-eGFP, either mock infected or infected with VacV. Hochest was used to stain DNA. Zoomed images of orange boxed region are presented in lower panels. iVF = immature viral factory. mVF = mature viral factory with cavities formed. Nuc = nucleus. b–c, additional examples of B1 and RACK1 localization in different immature and mature factories. Data represents 3 independent experiments.
Extended Data Figure 6. RACK1 localization to viral factories in living cells.
a, eGFP alone localizes to both nuclei and the cytoplasm, with no notable localization to viral factories (yellow arrows). b–e Still images from movies 1–9, highlighting the dynamic behavior of RACK1 within viral factories. b, Still image from Video 1 showing immature viral factories (iVFs) that lack RACK1 accumulation, and a mature viral factory (mVF) with large cavity filled with RACK1. In some cells, what appear to be old viral factories (oVFs) or golgi structures that do not stain strongly for active DNA synthesis using cro-mCherry and appear disorganized can also be seen. c, Still images from Videos 2–3 showing smaller, immature viral factories (iVF) in which a cavities form and fill with RACK1. In larger mature factories (mVF), cavities dynamically grow and change shape, but retain RACK1. d, Still images from moves 4–5, showing additional examples of mVFs with peripheral and cavity accumulations of RACK1. e, Still images from movies 6–9 showing zoomed viral factories and the dynamic behavior of RACK1 within viral cavities (yellow arrows). This includes the formation of new cavities, which is accompanied by the appearance of RACK1 at these sites. Data represents 3 independent experiments.
Extended Data Figure 7. VacV infection does not alter RACK1 interactions with ribosomal proteins or PABP isoforms.
a, Table summarizing ribosomal and polyA-binding protein interactions identified by LC-MS/MS proteomic analysis of uninfected or VacV-infected NHDFs expressing RACK1-eGFP or eGFP. Samples sets are: #1 Uninfected NHDFs expressing RACK1-eGFP. #2 VacV-infected NHDFs expressing RACK1-eGFP. #3 VacV-infected NHDFs expressing eGFP. Yellow = 40S ribosomal subunits; Green = 60S ribosomal subunits; Blue = PABP isoforms. b, To validate results obtained from LC-MS/MS analysis in a., NHDFs expressing eGFP or RACK1-eGFP were either mock infected or infected with VacV. eGFP or eGFP-RACK1 complexes were isolated from soluble cell extracts and analyzed by western blotting with the indicated antibodies. In line with LC-MS/MS analysis, the association of RACK1 with representative large and small ribosomal subunits was unaffected by infection. Demonstrating specificity, β-actin was not recovered in eGFP or eGFP-RACK1 complexes. c, To determine if modified RACK1 associates with ribosomes, NHDFs were treated with RACK1 siRNA and infected with VacV. Under these conditions all remaining RACK1 in VacV-infected cells is in the modified state (Fig. 1c, f). Free, 40S, 60S, 80S and polysome fractions from VacV-infected NHDFs showing RACK1 is only detected in ribosomal fractions and is not present in free fractions. All data represents 3 independent replicates, except a., MS represents 2 replicates. For raw gel data see Supplementary Fig. 1.
Extended Data Figure 8. RACK1 colocalizes with RPS10 within viral factories.
Mock or infected samples were fixed and stained for RPS10, along with Hoechst to detect nuclei and viral factories (VFs). RACK1-eGFP around and within cavities of VFs colocalized with RPS10, a validated interacting partner of RACK1 in Extended Data Figure 7a, b. Data represents 3 independent experiments.
Extended Data Figure 9. Analysis of reporter RNA levels and phylogenetic comparison of RACK1 from different species.
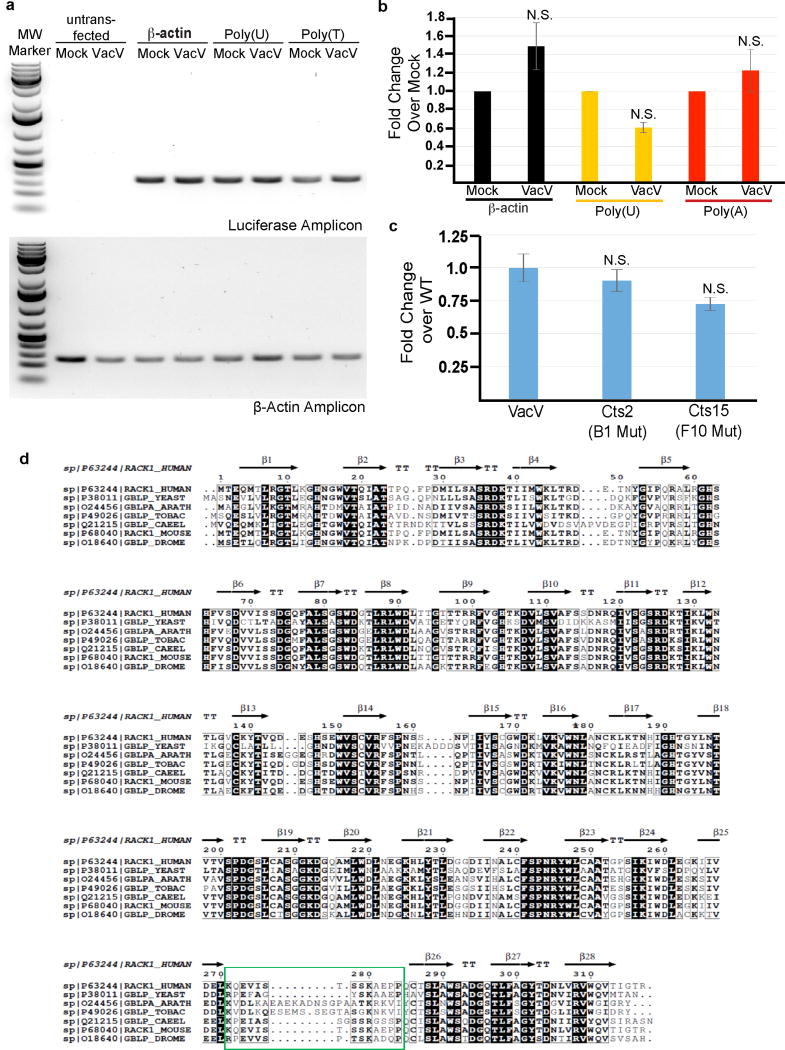
a–c. Luciferase reporters RNA levels are not significantly affected by VacV infection and do not correlate with enhancer effects. a, Agarose gels showing the specificity of primers used to detect Luciferase and β-actin mRNAs in samples. b, quantitative real-time PCR analysis of RNA levels represented as fold-change in infected samples over mock-infected samples. Minimal changes in RNA abundance are detected in infected cells and do not correlate with enhancer selectivity towards polyA-leaders. Statistical analysis demonstrated no significant differences in RNA abundance between mock vs infected. Bars represent s.e.m. n= 3/group. β-actin-luc p value = 0.176376, poly U-luc p value = 0.194325, poly A-luc group p value = 0.765344. *p < 0.05; two tailed t-test. c, B1 or F10 mutants do not alter polyA-luciferase RNA levels relative to wildtype infection in a manner that would explain their differential effects on polyA-enhancer function. Data shows quantitative real-time PCR analysis of RNA levels represented as fold-change in Cts mutant infected samples over WT VacV infected samples. Error bars represent standard error of the mean. Statistical analysis demonstrated no significant differences in RNA abundance (One-way ANOVA, n = 3/group, F2,6 = 0.0766, p value = 0.9271. *p value < 0.05 relative to WT VacV). Post-hoc analysis was performed between WT and B1 mutant; p-value 0.8999947, WT VacV and F10 mutant; p value 0.899994. In all groups p >0.05 relative to WT VacV further confirming that the mutant viral infection does not affect the abundance of PolyA-luciferase RNA. d, Phylogenetic comparisons reveal variability in charge and structure in the RACK1 loop that is modified by VacV. RACK1 is highly conserved with the notable exception of the extended loop highlighted by the green box. See also Fig. 4b. β = beta sheets. For raw data see Supplementary Fig. 1 and 2.
Extended Data Figure 10. Negative charge in the RACK1 loop confers a selective advantage to 5’PolyA-RNAs.
a, Recovery of β-actin and 5’polyA-luciferase RNAs associated with WT or loop mutant forms of RACK1-eGFP in reporter-expressing cells. RACK1 phosphomimetics or the plant loop chimera select against β-actin but not polyA-luciferase RNAs, recapitulating the selective advantage for viral RNAs observed in infected cells when the RACK1 loop is phosphorylated. Similar to viral RNAs, the STSS-EEEE mutant retains selectivity against β-actin RNA but with suboptimal association with 5’polyA-luciferase RNA. This assay also enabled examination of 5’polyA-RNA recovery in an uninfected context, and demonstrated that 5’polyA-RNA also efficiently associates with WT RACK1 complexes. This provides further support for the overall model whereby VacV customizes host ribosomes to regulate sliding on its unusual 5’polyA RNAs, but in doing so simultaneously suppresses translation of canonical host RNAs as illustrated in b. Data represents 3 independent experiments. For raw gel data see Supplementary Fig. 1. b, Model for ribosome customization by VacV-induced modifications to the RACK1 loop. Left panel: The translation system in uninfected cells is optimized for efficient β-actin RNA translation. This involves binding, scanning, efficient AUG recognition and formation of 80S ribosomes that translate the open reading frame (ORF). Upon VacV-mediated phosphorylation of RACK1 (or in cells expressing RACK1 phosphomimetics or the plant loop chimera), the canonical host initiation process is suppressed, reducing RNA recovery. Right panel: In uninfected cells non-canonical 5’polyA-RNAs are efficiently loaded with 40S subunits. However, sliding (arrows) reduces the efficiency of AUG recognition, with 40S subunits frequently scanning past the start site rather than assembling 80S subunits to initiate translation of the ORF. As such, these unusual RNAs will associate with WT RACK1 despite the fact that their translation is sub-optimal. Upon VacV infection (or in cells expressing RACK1 phosphomimetics or the plant loop chimera) negative charge in the RACK1 loop off-sets sliding, generating an optimized scanning and AUG recognition process for 5’polyA-RNAs. Under modified RACK1 conditions where 5’polyA-RNAs are initiating efficiently, excessive charge clustering (STSS-EEEE mutant) is suboptimal and is evident in reduced 5’polyA or viral RNA recovery.
Supplementary Material
Acknowledgments
This work was supported by grants from the National Institutes of Health (NIH) R01AI127456 and R21AI105330 to D.W., R00DC013805 to J.N.S., R01AI099506 to P.S., and Catalyst Award C-068 from the Chicago Biomedical Consortium to J.N.S. M.G.R. was supported by training grant T32 GM008061. We thank Grant McFadden, Richard Condit, Paula Traktman, David Evans and Yan Xiang for reagents.
Footnotes
Author Contributions:
S.J. and M.G.R. generated RACK1 mutants, performed knockout and knockdown experiments, and isolation and analysis of GFP complexes. G.F. and P.S. generated RACK1 knockouts. S.J. and D.J.P. performed and analyzed luciferase assays and imaging. K.C. and E.A.H. prepared samples and performed MS, and analyzed data. J.N.S. analyzed and prepared MS figures. D.W. designed and analyzed experiments. D.W. wrote the manuscript, S.J., G.F. J.N.S. and P.S. edited the manuscript.
The authors declare no competing financial interests.
Data Availability
All data generated or analyzed during this study are included in this published article (and its supplementary information files).
References
- 1.Shi Z, Barna M. Translating the genome in time and space: specialized ribosomes, RNA regulons, and RNA-binding proteins. Annu Rev Cell Dev Biol. 2015;31:31–54. doi: 10.1146/annurev-cellbio-100814-125346. [DOI] [PubMed] [Google Scholar]
- 2.Kondrashov N, et al. Ribosome-mediated specificity in Hox mRNA translation and vertebrate tissue patterning. Cell. 2011;145:383–397. doi: 10.1016/j.cell.2011.03.028. [DOI] [PMC free article] [PubMed] [Google Scholar]
- 3.Xue S, et al. RNA regulons in Hox 5' UTRs confer ribosome specificity to gene regulation. Nature. 2015;517:33–38. doi: 10.1038/nature14010. [DOI] [PMC free article] [PubMed] [Google Scholar]
- 4.Moss B. In: Fields virology. Knipe DM, Howley PM, editors. Lippincott Williams & Wilkins; 2007. pp. 2849–2883. [Google Scholar]
- 5.Jan E, Mohr I, Walsh D. A Cap-to-Tail Guide to mRNA Translation Strategies in Virus-Infected Cells. Annu Rev Virol. 2016 doi: 10.1146/annurev-virology-100114-055014. [DOI] [PubMed] [Google Scholar]
- 6.Cherry S, et al. Genome-wide RNAi screen reveals a specific sensitivity of IRES-containing RNA viruses to host translation inhibition. Genes Dev. 2005;19:445–452. doi: 10.1101/gad.1267905. [DOI] [PMC free article] [PubMed] [Google Scholar]
- 7.Sengupta J, et al. Identification of the versatile scaffold protein RACK1 on the eukaryotic ribosome by cryo-EM. Nat Struct Mol Biol. 2004;11:957–962. doi: 10.1038/nsmb822. [DOI] [PubMed] [Google Scholar]
- 8.Rabl J, Leibundgut M, Ataide SF, Haag A, Ban N. Crystal structure of the eukaryotic 40S ribosomal subunit in complex with initiation factor 1. Science. 2011;331:730–736. doi: 10.1126/science.1198308. [DOI] [PubMed] [Google Scholar]
- 9.Taylor DJ, et al. Comprehensive molecular structure of the eukaryotic ribosome. Structure. 2009;17:1591–1604. doi: 10.1016/j.str.2009.09.015. [DOI] [PMC free article] [PubMed] [Google Scholar]
- 10.Link AJ, et al. Direct analysis of protein complexes using mass spectrometry. Nat Biotechnol. 1999;17:676–682. doi: 10.1038/10890. [DOI] [PubMed] [Google Scholar]
- 11.Majzoub K, et al. RACK1 controls IRES-mediated translation of viruses. Cell. 2014;159:1086–1095. doi: 10.1016/j.cell.2014.10.041. [DOI] [PMC free article] [PubMed] [Google Scholar]
- 12.Ceci M, et al. Release of eIF6 (p27BBP) from the 60S subunit allows 80S ribosome assembly. Nature. 2003;426:579–584. doi: 10.1038/nature02160. [DOI] [PubMed] [Google Scholar]
- 13.Thompson MK, Rojas-Duran MF, Gangaramani P, Gilbert WV. The ribosomal protein Asc1/RACK1 is required for efficient translation of short mRNAs. Elife. 2016;5 doi: 10.7554/eLife.11154. [DOI] [PMC free article] [PubMed] [Google Scholar]
- 14.Schmitt K, et al. Asc1p/RACK1 connects ribosomes to eukaryotic phospho-signaling. Mol Cell Biol. 2016 doi: 10.1128/MCB.00279-16. [DOI] [PMC free article] [PubMed] [Google Scholar]
- 15.Rempel RE, Traktman P. Vaccinia virus B1 kinase: phenotypic analysis of temperature-sensitive mutants and enzymatic characterization of recombinant proteins. J Virol. 1992;66:4413–4426. doi: 10.1128/jvi.66.7.4413-4426.1992. [DOI] [PMC free article] [PubMed] [Google Scholar]
- 16.Punjabi A, Traktman P. Cell biological and functional characterization of the vaccinia virus F10 kinase: implications for the mechanism of virion morphogenesis. J Virol. 2005;79:2171–2190. doi: 10.1128/JVI.79.4.2171-2190.2005. [DOI] [PMC free article] [PubMed] [Google Scholar]
- 17.Boyle KA, Traktman P. Members of a novel family of mammalian protein kinases complement the DNA-negative phenotype of a vaccinia virus ts mutant defective in the B1 kinase. J Virol. 2004;78:1992–2005. doi: 10.1128/JVI.78.4.1992-2005.2004. [DOI] [PMC free article] [PubMed] [Google Scholar]
- 18.Wiebe MS, Traktman P. Poxviral B1 kinase overcomes barrier to autointegration factor, a host defense against virus replication. Cell Host Microbe. 2007;1:187–197. doi: 10.1016/j.chom.2007.03.007. [DOI] [PMC free article] [PubMed] [Google Scholar]
- 19.Lin YC, Evans DH. Vaccinia virus particles mix inefficiently, and in a way that would restrict viral recombination, in coinfected cells. J Virol. 2010;84:2432–2443. doi: 10.1128/JVI.01998-09. [DOI] [PMC free article] [PubMed] [Google Scholar]
- 20.Katsafanas GC, Moss B. Colocalization of transcription and translation within cytoplasmic poxvirus factories coordinates viral expression and subjugates host functions. Cell Host Microbe. 2007;2:221–228. doi: 10.1016/j.chom.2007.08.005. [DOI] [PMC free article] [PubMed] [Google Scholar]
- 21.Warner JR, McIntosh KB. How common are extraribosomal functions of ribosomal proteins? Mol Cell. 2009;34:3–11. doi: 10.1016/j.molcel.2009.03.006. [DOI] [PMC free article] [PubMed] [Google Scholar]
- 22.Gerbasi VR, Weaver CM, Hill S, Friedman DB, Link AJ. Yeast Asc1p and mammalian RACK1 are functionally orthologous core 40S ribosomal proteins that repress gene expression. Mol Cell Biol. 2004;24:8276–8287. doi: 10.1128/MCB.24.18.8276-8287.2004. [DOI] [PMC free article] [PubMed] [Google Scholar]
- 23.Coyle SM, Gilbert WV, Doudna JA. Direct link between RACK1 function and localization at the ribosome in vivo. Mol Cell Biol. 2009;29:1626–1634. doi: 10.1128/MCB.01718-08. [DOI] [PMC free article] [PubMed] [Google Scholar]
- 24.Wolf AS, Grayhack EJ. Asc1, homolog of human RACK1, prevents frameshifting in yeast by ribosomes stalled at CGA codon repeats. RNA. 2015;21:935–945. doi: 10.1261/rna.049080.114. [DOI] [PMC free article] [PubMed] [Google Scholar]
- 25.Arthur L, et al. Translational control by lysine-encoding A-rich sequences. Sci Adv. 2015;1 doi: 10.1126/sciadv.1500154. [DOI] [PMC free article] [PubMed] [Google Scholar]
- 26.Koutmou KS, et al. Ribosomes slide on lysine-encoding homopolymeric A stretches. Elife. 2015;4 doi: 10.7554/eLife.05534. [DOI] [PMC free article] [PubMed] [Google Scholar]
- 27.Shirokikh NE, Spirin AS. Poly(A) leader of eukaryotic mRNA bypasses the dependence of translation on initiation factors. Proc Natl Acad Sci U S A. 2008;105:10738–10743. doi: 10.1073/pnas.0804940105. [DOI] [PMC free article] [PubMed] [Google Scholar]
- 28.Gallie DR, Sleat DE, Watts JW, Turner PC, Wilson TM. The 5'-leader sequence of tobacco mosaic virus RNA enhances the expression of foreign gene transcripts in vitro and in vivo. Nucleic Acids Res. 1987;15:3257–3273. doi: 10.1093/nar/15.8.3257. [DOI] [PMC free article] [PubMed] [Google Scholar]
- 29.Sleat DE, et al. Characterisation of the 5'-leader sequence of tobacco mosaic virus RNA as a general enhancer of translation in vitro. Gene. 1987;60:217–225. doi: 10.1016/0378-1119(87)90230-7. [DOI] [PubMed] [Google Scholar]
- 30.Gallie DR, Walbot V, Hershey JW. The ribosomal fraction mediates the translational enhancement associated with the 5'-leader of tobacco mosaic virus. Nucleic Acids Res. 1988;16:8675–8694. doi: 10.1093/nar/16.17.8675. [DOI] [PMC free article] [PubMed] [Google Scholar]
- 31.Walsh D, Mohr I. Phosphorylation of eIF4E by Mnk-1 enhances HSV-1 translation and replication in quiescent cells. Genes Dev. 2004;18:660–672. doi: 10.1101/gad.1185304. [DOI] [PMC free article] [PubMed] [Google Scholar]
- 32.Condit RC, Motyczka A, Spizz G. Isolation, characterization, and physical mapping of temperature-sensitive mutants of vaccinia virus. Virology. 1983;128:429–443. doi: 10.1016/0042-6822(83)90268-4. [DOI] [PubMed] [Google Scholar]
- 33.Walsh D, et al. Eukaryotic translation initiation factor 4F architectural alterations accompany translation initiation factor redistribution in poxvirus-infected cells. Mol Cell Biol. 2008;28:2648–2658. doi: 10.1128/MCB.01631-07. [DOI] [PMC free article] [PubMed] [Google Scholar]
- 34.Herdy B, et al. Translational control of the activation of transcription factor NF-kappaB and production of type I interferon by phosphorylation of the translation factor eIF4E. Nat Immunol. 2012;13:543–550. doi: 10.1038/ni.2291. [DOI] [PMC free article] [PubMed] [Google Scholar]
- 35.Carette JE, et al. Ebola virus entry requires the cholesterol transporter Niemann-Pick C1. Nature. 2011;477:340–343. doi: 10.1038/nature10348. [DOI] [PMC free article] [PubMed] [Google Scholar]
- 36.Marceau CD, et al. Genetic dissection of Flaviviridae host factors through genome-scale CRISPR screens. Nature. 2016;535:159–163. doi: 10.1038/nature18631. [DOI] [PMC free article] [PubMed] [Google Scholar]
- 37.Walsh D, Mohr I. Assembly of an active translation initiation factor complex by a viral protein. Genes Dev. 2006;20:461–472. doi: 10.1101/gad.1375006. [DOI] [PMC free article] [PubMed] [Google Scholar]
- 38.Cox EA, Bennin D, Doan AT, O'Toole T, Huttenlocher A. RACK1 regulates integrin-mediated adhesion, protrusion, and chemotactic cell migration via its Src-binding site. Mol Biol Cell. 2003;14:658–669. doi: 10.1091/mbc.E02-03-0142. [DOI] [PMC free article] [PubMed] [Google Scholar]
- 39.Gibson DG, et al. Enzymatic assembly of DNA molecules up to several hundred kilobases. Nat Methods. 2009;6:343–345. doi: 10.1038/nmeth.1318. [DOI] [PubMed] [Google Scholar]
- 40.Laemmli UK. Cleavage of structural proteins during the assembly of the head of bacteriophage T4. Nature. 1970;227:680–685. doi: 10.1038/227680a0. [DOI] [PubMed] [Google Scholar]
- 41.Malikov V, et al. HIV-1 capsids bind and exploit the kinesin-1 adaptor FEZ1 for inward movement to the nucleus. Nat Commun. 2015;6:6660. doi: 10.1038/ncomms7660. [DOI] [PMC free article] [PubMed] [Google Scholar]
- 42.Chen EI, McClatchy D, Park SK, Yates JR., 3rd Comparisons of mass spectrometry compatible surfactants for global analysis of the mammalian brain proteome. Anal Chem. 2008;80:8694–8701. doi: 10.1021/ac800606w. [DOI] [PMC free article] [PubMed] [Google Scholar]
- 43.He L, Diedrich J, Chu YY, Yates JR., 3rd Extracting Accurate Precursor Information for Tandem Mass Spectra by RawConverter. Anal Chem. 2015;87:11361–11367. doi: 10.1021/acs.analchem.5b02721. [DOI] [PMC free article] [PubMed] [Google Scholar]
- 44.Eng JK, McCormack AL, Yates JR. An approach to correlate tandem mass spectral data of peptides with amino acid sequences in a protein database. J Am Soc Mass Spectrom. 1994;5:976–989. doi: 10.1016/1044-0305(94)80016-2. [DOI] [PubMed] [Google Scholar]
- 45.Xu T, et al. ProLuCID: An improved SEQUEST-like algorithm with enhanced sensitivity and specificity. J Proteomics. 2015;129:16–24. doi: 10.1016/j.jprot.2015.07.001. [DOI] [PMC free article] [PubMed] [Google Scholar]
- 46.Xu T, et al. ProLuCID, a fast and sensitive tandem mass spectra-based protein identification program. Mol Cell Proteomics. 2006;759(5):S174. [Google Scholar]
- 47.Cociorva D, D LT, Yates JR. Validation of tandem mass spectrometry database search results using DTASelect. Curr Protoc Bioinformatics Chapter 13, Unit 13 14. 2007 doi: 10.1002/0471250953.bi1304s16. [DOI] [PubMed] [Google Scholar]
- 48.Tabb DL, McDonald WH, Yates JR., 3rd DTASelect and Contrast: tools for assembling and comparing protein identifications from shotgun proteomics. J Proteome Res. 2002;1:21–26. doi: 10.1021/pr015504q. [DOI] [PMC free article] [PubMed] [Google Scholar]
- 49.Eng JK, Mccormack AL, Yates JR. An Approach to Correlate Tandem Mass-Spectral Data of Peptides with Amino-Acid-Sequences in a Protein Database. J Am Soc Mass Spectr. 1994;5:976–989. doi: 10.1016/1044-0305(94)80016-2. [DOI] [PubMed] [Google Scholar]
- 50.Beausoleil SA, Villen J, Gerber SA, Rush J, Gygi SP. A probability-based approach for high-throughput protein phosphorylation analysis and site localization. Nat Biotechnol. 2006;24:1285–1292. doi: 10.1038/nbt1240. [DOI] [PubMed] [Google Scholar]
- 51.Robert X, Gouet P. Deciphering key features in protein structures with the new ENDscript server. Nucleic Acids Res. 2014;42:W320–324. doi: 10.1093/nar/gku316. [DOI] [PMC free article] [PubMed] [Google Scholar]
- 52.Sali A, Blundell TL. Comparative protein modelling by satisfaction of spatial restraints. J Mol Biol. 1993;234:779–815. doi: 10.1006/jmbi.1993.1626. [DOI] [PubMed] [Google Scholar]
- 53.Guex N, Peitsch MC. SWISS-MODEL and the Swiss-PdbViewer: an environment for comparative protein modeling. Electrophoresis. 1997;18:2714–2723. doi: 10.1002/elps.1150181505. [DOI] [PubMed] [Google Scholar]
Associated Data
This section collects any data citations, data availability statements, or supplementary materials included in this article.


