

Abstract
The aim of the present study was to examine the pharmacokinetics of a single intravenous injection (i.v.) and oral administration (p.o.) of diclofenac sodium (DIC) in Sprague-Dawley (SD) rats. Twelve male SD rats were divided into 2 groups (n=6 per group); one group was injected intravenously with 2 mg/kg DIC, whereas the other group was lavaged with 2 mg/kg DIC. Blood samples were collected prior to DIC delivery (0 h) and 0.033, 0.083, 0.167, 0.25, 0.5, 1, 2, 4, 6, and 8 h post-administration. Blood plasma samples were analyzed using liquid chromatography-mass spectrometry (LC-MS/MS) following pretreatment to induce protein precipitation. Pharmacokinetics software was applied to calculate relevant pharmacokinetic parameters using a non-compartmental model. Following i.v. administration of DIC, the terminal elimination rate constant (λz), apparent terminal elimination half-life (t½), area under the concentration-time curve from time 0 extrapolated to infinity (AUC0-∞), clearance (CL), apparent volume of distribution (Vz), mean residence time (MRT), and apparent volume of distribution at steady state (Vss) were 0.57±0.05 l/h, 1.22±0.11 h, 3356±238 h × ng/ml, 0.60±0.04 l/h, 1.05±0.10 l, 1.05±0.07 h and 0.63±0.07 l, respectively. Following p.o. administration of DIC, the λz, t½, Cmax, tmax, AUC0-∞, CL, Vz, MRT were: 0.63±0.12 l/h, 1.12±0.18 h, 1272±112 ng/ml, 0.19±0.04 h, 2501±303 h × ng/ml, 0.81±0.10 l/h, 1.29±0.12 l, and 2.70±0.18 h, respectively. The pharmacokinetic parameters of i.v. and p.o. DIC in rats show that the drug is rapidly absorbed, distributed, and eliminated.
Keywords: diclofenac sodium, rat, pharmacokinetics, intravenous injection, oral medication
Introduction
DIC is a non-steroidal anti-inflammatory drug advocated for use in painful and inflammatory rheumatic and certain non-rheumatic conditions. DIC is available in a number of administration forms that can be given orally, rectally, or intramuscularly (1). DIC is an inhibitor of cyclooxygenase, and its potency is substantially greater than that of indomethacin, naproxen, and several other agents (2–5). Despite the widespread clinical use of DIC for >20 years, there is little published information on its pharmacokinetics in animals, especially in rats. Variations in pharmacokinetic parameters between different animal species are common and mostly related to differences in genetics and/or environmental conditions (6).
The aim of the present study was to determine the pharmacokinetics profile of DIC in rats after intravenous injection (i.v.) and oral administration (p.o.).
Materials and methods
Drugs and reagents
DIC was purchased from Sigma-Aldrich Co., LLC (Shanghai, China) and served as a control. Naproxen was purchased from Sigma-Aldrich Co., LLC and used as an internal standard. Acetonitrile of HPLC grade was purchased from Merck Chemicals Co., Ltd. (Shanghai, China). Methanol of HPLC grade was purchased from Burdick and Jackson (Morristown, NJ, USA). Ammonium acetate of HPLC grade was purchased from Sigma-Aldrich Co., LLC. Ultrapure water was produced by a Milli-Q Advantage A10 purification system.
Instruments and equipment
The HPLC system was a Shimadzu LC-20AD (Shimadzu, Co., Ltd., Shanghai, China) system consisting of a degasser, a communication bus module, a pump, an autosampler, and a column oven. Mass spectrometric detection was accomplished with an Applied Biosystems Sciex API 3000 mass spectrometer (Applied Biosystems Sciex, Mississauga, ON, Canada) equipped with an electrospray ionization (ESI) source. Analytical software (version 1.4.2; Applied Biosystems/MDS Sciex) was used for data acquisition and processing. The following instruments were also used: WH-861 vortex shaker (Taicang HUALIDA Experimental equipment Co., Ltd., Taicang, China), high-speed refrigerated centrifuge (5810R; Eppendorf AG, Hamburg, Germany), analytical balance [XS205; Mettler-Toledo Instruments (Shanghai) Co., Ltd., Shanghai, China], and Milli-Q Advantage A10 purification system (Millipore Corp., Billerica, MA, USA). The chromatographic column was an Agilent Zorbax XDB-C18 (3.5 µm, 2.1×50 mm) column.
Experimental animals
Twelve male Sprague-Dawley (SD) rats weighing 231–257 g were purchased from the Laboratory Animal Center of the Zhejiang Academy of Medical Sciences (Hangzhou, China).
Experimental methods
Solution preparation
A suitable amount of DIC (1 g) was weighed and dissolved in physiological saline (Sinopharm Group Co. Ltd., Shanghai, China) to produce a 1 mg/ml solution that was used for intravenous and intragastric administration.
Drug delivery and sample collection
Before DIC administration, the rats were fasted for 12 h with access to drinking water. Six male SD rats were injected with 2 mg/kg DIC through the tail vein at a dosing volume of 2 ml/kg. Blood (1 ml) was taken from the orbital venous plexus prior to administration of test substances (0 h) and after 0.033, 0.083, 0.167, 0.25, 0.5, 1, 2, 4, 6 and 8 h. Blood samples were collected in tubes containing K2-EDTA and kept on ice until they were centrifuged at 2,400 × g for 10 min at 4°C to allow the collection of plasma, which was stored at −80°C.
Six male SD rats were lavaged with 2 mg/kg DIC at a dosing volume of 2 ml/kg. Blood (1 ml) was taken from the orbital venous plexus prior to administration of test substances (0 h) and after 0.033, 0.083, 0.167, 0.25, 0.5, 1, 2, 4, 6 and 8 h. Blood samples were collected in tubes containing K2-EDTA and kept on ice until they were centrifuged at 2,400 × g for 10 min at 4°C to allow the collection of plasma, which was stored at −80°C.
Preparation of calibration standard samples and quality control (QC) samples
A standard stock solution (1 mg/ml) of DIC was prepared by dissolving DIC (10 mg) in 5 ml methanol/10 mM ammonium acetate (80:20, v/v). Calibration standard samples were prepared at concentrations of 10, 20, 50, 100, 500, 1,000, 5,000, and 10,000 ng/ml with the same mixed solvent. QC solutions with low, medium, and high concentrations (20, 500 and 5,000 ng/ml) were prepared in the same manner. The standard IS stock solution (2 mg/ml) of Naproxen was prepared by dissolving Naproxen (10 mg) in 5 ml methanol. The IS working solution (1,000 ng/ml) was prepared with methanol/10 mM ammonium acetate (80:20, v/v).
Sample preparation
The frozen plasma samples were thawed at room temperature. An aliquot of 5 µl of IS solution (1,000 ng/ml Naproxen in the mobile phase) was added to a 50-µl plasma sample in a microcentrifuge tube. After vortex-mixing for 10 sec, 200 µl methanol was added to the mixture to precipitate proteins. The sample was vortex-mixed for 1 min and centrifuged at 17,829 × g at 4°C for 20 min. Finally, 100 µl of the supernatant was transferred to an injection bottle, which was loaded into an autosampler cabinet, from which a 7-µl aliquot was injected into the LC-MS/MS system. Samples with concentrations greater than the maximum standard in the calibration curve were determined following dilution with blank plasma.
LC-MS/MS conditions
The concentration of DIC in plasma was measured using HPLC-MS/MS. The HPLC-MS/MS system was a Shimadzu LC-20AD coupled to an API 3000 triple quadrupole mass spectrometer with an ESI source. The tandem mass spectrometer was operated under multiple reaction monitoring (MRM) using an electro-spray ionization source in negative ion mode. The optimized HPLC-MS/MS conditions were as follows: Collision gas of 10 psi, a curtain gas of 25 psi, a gas 1 of 50 psi, a gas 2 of 50 psi, an ion spray voltage of −5,000 V, a source temperature of 500°C, and an entrance potential of −4 V for DIC and −5 V for the IS (Naproxen). Quantification of m/z 293.85 to m/z 249.86 for DIC and m/z 228.67 to m/z 184.71 for Naproxen was performed in MRM. Chromatograms were integrated with Analyst software (version 1.4.2).
Chromatographic separation was performed on a Zorbax XDB-C18 column (3.5 µm, 2.1×50 mm). The mobile phase consisted of methanol/10 mM ammonium acetate (80:20 v/v) at an isocratic flow rate of 0.3 ml/min. The injection volume was 7 µl. The run time was 3 min. The temperatures of the analytical column and autosampler were set at 35 and 4°C, respectively. Under these conditions, the retention times for DIC and Naproxen were 1.63 and 1.54 min, respectively.
The quantification method was shown to be suitable for the determination of DIC in rat plasma. The specificity, sensitivity, linearity, rate of extraction recovery, within-day and between-day precision, stability, and matrix effect of the analytical method conformed to relevant provisions regarding biological sample analysis (7–9).
Statistical analysis
The pharmacokinetic parameters of DIC were analyzed and processed by the non-compartmental model of WinNonlin5.2 software (Pharsight Corporation, Mountain View, CA, USA). The experimental data were presented as mean ± standard deviation (mean ± SD). The maximum plasma concentration (Cmax) and time taken to reach Cmax (Tmax) were estimated directly from the observed plasma concentration-time data. The elimination rate constant (λz) was determined by linear regression analysis of the log-linear part of the plasma concentration-time curve. The total area under the plasma concentration-time curve (AUC0-t) was calculated using the linear trapezoidal rule. The AUC from 0 to infinity (AUC0-∞) was calculated as AUC0-∞ = AUC + Ct/λz (where Ct was the last plasma concentration measured). The half-life (T1/2) of DIC was calculated as T1/2 = ln2/λz. The apparent clearance (CL) of DIC was calculated as CL = dose/AUC0-∞. The apparent volume of distribution (Vz) of DIC was calculated as V = CL/λz.
Results and Discussion
Plasma concentration and concentration-time curve
After i.v. and p.o. administration of 2 mg/kg DIC (n=12) to SD rats, the relationship between the plasma concentration of DIC and time was determined (Table I). The concentration-time curves for i.v. and p.o. DIC are shown in Figs. 1 and 2, whereas the mean concentration-time curves are shown in Fig. 3. The drug concentration in the plasma decreased rapidly after i.v. administration of DIC. After 8 h, the concentration of DIC in the plasma was approximately 10 ng/ml.
Table I.
Mean plasma concentration (mean ± SD) of diclofenac sodium after i.v. (rat 1–6) and p.o. (rat 7–12) administration at a dose of 2 mg/kg.
| Concentration (ng/ml) | ||
|---|---|---|
| Time (h) | i.v. | p.o. |
| 0.03 | 9413.5±1276.0 | 38.7±12.9 |
| 0.08 | 6197.4±674.6 | 418.1±137.4 |
| 0.17 | 3903.9±529.4 | 1195.6±218.4 |
| 0.25 | 2066.0±364.5 | 1019.8±123.8 |
| 0.5 | 1108.6±284.6 | 649.4±97.2 |
| 1 | 476.6±65.7 | 416.4±96.6 |
| 2 | 391.0±26.4 | 402.9±178.5 |
| 4 | 95.5±17.5 | 368.7±62.7 |
| 6 | 47.2±9.7 | 109.8±29.2 |
| 8 | 10.7±3.3 | 31.3±13.1 |
SD, standard deviation; i.v., intravenous; p.o., oral administration.
Figure 1.

Individual time-concentration curves of diclofenac sodium (intravenous administration of 2 mg/kg to rat 1–6).
Figure 2.

Individual time-concentration curves of diclofenac sodium (administration by lavage at a dose of 2 mg/kg to rat 7–12).
Figure 3.
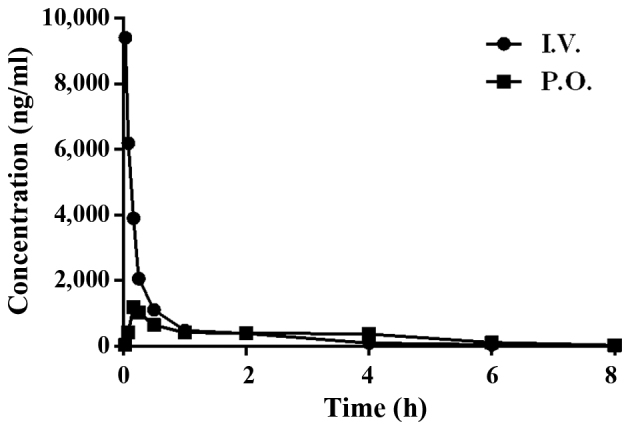
Mean time-concentration curves of diclofenac sodium (administered intravenously and by lavage at a dose of 2 mg/kg to rat 1–12).
Pharmacokinetic study
WinNonlin pharmacokinetic software was used to analyze the plasma concentration of DIC using a noncompartmental model following administration in rats. The pharmacokinetic parameters (after fitting) are shown in Table I.
As shown in Table II, the λz (0.63±0.12 l/h), t½ (1.12±0.18 h), Cmax (1272±112 ng/ml), tmax (0.19±0.04 h), AUC0-∞ (2501±303 h × ng/ml), CL (0.81±0.10 l/h), and Vz (1.29±0.12 l) of DIC in rats following p.o. administration were nearly equal to the corresponding values in rats following i.v. administration. The pharmacokinetic parameters of DIC determined in the present study are consistent with those reported in previous studies (6,10–13). The t½ values of 1.22 h (i.v.) and 1.12 h (p.o.) for DIC in rats agree well with the reported t½ values of 1.03 h in sheep (6), 1.3 h in dogs (10), and 1.04 and 1.12 h in humans (11,12). In the present study, the MRT of DIC was 1.05 h following i.v. administration and 2.7 h following p.o. administration, whereas the CL of DIC was 0.6 l/h following i.v. administration and 0.81 l/h following p.o. administration; these values are very close to reported values in rabbits (t½, 1.30 and 2.68 h; CL, 0.49 and 0.51 l/h) (13). In comparison with rats, dogs, and sheep, a shorter t½ (5.15 h) was observed in buffalo calves (6).
Table II.
Pharmacokinetic parameters (mean ± SD) of diclofenac sodium in plasma following intravenous and intragastric administration to rats.
| Pharmacokinetic parameters | Unit | i.v. | p.o. |
|---|---|---|---|
| λz | l/h | 0.57±0.05 | 0.63±0.12 |
| t½ | h | 1.22±0.11 | 1.12±0.18 |
| tmax | h | 0.19±0.04 | |
| Cmax | ng/ml | 1272±112 | |
| C0 | ng/ml | 12449±2261 | |
| AUC0-t | h × ng/ml | 3337±235 | 2448±279 |
| AUC0-∞ | h × ng/ml | 3356±238 | 2501±303 |
| Vz | l | 1.05±0.10 | 1.29±0.12 |
| CL | l/h | 0.60±0.04 | 0.81±0.10 |
| MRT | h | 1.05±0.07 | 2.70±0.18 |
| Vss | l | 0.63±0.07 | |
| F | % | 74.4±6.4 |
SD, standard deviation; λz, terminal elimination rate constant; t½, apparent terminal elimination half-life; C0, initial plasma concentration; Cmax, peak plasma level; Tmax, time to peak plasma level; AUC0-t, area under the concentration-time curve from time 0 to the time of the last quantifiable concentration; AUC0-∞, area under the concentration-time curve from time 0 extrapolated to infinity; CL, clearance; Vz, apparent volume of distribution; MRT, mean residence time; Vss, apparent volume of distribution at steady state.
DIC is almost completely absorbed after p.o. It is subjected to first-pass metabolism in order that only approximately 50% of the drug reaches the systemic circulation in an unchanged form (13). This extensive metabolism is the reason for DIC having poor oral bioavailability. In previous studies, the bioavailability of DIC in sheep, rabbits, and humans was 50, 50–60, and 30%, respectively (6,12,13). In the present study, the bioavailability of p.o. DIC in rats was approximately 74.4%. These results were markedly different from those of previous studies. The reasons for this remain to be elucidated in future studies. In most species, DIC is more than 99% protein bound (14–16), this property is responsible for its low Vz (1.05, i.v.; 1.29, p.o.) and CL (0.60, i.v.; 0.81, p.o.).
The present study revealed that p.o. administration induced a pronounced second peak in the plasma DIC concentration-time curve of rats; this second peak was not present following i.v. administration. The double-peak phenomenon has four typical causes: enterohepatic circulation, gastrointestinal circulation, delayed gastric emptying, and absorption differences in the intestines. We hypothesized that enterohepatic circulation was the main reason for the observed double-peak in the time-concentration curve of DIC in rats.
Acknowledgements
The present study was supported by the Yangtze Youth Fund (no. 2015cqn38) and the 2016 Undergraduate Innovation Experimental Project of Yangtze University (no. 2016043).
References
- 1.Todd PA, Sorkin EM. Diclofenac sodium. A reappraisal of its pharmacodynamic and pharmacokinetic properties, and therapeutic efficacy. Drugs. 1988;35:244–285. doi: 10.2165/00003495-198835030-00004. [DOI] [PubMed] [Google Scholar]
- 2.Imamura H, Hata J, Iida A, Manabe N, Haruma K. Evaluating the effects of diclofenac sodium and etodolac on renal hemodynamics with contrast-enhanced ultrasonography: A pilot study. Eur J Clin Pharmacol. 2013;69:161–165. doi: 10.1007/s00228-012-1336-0. [DOI] [PubMed] [Google Scholar]
- 3.Armogida M, Gold M. Diclofenac potassium 25 mg liquid capsules: Earlier and higher exposure to diclofenac. A fasted, single-dose, comparative bioavailability study vs. diclofenac potassium 2 × 12.5 mg tablets. Int J Clin Pharmacol Ther. 2012;50:445–451. doi: 10.5414/CP201658. [DOI] [PubMed] [Google Scholar]
- 4.Zeitlinger M, Rusca A, Oraha AZ, Gugliotta B, Müller M, Ducharme MP. Pharmacokinetics of a new diclofenac sodium formulation developed for subcutaneous and intramuscular administration. Int J Clin Pharmacol Ther. 2012;50:383–390. doi: 10.5414/CP201600. [DOI] [PubMed] [Google Scholar]
- 5.Zhai XJ, Yu Y, Chen F, Lu YN. Comparative bioavailability and tolerability of single and multiple doses of 2 diclofenac sodium sustained-release tablet formulations in fasting, healthy chinese male volunteers. Curr Ther Res Clin Exp. 2013;75:53–58. doi: 10.1016/j.curtheres.2013.08.001. [DOI] [PMC free article] [PubMed] [Google Scholar]
- 6.Rahal A, Kumar A, Ahmad AH, Malik JK. Pharmacokinetics of diclofenac and its interaction with enrofloxacin in sheep. Res Vet Sci. 2008;84:452–456. doi: 10.1016/j.rvsc.2007.06.002. [DOI] [PubMed] [Google Scholar]
- 7.Shah VP, Midha KK, Findlay JW, Hill HM, Hulse JD, McGilveray IJ, McKay G, Miller KJ, Patnaik RN, Powell ML, et al. Bioanalytical method validation - a revisit with a decade of progress. Pharm Res. 2000;17:1551–1557. doi: 10.1023/A:1007669411738. [DOI] [PubMed] [Google Scholar]
- 8.Karnes HT, March C. Precision, accuracy, and data acceptance criteria in biopharmaceutical analysis. Pharm Res. 1993;10:1420–1426. doi: 10.1023/A:1018958805795. [DOI] [PubMed] [Google Scholar]
- 9.Shen X, Chen J. Certification of biological pharmaceutical analysis method. Chung Kuo Yao Hsueh Tsa Chih. 1993;24:425–426. [Google Scholar]
- 10.Tsuchiya T, Terakawa M, Ishibashi K, Noguchi H, Kato R. Disposition and enterohepatic circulation of diclofenac in dogs. Arzneimittelforschung. 1980;30:1650–1653. [PubMed] [Google Scholar]
- 11.Scallion R, Moore KA. Effects of food intake on the pharmacokinetics of diclofenac potassium soft gelatin capsules: A single-dose, randomized, two-way crossover study. Clin Ther. 2009;31:2233–2241. doi: 10.1016/j.clinthera.2009.10.001. [DOI] [PubMed] [Google Scholar]
- 12.Bedada SK, Yellu NR, Neerati P. Effect of resveratrol treatment on the pharmacokinetics of diclofenac in healthy human volunteers. Phytother Res. 2016;30:397–401. doi: 10.1002/ptr.5549. [DOI] [PubMed] [Google Scholar]
- 13.Kasperek R, Zimmer Ł, Jawień W, Poleszak E. Pharmacokinetics of diclofenac sodium and papaverine hydrochloride after oral administration of tablets to rabbits. Acta Pol Pharm. 2015;72:527–538. [PubMed] [Google Scholar]
- 14.Sweetman SC, Martindale W. The Complete Drug Reference. 37th. The Pharmaceutical Press; London: 2011. [Google Scholar]
- 15.Willis JV, Kendall MJ, Flinn RM, Thornhill DP, Welling PG. The pharmacokinetics of diclofenac sodium following intravenous and oral administration. Eur J Clin Pharmacol. 1979;16:405–410. doi: 10.1007/BF00568201. [DOI] [PubMed] [Google Scholar]
- 16.Fowler PD, Shadforth MF, Crook PR, John VA. Plasma and synovial fluid concentrations of diclofenac sodium and its major hydroxylated metabolites during long-term treatment of rheumatoid arthritis. Eur J Clin Pharmacol. 1983;25:389–394. doi: 10.1007/BF01037953. [DOI] [PubMed] [Google Scholar]