Abstract
The radiosensitization effect of gold nanoparticles (GNPs) has been demonstrated both in vitro and in vivo in radiation therapy. The purpose of this study was to systematically assess the biological effectiveness of GNPs distributed in the extracellular media for realistic cell geometries. TOPAS-nBio simulations were used to determine the nanometre-scale radial dose distributions around the GNPs, which were subsequently used to predict the radiation dose response of cells surrounded by GNPs. MDA-MB-231 human breast cancer cells and F-98 rat glioma cells were used as models to assess different cell geometries by changing 1) the cell shape, 2) the nucleus location within the cell, 3) the size of GNPs, and 4) the photon energy. The results show that the sensitivity enhancement ratio (SER) was increased up to a factor of 1.2 when the location of the nucleus is close to the cell membrane for elliptical-shaped cells. Heat-maps of damage-likelihoods show that most of the lethal events occur in the regions of the nuclei closest to the membrane, potentially causing highly clustered damage patterns. The effect of the GNP size on radiosensitization was limited when the GNPs were located outside the cell. The improved modelling of the cell geometry was shown to be crucial because the dose enhancement caused by GNPs falls off rapidly with distance from the GNPs. We conclude that radiosensitization can be achieved for kV photons even without cellular uptake of GNPs when the nucleus is shifted towards the cell membrane. Furthermore, damage was found to concentrate in a small region of the nucleus in close proximity to the extracellular, GNP-laden region.
Introduction
The goal of radiation therapy is to deliver therapeutic doses to tumours while sparing surrounding normal tissue. In current medical practice, various strategies such as intensity-modulated radiation therapy (IMRT) are applied to achieve highly conformal dose distributions. To increase the therapeutic ratio further, nanoparticles (NPs) have been suggested to increase the dose to the target. Two methods can be used to achieve a NP concentration gradient between tumours and healthy tissue. First, NPs may accumulate passively in tumours due to the enhanced permeability and retention (EPR) effect.1 Second, the NPs can be coated with targeting molecules that attach to features only expressed by tumour cells. One of the most common materials considered for NPs radiosensitization is gold. Gold nanoparticles (GNPs) are of interest due to their low toxicity, easy surface modifications and, a large photoelectric cross sections.2, 3 Numerous in vitro 4–6, in vivo3, 7, 8, and in silico9–11 studies have shown amplification of biological damage in irradiated cells in the presence of GNPs.
In the in silico studies, Monte Carlo simulations and analytic calculations were used to calculate dose distributions around NPs. Even though the highest dose enhancement was observed in the immediate proximity of a GNP, an increase in dose up to 10 μm from the surface of the irradiated GNP was observed due to the production and emission of secondary electrons from the GNPs.12, 13 The amount of dose enhancement induced by GNPs has been investigated for multiple modalities, including kV and MV photon and proton irradiations as well as Auger therapy.14–16 Due to the high cross section of the photoelectric effect in gold, photons of kVp energy have been proven to be more effective for GNP enhanced radiation therapy.4, 13 For this reason, effective GNP-enhanced radiation therapy using low-energy photons is more clinically feasible for shallow-seated tumours such as breast cancer and glioma near the skull. In particular for glioma and glioblastoma treatments GNPs can be injected directly at the site of surgery, which greatly reduces complications in penetrating the blood brain barrier to deliver the GNPs to the target.17 GNPs injected at the excision site diffuse into the interstitial fluid, following the spread of the tumour cells.
In order to model cell radiosensitization with GNPs, an approach based on the Local Effect Model (LEM) was applied to consider the effects of highly inhomogeneous dose distributions at the sub-cellular scale generated by the presence of GNPs, the GNP-LEM9–11, and to investigate other potential radiation targets such as mitochondria and blood vessels.18, 19 These previous studies all assumed a spherical shaped cell with a centrally located nucleus and predicted the decrease in cell survival in the presence of GNPs. However, the spherical cell geometry used in those studies is overly simplified. The nucleus, which contains radiation sensitive targets such as DNA, is often located at the periphery of a cell. In addition, tumour cells are not typically spherical in shape but can have complex shapes. To the best of our knowledge, there have been no systematic studies to quantify the dependency of GNP radiosensitization on the cell geometry.
In this study, we follow the GNP-LEM approach to quantify biological effects depending on 1) the shape of the cell membrane, 2) the location of the nucleus, 3) the size of GNPs in the media, and 4) the photon source energy. Additionally, we studied the heat-map of damage induction within the nucleus.
Methods
Monte Carlo simulation
Monte Carlo simulations were performed using an alpha version of TOPAS-nBio, an extension of TOPAS (Tool for Particle Simulation). We used TOPAS version 3.0.1, which is layered on top of Geant4 version 10.2.p1.20, 21 TOPAS-nBio is a nanometre scale extension22 to TOPAS for nanometre scale simulations using the Geant4-DNA23, 24 physics processes. The simulation procedures were the same as in our previous work9, 15 and are briefly described (fig. 1).
Fig. 1.
Schematic diagram of simulation geometry (not in scale) (a) For 150 kVp and 51 keV photon beams, the phase space were recorded for particles passing a 2 cm diameter area at 2 cm depth in a macroscopic water phantom. (b) The radiation field was reduced to the size of GNP and irradiated into GNP in vacuum. The outgoing electrons were scored in a second phase space file on the surface of GNP. (c) The second phase space was used as source in a microscopic water phantom.
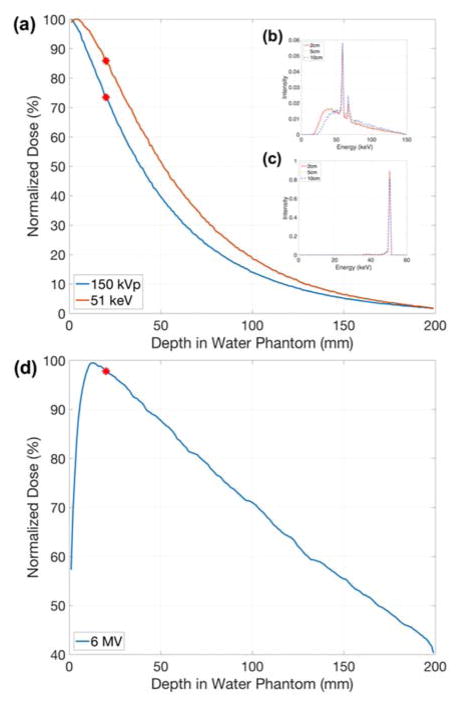
Three photon sources were investigated: (1) a 150 kVp polychromatic beam with a 2 mm aluminium filter acquired by SpekCalc 1.125, (2) a 51 keV mono-energetic beam, and (3) a Varian TrueBeam (Varian Medical Systems, Inc., Palo Alto, CA) 6 MV beam downloaded from the manufacturer website (at myvarian.com/montecarlo)26. The first two beam energies were selected to match the experimental setup that determined the cell-response parameters of MDA-MB-231 and F-98 cells, respectively. A cylindrical water phantom was simulated with impinging uniform photon beams of 50 mm in diameter. All particles passing through a circle of 10 mm radius centred on and perpendicular to the beam axis within the phantom were recorded. The phase space files were acquired at 2 cm depth to reflect clinical treatment conditions for shallow tumour such as breast cancer (fig. 1(a)).27, 28 For kV photons, the percent depth doses and energy spectra at 2, 5, and 10 cm depth are shown in fig. 2. The normalized energy spectra at different depths does not differ significantly, particularly in the region of highest interaction probability (~40–100 keV), therefore the relative results in this study are expected to be valid for other depths.
Fig. 2.
Percentage depth dose for (a) 150 kVp and 51 keV photon beams. Normalized energy spectra of (b) 150 kVp and (c) 51 keV at 2, 5, and 10 cm depths. Percentage depth dose for (d) 6 MV photon beam. The phase space files were recorded at 2 cm depth as indicated by red dots.
The radius of the phase space acquired in the previous step was adjusted to have the same diameter as a single GNP (diameter = 2, 15, 20, 50 nm) and was used to irradiate a single GNP (fig. 1(b)). The momentum directions of the particles were forced to be parallel to the forward beam direction to ensure that all particles pass through the GNP. Following our previous work,15 each particle was weighted by 1/cos(θ) based on the angle (θ) between its original direction and the beam axis to account for contributions of laterally scattered electrons. Electrons exiting the GNP were recorded in a second phase space file covering the outer surface of the whole GNP. The phase space recorded on the GNP surface was used as a source at the centre of a 120 × 120 × 120 μm3 water phantom (fig. 1(c)).
The radial dose up to 50 μm from the surface of GNP was calculated in spherical shells with a thickness of 1 nm up to 50 μm from the surface of the GNP. Based on the obtained radial dose distributions, analytic functions were derived to describe the radial dose originating from GNPs for effect modelling to reduce computation time. The form of the analytic functions was Dose = a · (radius)b + c where a, b, and c are constants for different sections of radial ranges.
For the simulations in gold, the Geant4 low-energy electromagnetic Penelope physics model was used and electrons were tracked down to 100 eV.29–31. The range cut for the production of all particles was set to 1 nm. The standard TOPAS-nBio Geant4-DNA physics list was used to track electrons in water.23, 24
In all the above simulations, atomic de-excitation processes were activated including fluorescence, Auger electron emission and Auger cascades.32
Effect modelling
The interaction probability per dose was calculated as below.
The total interaction probability was determined by two factors: probability that a random photon in our phase space passes through a GNP and that a photon passing the GNP interacts. The first factor accounted for the difference in size of the scored phase space in the macroscopic scale water phantom to the microscopic size of the source phase space for GNP irradiation. Here RGNP was the radius of the GNP and Rphsp was radius of the phase space acquired in a macroscopic water phantom. For example, for 15 nm diameter GNP, RGNP and Rphsp were 7.5 nm and 10 mm respectively. The second factor is determined by the particles interacting in microscopic volume of the GNP. Here Ntrack was defined as the number of particle tracks that interacted and caused an ionization in the GNP volume for incoming particles depositing 1 Gy in a water phantom.
The LEM was developed to predict the relative biological effectiveness in particle therapy and has subsequently been applied to calculate effect enhancements due to GNPs 9, 10, 33–35. The basic assumption of the LEM is that equal local doses on a sub-cellular scale lead to equal local damages, independent of the energy and type of radiation. The LEM describes the damage in terms of “lethal events (N)” which is a function of dose (D) and follows a Poisson distribution. The macroscopic surviving fraction with GNP can be described by
where N̄ is the average number of lethal events in the sensitive target.
In the LEM (and thus GNP-LEM), the average number of lethal events in the sensitive target is assumed to be the integral of the number of events locally determined by an empirical dose-response curve for x-ray, which is given below:
Since linear-quadratic (LQ) model overestimates the response in the high-dose region,36 the dose response curve is represented in two ways with a threshold dose Dt and maximum slope Smax = α +2βDt as follows:
For GNP enhanced radiation therapy, the local dose distribution can be described by a summation of the homogeneously delivered prescription dose and the additional dose from interactions with the GNPs. This additional dose was determined by summation of the radial dose per single ionizing event for each GNP multiplied by the interaction probability per delivered dose and the prescribed dose. Here the radial dose was calculated with Monte Carlo simulations described in previous section.
The two dimensional GNP-LEM was developed using area integration. This is a reasonable assumption for in vitro experimentation with cells in 2D Petri dishes.
Input parameters
Two cell lines were chosen to study the geometrical effects, MDA-MB-231 breast cancer and F-98 glioma cells. These cells were used because their radiation response in the presence of GNPs has previously been investigated.4, 17 The parameters for the LQ model were α = 0.019, β= 0.052 and α = 0.002, β= 0.079 for MDA-MB-231 irradiated with 150 kVp and 6 MV photons, respectively4. They were α = 0.002 and β= 0.041 for F-98 irradiated with 51 keV37. As no α and β values with 6 MV are published for F-98 cell lines, we assumed same α and β values as 51 keV exposures. The threshold dose Dt, which typically is in the range of 10 to 30 Gy, was set to 20 Gy for this study.38
We used the cell diameters of 13.5 and 32.5 μm with nuclei of 8 and 10 μm in diameter for MDA-MB-231 and F-98 cells, respectively.39, 40 Based on microscopic images39 we know that these cells often have an elliptical shape, which was considered in our modelling approach. For elliptical cell geometries, the cell membrane diameter was constantly changed for major and minor diameter. The extracellular media was represented by a thickness of 2.5 μm around the cell membrane. The cell geometry was assumed to be a cylinder with a thickness of 2 μm and considered as a two dimensional flattened object for GNP-LEM. Table 1 summarized the geometry setup.
Table 1.
Summary of the geometrical setup. For the ellipse, the major and minor diameters are given.
| Celldiameter [μm] | Nucleus diameter [μm] | ||
|---|---|---|---|
| Circle | MDA-MB-231 | 13.5 | 8 |
| F-98 | 32.5 | 10.5 | |
| Ellipse | MDA-MB-231 | 15.5/11.5, 17/10, 18.5/8.5 | 8 |
| F-98 | 37/28, 40.5/24.5, 44/20.5 | 10.5 |
Various cell geometry conditions were considered for the effect modelling (fig. 3). First, the effects of cell membrane shapes were investigated in terms of eccentricity where a and b are the major and minor axis half lengths (fig. 3(a) and (d)). Secondly, the nucleus was shifted inside the cell (fig. 3(b), (e), and (f)). The radiosensitization effects of several distances (d) between the centre of the cell and the nucleus were investigated. Two directional locations were considered along the major and minor axis due to asymmetric features of elliptical cells (fig. 3(e) and (f)). Due to geometrical symmetries, results for shifts of the nucleus along other directions are expected to be bracketed by these two scenarios. To determine the regions of importance for the GNP enhancement effect inside the nucleus we calculated not only mean dose enhancement in sub-regions (fig. 3(c), (e), and (f)) but also the heat map of lethal events across the nucleus.
Fig. 3.
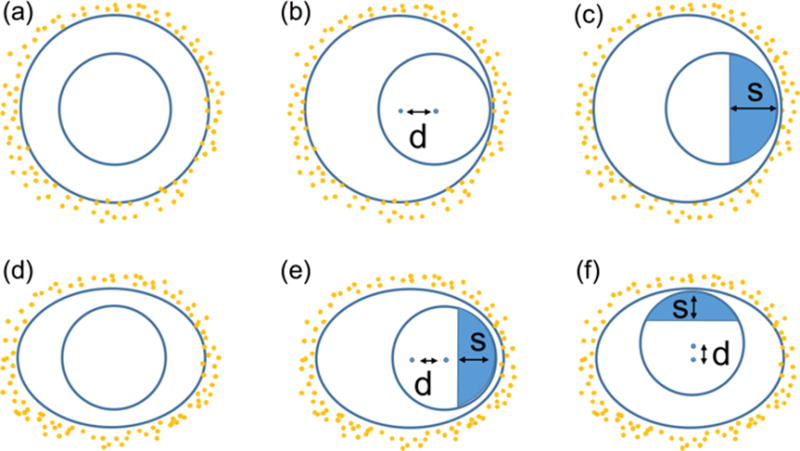
Schematic diagram of cell and nucleus used for the GNP-LEM. (a): Circular cell with centrally located nucleus; (b): Circular cell with shifted nucleus; (c): Circular cell with shifted nucleus and sub-regions in the nucleus; (d)-(f): Similar for elliptical cell with nucleus shifted along major and minor axis (d = distance between centre of cell and nucleus). The parameter s gives the size of the sub-regions in nucleus to calculate mean dose enhancement.
For all scenarios, NPs were randomly distributed outside the cell membrane in the cylindrical extracellular media and 2% mass weight concentrations of GNPs to the total cell and media were assumed. The number of GNPs was calculated from the 2% mass weight, volume and density of GNPs, and those of the cell and extracellular media. We considered a GNP size of 15 nm in diameter as a reference, because this size was used in several in vivo studies.8, 17, 41 The GNP diameters of 2, 20 and 50 nm were also considered to investigate the impact of the GNP size. The geometrical components including cell, nucleus, and randomly placed GNPs were modelled in MATLAB 2016b (Mathworks, Inc., Natick, MA).
Dose response curves were calculated for various scenarios with GNP-LEM predictions. The sensitivity enhancement ratio (SER) was defined as the difference ratios of area under the dose response curve. To evaluate the importance of sub-regions, the mean dose enhancement factor (MDEF) was defined. The MDEF was calculated by dividing the dose in a sub-region in the presence of GNPs by dose without GNPs. The lethal event heat-map with/without GNPs was also calculated to show the inhomogeneous distribution of GNP-induced lethal events inside the nucleus.
Results
Radial dose distribution
The interaction probabilities for the two photon sources are shown in table 2. The interaction probability depends on both the photon energy and the GNP size. 150 kVp photons have more than a 20% higher interaction probability than 51 keV photons. Increasing the GNP diameter led to an increase in the interaction probability per Gray proportional to the volume, due to the longer path length through the interaction volume for photons.
Table 2.
The interaction probability of GNPs per Gray at 2 cm depth for a range of GNP sizes and for three photon sources.
| GNP diameter | 2nm | 15 nm | 20 nm | 50 nm |
|---|---|---|---|---|
| Energy | ||||
| 150 kVp | 1.5×10⁻⁶ | 6.1×10⁻⁴ | 1.4×10⁻³ | 2.2×10⁻² |
| 51 keV | 1.2×10⁻⁶ | 4.9×10⁻⁴ | 1.2×10⁻³ | 1.8×10⁻² |
| 6 MV | 2.9×10⁻⁷ | 1.1×10⁻⁴ | 2.4×10⁻⁴ | 3.5×10⁻³ |
Fig. 4 shows the dose per ionization event for the two photon sources. As the distance from the single GNP increased, the dose originating from the GNP decreased rapidly. The dose per ionization event in close proximity to the largest GNP was less than that of the smallest GNP. This was likely due to the reabsorption of low-energy electrons created inside the larger GNPs. The dose per ionization event for a 15 nm GNP was up to 10 times larger near the surface compared to a 50 nm GNP. The GNP size dependent dose differences decreased as the distance from the GNP surface increases. Step-like patterns were observed at certain distances. This was due to the large number of low-energy Auger electrons ejected from the GNP by kilovoltage photons as described in our previous study,15 disabling Auger processes removed these steps (see Fig. 4). For megavoltage photons however, the step-like patterns were greatly reduced due to the smaller contribution from Auger electrons (Fig. 4(c)). We found a fitting curve of Dose = a ·(radius)b + c (a, b, and c are parameters fitted for several radial bins). The fit curve is also shown fig. 4 for comparison. The default break points between radial ranges were determined by 0.02 (or 0.04), 0.1, 0.2, 1, 2, 10, 20, 30, 40, and 50 μm and few more points were added if necessary. The differences between the analytical fit and the simulation were within 10% for radial distances of < 20 μm.
Fig. 4.
Fitting curve and radial dose distributions as a function of distance from the GNP surface calculated with Monte Carlo for (a) 150 kVp, (b) 51 keV, and (c) 6 MV photon beams (AOn/AOff = with/without Auger electron contributions from atomic de-excitation processes). Results for GNP sizes of 2, 15, 20 and 50 nm are plotted.
Effect Modelling
Case1: cell shape
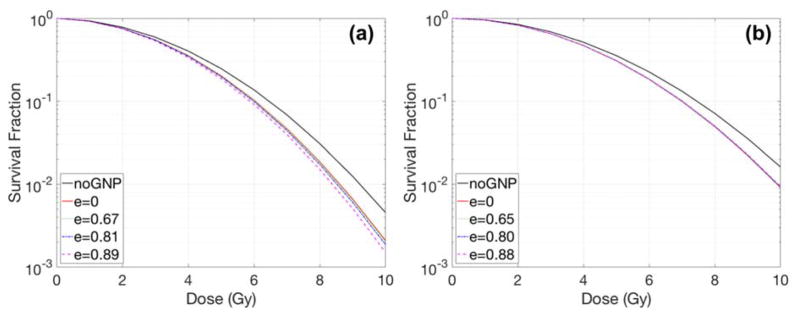
The effect of the cell shape on the radiation dose response was investigated (Fig. 5). The eccentricity was calculated to quantify the magnitude of cell shape change according to Table 1. The amount of radiosensitization enhancement increased from a factor of 1.07 to 1.10 for the smaller cell (i.e., MDA-MB-231). On the other hand, for the large cell (F-98), the shape of the cell did not significantly affect the results when the nucleus was placed in the cell centre.
Fig. 5.
Dose response curves with various eccentricities for (a) MDA-MB-231 and (b) F-98 cells. GNPs, of 15 nm diameter, were concentrated in media by a 2% weight ratio. Here e = eccentricity, a unitless quantity.
Case2 - shifted nucleus
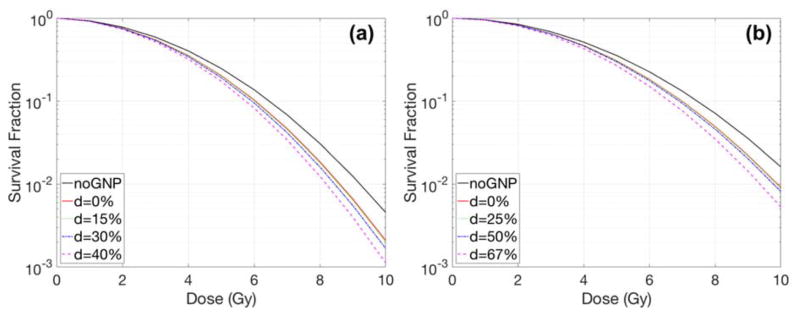
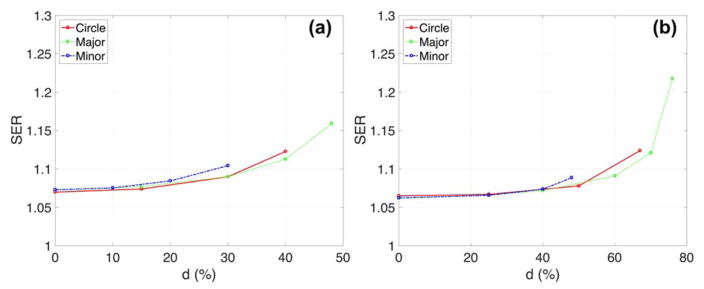
Fig. 6 and 7 show the effect of the nucleus location on radiation dose response and its sensitivity enhancements. The shift of the nucleus within the cell was denoted as the distance between the centre of the cell and the nucleus divided by the radius of the cell. The GNP radiosensitization depended not only on the cell shape but also on the location of the nucleus. For the circular cell geometries (Fig. 6), the SER differed by less than 10% for various distances between the nucleus surface and the cell membrane. The relative SER differences for F-98 were larger than those for MDA-MB-231 cells because the geometric variations for a larger cell were more profound due to its smaller nucleus/cell size ratio. For elliptical cells, the SER was increased up to 1.16 for MDA-MB-231 and 1.22 for F-98. The maximum SER was obtained when the nucleus was located along the major axis.
Fig. 6.
Dose response curves with various nucleus locations inside a circular cell for (a) MDA-MB-231 and (b) F-98. The GNP with a diameter of 15 nm was concentrated in media by a 2% weight ratio. The parameter d describes the distance between the centre of the cell and the centre of the nucleus/radius of cell in %.
Fig. 7.
Sensitivity enhancement ratio (SER) versus centre between nucleus and cell (=d; distance between the centre of the cell and the centre of the nucleus/cell ratio in %) depending on cell shape for (a) MDA-MB-231 and (b) F-98. For elliptical cells, major/minor cell diameters are 15.5/11.5 and 44/20.5 μm for MDA-MB-231 and F-98 cells, respectively. The circular nucleus was located either along the major or the minor axis. The GNPs had a diameter of 15 nm with a concentration in the media of 2% by weight.
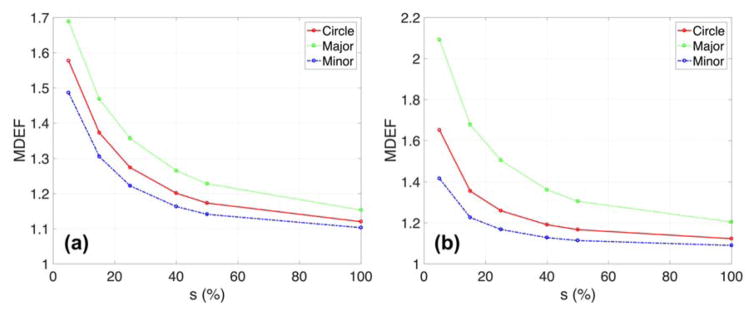
The GNP radiosensitization was further quantified inside the nucleus (fig. 8, 9, and 10). The nucleus was shifted such that the distance between the cell and nuclear membrane was 50 nm. For the elliptical MDA-MB-231 cells with the nucleus located along the major axis, the MDEF was 1.23 when the sub-region was reduced to half the size of the nucleus and increased up to 1.69 for the smallest size of the sub-region (=0.4 μm) (see fig. 8). This MDEF dependency on the size of the sub-region was stronger for the larger size F-98 cells. Additionally, the nucleus located along the major axis could result in a higher MDEF than along the minor axis in elliptical cells because overall the cell membrane and GNPs are closer to the nucleus when it is on the major axis.
Fig. 8.
Mean dose enhancement factor (MDEF) versus size of sub-regions (=s) depending on the cell shape for (a) MDA-MB-231 and (b) F-98. For elliptical cells, major/minor cell diameters are 15.5/11.5 and 44/20.5 μm for MDA-MB-231 and F-98 cells. The circular nucleus was located along major/minor axis and distance between cell and nuclear membrane was 50 nm. The GNPs had a diameter of 15 nm with a concentration in the media of 2% by weight. The percentage refers to the sub-regions per nucleus diameter.
Fig. 9.
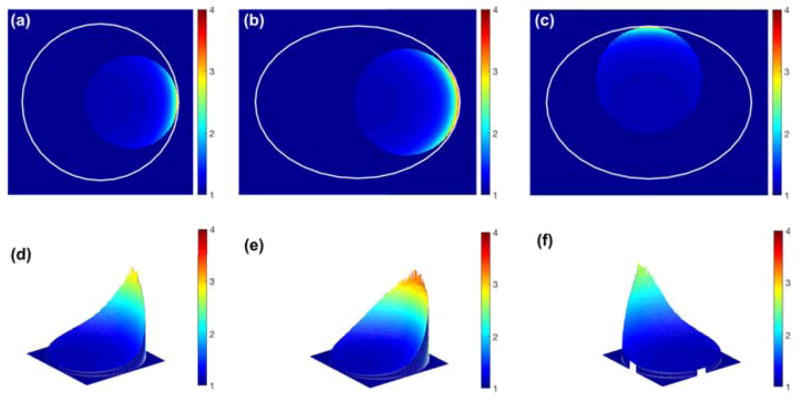
Lethal event enhancement distributions for (a, d) circular and (b, c, e, f) elliptical MDA-MB-231. For elliptical cells, the major/minor axis ratio is 15.5/11.5 μm for MDA-MB-231. The circular nucleus was located along the major/minor axis and the membrane distance between the cell and the nucleus was 50 nm. The GNPs, with diameter of 15 nm, had a concentration in the extracellular media of 2% by weight. The percentage refers to the sub-regions per nucleus diameter. The area excluding the nucleus is masked as 1.
Fig. 10.
Lethal event enhancement distributions for (a, d) circular and (b, c, e, f) elliptical F-98. For elliptical cells, the major/minor axis ratio is 44/20.5 μm for F-98 cells. The circular nucleus was located along the major/minor axis and membrane distance between cell and nucleus was 50 nm. The GNPs, of diameter 15 nm, had a concentration in the extracellular media of 2% by weight. The percentage refers to the sub-regions per nucleus diameter. The area excluding the nucleus is masked as 1.
The heat-map of lethal event induction in the nucleus is displayed in fig. 9 and 10. The lethal damage distribution in the nucleus varied depending on the size of the cell as well as the location and size of the nucleus within the cell. For elliptical cells, the largest lethal event enhancement was observed when the nucleus was shifted along the major axis due to the large dose enhancement. The lethal event distribution was found to be heterogeneous in the nucleus and closely related to the distance to the GNP-containing medium.
The heterogeneity of dose and lethal event enhancement was due to the nucleus location inside the cells. When the nucleus was in the centre of the cell, the differences between maximum and minimum MDEF were negligible (< 0.02). The ratios of the standard deviations/mean of lethal event enhancement were subsequently reduced from 0.20 and 0.20 to 0.02 and 5.69e-4 when the nucleus was located in the centre of cell for circular MDA-MB-231 and F-98 cells, respectively.
Case3 - GNP sizes
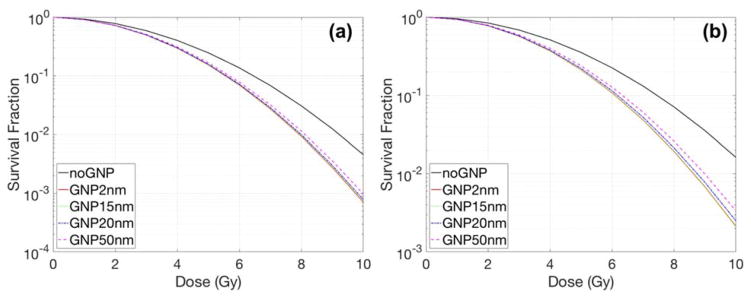
For the same concentration of GNPs (mass weight 2%), the size of the GNPs influenced the radiosensitization for both cell lines. Fig. 11 shows the results for elliptical cells having a 50 nm gap between the cell and nuclear membrane. As the size of the GNPs is reduced, the SER slightly increases from 1.13 to 1.16 for MDA-MB-231 cells and 1.17 to 1.22 for F-98 cells. Even though smaller GNPs have a higher dose per ionization at their surface, the effect of the GNP size on radiosensitization was limited when the GNPs were located outside the cell with a 50 nm distance between the cell and nuclear membrane. As can be seen in figure 4, the largest difference between the dose distributions from GNPs occur within the first 50 nm to 100 nm.
Fig. 11.
Dose response curves for various GNP diameters with 150 kVp for an elliptical cell of (a) MDA-MB-231 and (b) F-98. For elliptical cells, the major/minor axis ratio is 15.5/11.5 and 44/20.5 μm for MDA-MB-231 and F-98 respectively. The distance between the cell and nuclear membrane was 50 nm. The GNPs were distributed in the extracellular media with a concentration of 2% by weight.
Case4 - 6 MV beams
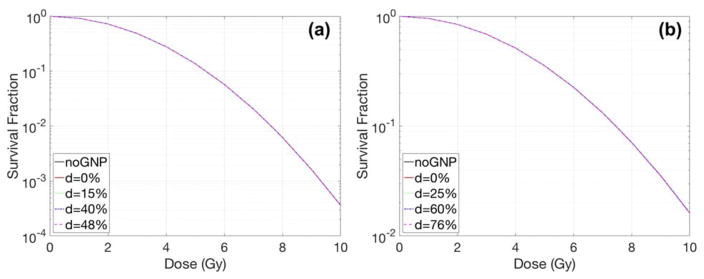
The radiosensitization effects of higher photon energy (6 MV) was investigated for both cell lines with a 2% mass weight concentration of GNPs. However, no GNP radiosensitization was observed with 15 nm GNP and 2% mass weight (Figure 12). Their SER increases were negligible (only up to 1.01) even when the nucleus was located close to the cell membrane. GNP enhancements are typically not expected to be observable without higher concentrations of GNPs in media.9
Fig. 12.
Dose response curves with 6 MV photon for various nucleus locations inside an elliptical cell of (a) MDA-MB-231 and (b) F-98. For elliptical cells, the major/minor axis ratio is 15.5/11.5 and 44/20.5 μm for MDA-MB-231 and F-98 respectively. The nucleus was located along the major/minor axis and the membrane distance between the cell and the nucleus was 50 nm. The GNP with a diameter of 15 nm was concentrated in media by a 2% weight ratio. The parameter d describes the distance between the centre of the cell and the centre of the nucleus/radius of cell in %.
Discussion
Detailed modelling of cell geometries is crucial to better our understanding of GNP radiosensitization. In this paper, we quantify the effects of the cell geometry on GNP radiosensitization using Monte Carlo simulations and a modified Local Effect Model. For the GNP-LEM approach, it is important to not only consider the size and shape of the cell, but also the displacement of the nucleus, and the distribution of GNPs with respect to the cell nucleus, because of the limited range of electrons emitted from the GNPs. We further quantified the dose enhancement in sub-sections of the nucleus and plotted lethal event heat maps inside the nucleus to determine the importance of geometrical effects for GNP radiosensitization.
In this study we only consider the effects of GNPs located in the extracellular media. According to a previous study,9 if GNPs were able to penetrate the cell and/or nuclear membrane, the GNP mediated dose enhancement in the nucleus would be larger. Additionally, if GNPs are homogeneously distributed in the entire cell region, the effect of varying the cell geometry is expected to be negligible due to an invariance of distances between GNPs and nucleus. Thus, while our approach maximizes the difference of the observed effect when changing the cell geometry, it provides a conservative estimate on the overall GNP mediated radiosensitization. Our study was motivated by the fact that restricting GNPs to the extracellular medium represents several potential treatment scenarios. GNPs are typically restricted to the extracellular medium for treatment scenarios where GNPs accumulate passively via the EPR effect e.g., vasculature targeted treatments, or in treatments with uncoated (non-targeted) GNPs that do not penetrate tumour cells. Early in vivo studies found an effectiveness of GNPs on tumour cells irradiated only few minutes after injection.7 However, in vitro studies have shown that cellular uptake of the NPs takes more than 6 h42 while large number of NPs were observed in the extracellular medium before sufficient uptake times.42
For this study, we assumed a GNP mass concentration of 2% for the total cell plus the surrounding media. This 2% concentration is relatively high compared to previous in-vitro and in-vivo studies.3, 4, 7 However, all of the GNPs were located in the media outside of the cell in this study. Hainfeld et al8 measured a GNP concentration in tumours of 1.5%. Considering that the interstitial fluid for gliomas makes up between 20–40% of the volume, GNP concentrations in the fluid can be as high as 4.5%. The predicted radiosensitization of elliptical F-98 cells with a shifted nucleus increased from 1.16 to 1.22 and 1.53 for GNP concentrations from 1.5% to 2% and 4.5%, respectively.
One limitation of our study are the physics models in the packages used. Geant4-Penelope and Geant4-DNA are incomplete when modelling NPs. For radiation interactions with GNPs, Geant4-Penelope is unable to precisely reproduce very low-energy electron interactions in the GNP since it is limited to electrons of energies above 100 eV and neglects the reduced dimensionality of the GNPs, this has been shown in work on nanotubes.31, 43, 44 Furthermore, the interaction probability per Gray with 6 MV photons in this study was found to be higher than that reported in previous studies9, 18. We found that this difference was due to the different physics setting used in the two simulations. In this study, we used a lower tracking cutoff, tracking electrons down to an energy of 100 eV, and a lower secondary electron production threshold of 100 eV. These cuts increased the number of low energy events for 6 MV photons because it includes a larger number of (low-energy) electron-gold interactions. In the previous studies9, 18, we found that a higher cutoff was necessary for simulating proton irradiations.
The limitations of Geant4-Penelope to model physics interactions only down to 100 eV may result in some approximations/uncertainties of the radial dose in close proximity of the GNPs. Geant4-DNA is able to model the generation of very low-energy electrons (down to ~ few eV), however it is limited to a liquid water medium and thus cannot be used for interactions with gold within the GNP at this time. The upcoming release of the updated Geant4-DNA physics will further improve the accuracy of radial dose calculations.45, 46 The latest release of Geant4 (Geant4 v.10.3) features a new Geant4-DNA physics module (option4), which predicts slight differences in the dose as a result of improvements in the Geant4-DNA physics model mainly affecting low-energy electron (e.g., < 100 eV) transportation in water. Future developments of Geant4-DNA to include physics models for metals would further improve the results of this study in close proximity to GNP. 47, 48
It is important to note that we performed a theoretical study of the impact of cell geometry in GNP radiosensitisation. Radiation therapy is a complex process, which requires quantification of not only the physical dose but also the biochemical reactions such as the generation of free-radicals, DNA repair, and cell cycle disruption4, 49. The generation of free-radicals was not considered in this GNP-LEM approach. A number of studies suggest that chemical processes could further amplify GNP mediated radiosensitization.49, 50 The cellular stress induced by the presence of reactive oxygen species can induce further biological damage. For example, positively charged NPs with an amine functional group were observed to exhibit higher cytotoxicity due to increased intracellular reactive oxygen species.50 When GNPs are irradiated, they emit electrons. The average remaining charge in a single GNP per ionization event is presented in Table 3. For the same ionization, the remaining charge decreased with increasing GNP size due to larger number of internally re-absorbed electrons. These charged GNPs have the potential to create additional reactive oxygen species which may cause further damage, in particular if the GNPs are located inside the cell or the nucleus. Experimental validation is therefore necessary to prove the dependency of GNP radiosensitzation on cell geometry, including secondary effects.
Table 3.
The average remaining charge (electron charge) collected in single GNP per ionization at 2 cm depth for four GNP sizes and three photon sources.
| GNP diameter | 2 nm | 15 nm | 20 nm | 50 nm |
|---|---|---|---|---|
| Energy | ||||
| 150 kVp | 4.8 | 3.4 | 3.2 | 2.4 |
| 51 keV | 5.0 | 3.6 | 3.2 | 2.5 |
| 6 MV | 1.0 | 0.3 | 0.2 | 0.2 |
In this study we used a 2D computational model to calculate the biological effect. This 2D assumption is reasonable because most in vitro cell culture studies are performed in near two-dimensional petri dish experiments. The predicted dose in this study is expected to be slightly higher than for a 3D model due to dimension reduction. On the other hand, the additional number of GNPs located above and below the cell in a 3D model may increase the delivered dose to the nucleus. Therefore, absolute values of GNP radiosensitization are likely to be dependent on actual cell geometry in a 3D model. However, this should not affect the conclusions for the trends of cell geometry dependencies.
Another point to notice is, that our modelling approach uses alpha/beta ratios determining cell kill using clonogenic assays obtained 9–14 and 11 days after irradiation for MDA-MB-231 and F-98 cells, respectively.4, 37 Thus, the predicted survival fractions from this study are similar to the cell kill as determined by the number of lethal damages to a cell. A detailed modelling of cell structures (such as DNA bases) with GNPs distributions in 3D in combination with a more mechanistic model of cell repair kinetics and 3D live cell imaging techniques22, 51 is necessary to distinguish different damage types or endpoints.
In addition to the effect, we quantified the mean dose in certain sub-regions and generated lethal event heat-maps inside the nucleus. The enhancement of dose and lethal events across the nucleus volume was found to be highly heterogeneous when the nucleus was close to the cell membrane and mostly homogeneous when the nucleus was located at the cell centre. The enhancement was mainly limited to small sub-regions in close proximity to the GNPs. Thus, in order to predict radiation response with GNPs, it is important to implement geometries of not only the cell but also the DNA molecules inside the nucleus and the distribution of GNPs in and around the cells. To obtain the biological effects considering the full nuclear deformations and nuclear heterogeneity, one would need to simulate cells and GNPs with full track structure Monte Carlo simulations. Such an approach would further allow us to directly obtain single and double strand breaks of DNA within a realistic DNA representation and model the repair mechanisms mechanistically. The current work was one step along this way.
Conclusions
We performed MC simulations to characterize interactions between GNPs and low-energy photons at the nanometre scale and applied the results to a biological model to quantify the dependency of GNP radiosensitization on the cell geometry. Due to a steep radial dose falloff within short distances from the GNPs (< 1% of surface dose at 100 nm), geometric parameters such as the shape, size, and location of the cell and the nucleus are important to assess GNP-mediated radiosensitization. Radiosensitization can be achieved with kV photons even without cellular uptake of GNPs when the nucleus is shifted inside the cell and located in close proximity to the extracellular, GNP-laden region.
Acknowledgments
This work was in part supported by NIH/NCI under R01 CA187003 (“TOPAS-nBio: a Monte Carlo tool for radiation biology research”) and R43 CA192702 (“Gold Nanoparticle Treatment of Glioma”). This work was also supported by the National Research Foundation of Korea (NRF) grant funded by the Korean government (MSIP: Ministry of Science, ICT and Future Planning) (No. NRF-2013M2B2B1075776 and NRF-2013M2B2B1075772) and the Office of International Affairs (OIA) at Seoul National University (overseas training program).
References
- 1.Matsumura Y, Maeda H. Cancer Res. 1986;46:6387–6392. [PubMed] [Google Scholar]
- 2.Huff TB, Hansen MN, Zhao Y, Cheng JX, Wei A. Langmuir. 2007;23:1596–1599. doi: 10.1021/la062642r. [DOI] [PMC free article] [PubMed] [Google Scholar]
- 3.Hainfeld JF, Dilmanian FA, Slatkin DN, Smilowitz HM. J Pharm Pharmacol. 2008;60:977–985. doi: 10.1211/jpp.60.8.0005. [DOI] [PubMed] [Google Scholar]
- 4.Jain S, Coulter JA, Hounsell AR, Butterworth KT, McMahon SJ, Hyland WB, Muir MF, Dickson GR, Prise KM, Currell FJ, O’Sullivan JM, Hirst DG. Int J Radiat Oncol Biol Phys. 2011;79:531–539. doi: 10.1016/j.ijrobp.2010.08.044. [DOI] [PMC free article] [PubMed] [Google Scholar]
- 5.Berbeco RI, Korideck H, Ngwa W, Kumar R, Patel J, Sridhar S, Johnson S, Price BD, Kimmelman A, Makrigiorgos GM. Radiat Res. 2012;178:604–608. doi: 10.1667/RR3001.1. [DOI] [PMC free article] [PubMed] [Google Scholar]
- 6.Chithrani DB, Jelveh S, Jalali F, van Prooijen M, Allen C, Bristow RG, Hill RP, Jaffray DA. Radiat Res. 2010;173:719–728. doi: 10.1667/RR1984.1. [DOI] [PubMed] [Google Scholar]
- 7.Hainfeld JF, Slatkin DN, Smilowitz HM. Phys Med Biol. 2004;49:N309–315. doi: 10.1088/0031-9155/49/18/n03. [DOI] [PubMed] [Google Scholar]
- 8.Hainfeld JF, Smilowitz HM, O’Connor MJ, Dilmanian FA, Slatkin DN. Nanomedicine (Lond) 2013;8:1601–1609. doi: 10.2217/nnm.12.165. [DOI] [PMC free article] [PubMed] [Google Scholar]
- 9.Lin Y, McMahon SJ, Paganetti H, Schuemann J. Phys Med Biol. 2015;60:4149–4168. doi: 10.1088/0031-9155/60/10/4149. [DOI] [PubMed] [Google Scholar]
- 10.McMahon SJ, Hyland WB, Muir MF, Coulter JA, Jain S, Butterworth KT, Schettino G, Dickson GR, Hounsell AR, O’Sullivan JM, Prise KM, Hirst DG, Currell FJ. Sci Rep. 2011;1:18. doi: 10.1038/srep00018. [DOI] [PMC free article] [PubMed] [Google Scholar]
- 11.McMahon SJ, Paganetti H, Prise KM. Nanoscale. 2016;8:581–589. doi: 10.1039/c5nr07089a. [DOI] [PubMed] [Google Scholar]
- 12.Jones BL, Krishnan S, Cho SH. Med Phys. 2010;37:3809–3816. doi: 10.1118/1.3455703. [DOI] [PubMed] [Google Scholar]
- 13.Leung MK, Chow JC, Chithrani BD, Lee MJ, Oms B, Jaffray DA. Med Phys. 2011;38:624–631. doi: 10.1118/1.3539623. [DOI] [PubMed] [Google Scholar]
- 14.Sung W, Jung S, Ye SJ. Phys Med Biol. 2016;61:7522–7535. doi: 10.1088/0031-9155/61/21/7522. [DOI] [PubMed] [Google Scholar]
- 15.Lin Y, McMahon SJ, Scarpelli M, Paganetti H, Schuemann J. Phys Med Biol. 2014;59:7675–7689. doi: 10.1088/0031-9155/59/24/7675. [DOI] [PubMed] [Google Scholar]
- 16.Martinez-Rovira I, Prezado Y. Med Phys. 2015;42:6703–6710. doi: 10.1118/1.4934370. [DOI] [PubMed] [Google Scholar]
- 17.Bobyk L, Edouard M, Deman P, Vautrin M, Pernet-Gallay K, Delaroche J, Adam JF, Esteve F, Ravanat JL, Elleaume H. Nanomedicine. 2013;9:1089–1097. doi: 10.1016/j.nano.2013.04.007. [DOI] [PubMed] [Google Scholar]
- 18.Lin Y, Paganetti H, McMahon SJ, Schuemann J. Med Phys. 2015;42:5890–5902. doi: 10.1118/1.4929975. [DOI] [PMC free article] [PubMed] [Google Scholar]
- 19.McNamara AL, Kam WW, Scales N, McMahon SJ, Bennett JW, Byrne HL, Schuemann J, Paganetti H, Banati R, Kuncic Z. Phys Med Biol. 2016;61:5993–6010. doi: 10.1088/0031-9155/61/16/5993. [DOI] [PMC free article] [PubMed] [Google Scholar]
- 20.Agostinelli S, Allison J, Amako Ka, Apostolakis J, Araujo H, Arce P, Asai M, Axen D, Banerjee S, Barrand G. Nucl Instr Meth Phys Res. 2003;506:250–303. [Google Scholar]
- 21.Perl J, Shin J, Schumann J, Faddegon B, Paganetti H. Med Phys. 2012;39:6818–6837. doi: 10.1118/1.4758060. [DOI] [PMC free article] [PubMed] [Google Scholar]
- 22.McNamara A, Geng C, Turner R, Mendez JR, Perl J, Held K, Faddegon B, Paganetti H, Schuemann J. Phys Med. 2017;33:207–215. doi: 10.1016/j.ejmp.2016.12.010. [DOI] [PMC free article] [PubMed] [Google Scholar]
- 23.Incerti S, Ivanchenko A, Karamitros M, Mantero A, Moretto P, Tran HN, Mascialino B, Champion C, Ivanchenko VN, Bernal MA, Francis Z, Villagrasa C, Baldacchin G, Gueye P, Capra R, Nieminen P, Zacharatou C. Med Phys. 2010;37:4692–4708. doi: 10.1118/1.3476457. [DOI] [PubMed] [Google Scholar]
- 24.Bernal MA, Bordage MC, Brown JM, Davidkova M, Delage E, El Bitar Z, Enger SA, Francis Z, Guatelli S, Ivanchenko VN, Karamitros M, Kyriakou I, Maigne L, Meylan S, Murakami K, Okada S, Payno H, Perrot Y, Petrovic I, Pham QT, Ristic-Fira A, Sasaki T, Stepan V, Tran HN, Villagrasa C, Incerti S. Phys Med. 2015;31:861–874. doi: 10.1016/j.ejmp.2015.10.087. [DOI] [PubMed] [Google Scholar]
- 25.Poludniowski G, Landry G, DeBlois F, Evans PM, Verhaegen F. Phys Med Biol. 2009;54:N433–438. doi: 10.1088/0031-9155/54/19/N01. [DOI] [PubMed] [Google Scholar]
- 26.Constantin M, Perl J, LoSasso T, Salop A, Whittum D, Narula A, Svatos M, Keall PJ. Med Phys. 2011;38:4018–4024. doi: 10.1118/1.3598439. [DOI] [PubMed] [Google Scholar]
- 27.Cunningham JE, Jurj AL, Oman L, Stonerock AE, Nitcheva DK, Cupples TE. Breast Cancer Res Treat. 2006;100:319–328. doi: 10.1007/s10549-006-9256-2. [DOI] [PubMed] [Google Scholar]
- 28.Ye SJ, Brezovich IA, Shen S, Kim S. Int J Radiat Oncol Biol Phys. 2004;60:672–677. doi: 10.1016/j.ijrobp.2004.05.039. [DOI] [PubMed] [Google Scholar]
- 29.Bernal MA, Liendo JA. Med Phys. 2009;36:620–625. doi: 10.1118/1.3056457. [DOI] [PubMed] [Google Scholar]
- 30.Champion C, Incerti S, Perrot Y, Delorme R, Bordage MC, Bardies M, Mascialino B, Tran HN, Ivanchenko V, Bernal M, Francis Z, Groetz JE, Fromm M, Campos L. Appl Radiat Isot. 2014;83(Pt B):137–141. doi: 10.1016/j.apradiso.2013.01.037. [DOI] [PubMed] [Google Scholar]
- 31.Fernandez-Varea JM, Gonzalez-Munoz G, Galassi ME, Wiklund K, Lind BK, Ahnesjo A, Tilly N. Int J Radiat Biol. 2012;88:66–70. doi: 10.3109/09553002.2011.598209. [DOI] [PubMed] [Google Scholar]
- 32.Incerti S, Suerfu B, Xu J, Ivantchenko V, Mantero A, Brown J, Bernal M, Francis Z, Karamitros M, Tran H. Nucl Instr Meth Phys Res B. 2016;372:91–101. [Google Scholar]
- 33.Scholz M, Kraft G. Radiat Prot Dosim. 1994;52:29–33. [Google Scholar]
- 34.McQuaid HN, Muir MF, Taggart LE, McMahon SJ, Coulter JA, Hyland WB, Jain S, Butterworth KT, Schettino G, Prise KM, Hirst DG, Botchway SW, Currell FJ. Sci Rep. 2016;6:19442. doi: 10.1038/srep19442. [DOI] [PMC free article] [PubMed] [Google Scholar]
- 35.Katz R. Radiat Res. 2003;160:724–728. doi: 10.1667/rr3088. [DOI] [PubMed] [Google Scholar]
- 36.Astrahan M. Med Phys. 2008;35:4161–4172. doi: 10.1118/1.2969065. [DOI] [PubMed] [Google Scholar]
- 37.Taupin F, Flaender M, Delorme R, Brochard T, Mayol JF, Arnaud J, Perriat P, Sancey L, Lux F, Barth RF, Carriere M, Ravanat JL, Elleaume H. Phys Med Biol. 2015;60:4449–4464. doi: 10.1088/0031-9155/60/11/4449. [DOI] [PubMed] [Google Scholar]
- 38.Kramer M, Jakel O, Haberer T, Kraft G, Schardt D, Weber U. Phys Med Biol. 2000;45:3299–3317. doi: 10.1088/0031-9155/45/11/313. [DOI] [PubMed] [Google Scholar]
- 39.Berges R, Balzeau J, Peterson AC, Eyer J. Mol Ther. 2012;20:1367–1377. doi: 10.1038/mt.2012.45. [DOI] [PMC free article] [PubMed] [Google Scholar]
- 40.Coulter JA, Jain S, Butterworth KT, Taggart LE, Dickson GR, McMahon SJ, Hyland WB, Muir MF, Trainor C, Hounsell AR, O’Sullivan JM, Schettino G, Currell FJ, Hirst DG, Prise KM. Int J Nanomedicine. 2012;7:2673–2685. doi: 10.2147/IJN.S31751. [DOI] [PMC free article] [PubMed] [Google Scholar]
- 41.Kim JK, Seo SJ, Kim HT, Kim KH, Chung MH, Kim KR, Ye SJ. Phys Med Biol. 2012;57:8309–8323. doi: 10.1088/0031-9155/57/24/8309. [DOI] [PubMed] [Google Scholar]
- 42.Chithrani BD, Ghazani AA, Chan WC. Nano Lett. 2006;6:662–668. doi: 10.1021/nl052396o. [DOI] [PubMed] [Google Scholar]
- 43.Emfietzoglou D, Kyriakou I, Garcia-Molina R, Abril I, Kostarelos K. Appl Phys Lett. 2012;100:093113. [Google Scholar]
- 44.Emfietzoglou D, Kyriakou I, Garcia-Molina R, Abril I, Kostarelos K. J Appl Phys. 2010;108:054312. [Google Scholar]
- 45.Kyriakou I, Incerti S, Francis Z. Med Phys. 2015;42:3870–3876. doi: 10.1118/1.4921613. [DOI] [PubMed] [Google Scholar]
- 46.Kyriakou I, Šefl M, Nourry V, Incerti S. J Appl Phys. 2016;119:194902. [Google Scholar]
- 47.Incerti S, Douglass M, Penfold S, Guatelli S, Bezak E. Phys Med. 2016 doi: 10.1016/j.ejmp.2016.09.007. [DOI] [PubMed] [Google Scholar]
- 48.Sakata D, Incerti S, Bordage M, Lampe N, Okada S, Emfietzoglou D, Kyriakou I, Murakami K, Sasaki T, Tran H. J Appl Phys. 2016;120:244901. [Google Scholar]
- 49.Jain S, Coulter JA, Butterworth KT, Hounsell AR, McMahon SJ, Hyland WB, Muir MF, Dickson GR, Prise KM, Currell FJ, Hirst DG, O’Sullivan JM. Radiother Oncol. 2014;110:342–347. doi: 10.1016/j.radonc.2013.12.013. [DOI] [PubMed] [Google Scholar]
- 50.Klein S, Dell’Arciprete ML, Wegmann M, Distel LV, Neuhuber W, Gonzalez MC, Kryschi C. Biochem Biophys Res Commun. 2013;434:217–222. doi: 10.1016/j.bbrc.2013.03.042. [DOI] [PubMed] [Google Scholar]
- 51.Kim D, Oh N, Kim K, Lee S, Park J, Park Y. bioRxiv. 2016:097113. [Google Scholar]


