

Abstract
Background
Traditional metrics of lung disease such as those derived from spirometry and static single-volume CT images are used to explain respiratory morbidity in patients with chronic obstructive pulmonary disease (COPD), but are insufficient. We hypothesized that the mean Jacobian determinant, a measure of local lung expansion and contraction with respiration, would contribute independently to clinically relevant functional outcomes.
Methods
We applied image registration techniques to paired inspiratory-expiratory CT scans and derived the Jacobian determinant of the deformation field between the two lung volumes to map local volume change with respiration. We analyzed 490 participants with COPD with multivariable regression models to assess strengths of association between traditional CT metrics of disease and the Jacobian determinant with respiratory morbidity including dyspnea (mMRC), St Georges Respiratory Questionnaire (SGRQ) score, six-minute walk distance (6MWD), and the BODE index, as well as all-cause mortality.
Results
The Jacobian determinant was significantly associated with SGRQ (adjusted regression co-efficient β = −11.75,95%CI −21.6 to −1.7;p=0.020), and with 6MWD (β=321.15, 95%CI 134.1 to 508.1;p<0.001), independent of age, sex, race, body-mass-index, FEV1, smoking pack-years, CT emphysema, CT gas trapping, airway wall thickness, and CT scanner protocol. The mean Jacobian determinant was also independently associated with the BODE index (β= −0.41, 95%CI −0.80 to −0.02; p = 0.039), and mortality on follow-up (adjusted hazards ratio = 4.26, 95%CI = 0.93 to 19.23; p = 0.064).
Conclusion
Biomechanical metrics representing local lung expansion and contraction improve prediction of respiratory morbidity and mortality and offer additional prognostic information beyond traditional measures of lung function and static single-volume CT metrics.
Keywords: COPD, image registration, biomechanical, quality of life, BODE index, mortality
Background
Airflow obstruction is the hallmark of chronic obstructive pulmonary disease (COPD); however, computed tomography (CT) is increasingly used to characterize and phenotype subtypes of COPD.1 The major subtypes of structural lung disease visualized on CT, emphysema and thickened airway walls, are both independently associated with airflow obstruction.2,3 These metrics of disease on CT have also been shown to be associated with important patient-reported and objective outcomes such as dyspnea,4 quality of life,5,6 exercise capacity,7,8 the BODE (Body-Mass Index, Airflow Obstruction, Dyspnea, and Exercise Capacity) index,5 and mortality.9 A substantial number of patients with COPD, however, have significant discordance between spirometry and CT findings. We recently demonstrated that a biomechanical measure of structural lung disease (the Jacobian determinant, an elasticity measure of local lung volume change assessed through matching images acquired at multiple lung volumes) substantially explains the differences between static single-volume CT images and airflow obstruction on spirometry.10,11 However, it remains important to determine if the Jacobian determinant is associated with standard clinical measures of patient outcomes. Such determination will enhance its use in better phenotyping patients. We analyzed data from a large subset of a well characterized cohort of participants with COPD who underwent clinical, physiological and radiographic assessments. We hypothesized that the mean Jacobian determinant, a measure of local tissue expansion and contraction, would provide additional explanation for the variations in clinically relevant outcomes including dyspnea, quality of life, functional capacity, and the BODE index, as well as all-cause mortality.
Methods
Patient selection
We analyzed participants enrolled in the Genetic Epidemiology of COPD (COPDGene) study, a large, ongoing, multicenter cohort study that includes current and former smokers aged 45 to 80 years, and without other chronic lung diseases except COPD and asthma. Demographics were collected as per the COPDGene protocol via self-administered questionnaires. Details of the study protocol have been previously published.12 Post-bronchodilator spirometry was performed using the ndd EasyOne spirometer to assess airflow obstruction. COPD was diagnosed using the ratio of forced expiratory volume in the first second (FEV1) to the forced vital capacity (FVC) of < 0.70, and severity categorized according to Global initiative for Chronic obstructive Lung Disease (GOLD) recommendations.13 All participants provided written informed consent and the research protocol was approved by the institutional review board at each participating center. The first 1000 participants to enroll, and with complete image registration CT data, were included in the study reported here.
Morbidity data
Respiratory-related quality of life was assessed using the St. George’s Respiratory Questionnaire (SGRQ).14 Scores were calculated for the three main subdomains of the SGRQ: symptoms, activities and impact. Total score ranges from 0 to 100, with higher scores indicating worse quality of life. The minimum clinically important difference (MCID) for SGRQ is 4 units. Dyspnea was quantified using the modified Medical Research Council dyspnea score; the score ranges from 0 to 4, with greater score indicating worse dyspnea.15 Exercise tolerance was assessed using the six minute walk distance (6MWD); MCID for the 6MWD is 26 m.16 The multidimensional BODE index was finally calculated using body mass index, FEV1 %predicted, mMRC and 6MWD; the scale ranges from 0 to 10, with greater scores indicating a higher risk of mortality.17 We also obtained data on all-cause mortality on longitudinal follow-up of approximately 5 years.
CT Image Acquisition
Volumetric CT scans were acquired with the subject in the supine position during a carefully coached breath-hold to either full inspiration (total lung capacity; TLC) or end expiration (functional residual capacity; FRC). The scanning protocol included a collimation, 0.5mm; tube voltage, 120kV; tube current, 200mAs; gantry rotation time, 0.5s; and a pitch, 1.1. The images were reconstructed with a standard kernel (dependent upon the make and model of the scanner) and a slice thickness of 0.75mm and an interval of 0.5mm.
CT Image-based Measures
Densitometry
Using 3D Slicer software (www.airwayinspector.org), we measured emphysema and gas trapping based on density mask analyses.12 Emphysema was quantified by using the percentage of voxels at TLC with attenuation < −950 Hounsfield units (HU) and gas trapping was quantified as the low attenuation areas on FRC scan that are < −856 HU. We used Pulmonary Workstation 2 (VIDA Diagnostics, Coralville, IA, USA) to measure the wall area percentage of segmental airways (WA%) that represent airway remodeling.12 The wall area percentage of segmental airways (WA%) was quantified at full inspiration CT image, and was estimated as (wall area/total bronchial area)×100. The mean WA% was calculated as the average of six segmental bronchi in each subject.
Image Registration
The full inspiration (TLC) and end expiration (FRC) scans were registered for each subject. Details of image registration are provided in the Supplement. Briefly, a lung mass-preserving registration method was used to capture volume changes between the two phases of respiration.18 A sum of squared tissue volume difference (SSTVD) method was used as a similarity metric. This method has been shown previously to be effective in lung image registration protocols.10,11 The transformation matrix from the registration process was used to derive regional tissue expansion and contraction measures between TLC and FRC volumes. In this study, we used the Jacobian determinant metric to represent regional deformation patterns in COPD patients. The Jacobian determinant measures the local volume change and estimates the pointwise expansion and contraction during deformation of the lung from TLC to FRC. This results in a deformation map that has values ranging from 0 to infinity. A Jacobian determinant value greater than 1 indicates local expansion whereas less than 1 indicates local contraction. A Jacobian determinant value equal to 1 indicates neither local expansion nor contraction. We used the mean of the Jacobian deformation map as a lung mechanical measure for each subject representing local deformation patterns between TLC and FRC volumes. Figure 1 shows representative Jacobian deformation maps for participants with different disease severity.
Figure 1.
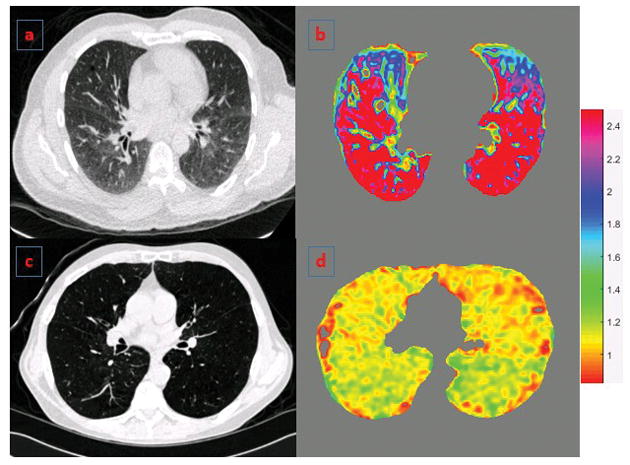
Panels a and b show axial CT section and the corresponding deformation map respectively for a representative participant with GOLD 1 with low BODE index. Panels c and d show similar images for a representative participant with GOLD 4 COPD and high BODE index. The colors depict the Jacobian deformation map from full inspiration to end expiration and show the variability in regional tissue expansion patterns across both subjects. Jacobian determinant = 1 represents no deformation; >1 = local expansion; and <1 = local contraction.
Statistical Analyses
We expressed all values as mean (standard deviation, SD). Pearson and Spearman correlation analyses were performed to assess the pairwise relationship of Jacobian determinant with SGRQ scores, BODE index, mMRC, 6MWD and FEV1. Association between Jacobian determinant and SGRQ was assessed using univariate and multivariable linear regression models after adjustment for age, sex, race, pack-years, BMI, FEV1, CT emphysema, CT gas trapping, WA%, and CT scanner type. As there was an overrepresentation of zero BODE scores, we used zero-inflated Poisson regression analyses to test the association between Jacobian determinant and the BODE index, after adjustment for the above mentioned variables, except for FEV1 and BMI as they are part of the BODE index. To calculate prediction of mortality on follow-up, we performed Cox proportional hazards analysis. Variables significant on univariate analysis at p<0.05 were entered into a multivariable Cox proportional hazards model to calculate adjusted hazards ratio for mortality for the Jacobian determinant; we forced CT scanner type into the model as this is clinically important. All tests of significance were two-tailed, and we considered an alpha level of <0.05 as statistically significant. All analyses were performed using Statistical Package for the Social Sciences (SPSS 22.0, SPSS Inc., Chicago, IL, USA) and R statistical software (version 3.2).
Results
Demographics
Of the first 1,000 participants to enroll, 562 participants had COPD GOLD stages 1 to 4. We excluded 72 participants due to image registration errors in boundary alignment. Table 1 shows the baseline demographics, physiologic assessments, CT quantification of COPD and respiratory morbidity scores. The mean age of the participants was 64.6 (8.2) years. The cohort was comprised of 250 (51.1%) males and 240 (48.9%) non-Hispanic Whites. Participants had a substantial cigarette smoking burden with mean pack-years of 52.9 (26.1); 336 (68%) were active smokers at the time of enrollment. The participants encompassed the spectrum of disease severity, with 62 (12.7%), 204 (41.6%), 138 (28.2%) and 86 (17.6%) having GOLD severity stages 1 through 4 respectively. Distributions of SGRQ, 6MWD and the BODE index in the study population are shown in Supplemental Figure 2.
Table 1.
Baseline demographics, physiologic assessments, CT quantification of COPD and morbidity scores
| Parameter | Mean (SD) |
|---|---|
| Age (years) | 64.6 (8.2) |
| Female (%) | 240 (49) |
| African American (%) | 78 (16) |
| BMI (kg/m2) | 27.5 (5.8) |
| Smoking pack-years | 52.9 (26.1) |
| Current Smokers (%) | 336(68) |
| FEV1 (L) | 1.49 (0.7) |
| FEV1 % Predicted | 53.2 (22.0) |
| FVC (L) | 2.96 (1.0) |
| FVC % Predicted | 80.0 (21.3) |
| FEV1/FVC | 0.49 (0.12) |
| CT Emphysema (%) | 12.4 (12.1) |
| CT Gas Trapping (%) | 37.9 (20.3) |
| Airway Wall Area (%), segmental airways | 62.3 (3.1) |
| SGRQ (Total Score) | 37.6 (22.4) |
| 6MWD (m) | 360 (145) |
| BODE index# | 3 (1–5) |
| mMRC score# | 2 (1–3) |
All values expressed as mean (standard deviation) or as percentage, except # where median (interquartile range) are depicted. BMI = Body Mass Index; FEV1 = Forced expiratory volume in the first second; FVC = Forced vital capacity; CT = Computed tomography; SGRQ = St George’s Respiratory Questionnaire; 6MWD = Six minute walk distance; BODE index = BMI, Airflow Obstruction, Dyspnea and Exercise capacity; mMRC = Modified Medical Research Council dyspnea scale.
Correlation between the Jacobian measure and respiratory morbidity
Pair-wise relationship analysis between the Jacobian determinant and patient outcomes was performed. There was an inverse and statistically significant association between the Jacobian determinant and total SGRQ scores (r = −0.46; p<0.001), the BODE index (r = −0.60; p <0.001), and mMRC scores (r = −0.41; p <0.001). There was a positive association between the Jacobian determinant and the six-minute walk distance (r = 0.47; p <0.001) and FEV1 (r = 0.60; p <0.001).
CT measures and SGRQ
Table 2 shows univariate and multivariable associations between the CT metrics of emphysema, gas trapping, WA% and the Jacobian measure with SGRQ. On univariate regression, the Jacobian determinant was significantly associated with SGRQ (unadjusted regression co-efficient β=−38.1, 95%CI= −46.8 to −29.2; p<0.001); this relationship held true after adjustment for age, sex, race, BMI, FEV1, smoking pack years, CT emphysema, CT gas trapping, airway wall area (WA%), and CT scanner type (β=−11.75, 95%CI= −21.6 to −1.7; p=0.020).
Table 2.
Univariate and multivariable associations of mean Jacobian determinant measure with SGRQ
| Parameter | Univariate Regression | Multivariable Regression | ||
|---|---|---|---|---|
| Regression co-efficient β (95%CI) | P value | Regression co-efficient β (95%CI) | P value | |
| Mean Jacobian determinant | −38.08 (−46.8, −29.2) | < 0.001 | −11.75 (−21.6, −1.7) | 0.020 |
| Age (years) | −0.50 (−0.7, −0.2) | < 0.001 | −0.68 (−0.9, −0.4) | < 0.001 |
| African American race | 12.22 (6.9, 17.5) | < 0.001 | 6.73 (1.6, 11.7) | 0.009 |
| Female sex | −0.91 (−4.9, 3.0) | 0.652 | −1.69 (−5.5, 2.1) | 0.390 |
| BMI (kg/m2) | 0.21 (−0.1, 0.5) | 0.219 | 0.39 (0.0, 0.7) | 0.013 |
| FEV1 (L) | −15.4 (−17.8, −13.2) | < 0.001 | −10.65 (−14.2, −7.0) | < 0.001 |
| Smoking pack-years | 0.11 (0.03, 0.18) | 0.003 | 0.16 (0.1, 0.2) | < 0.001 |
| CT Emphysema (%) | 0.57 (0.4, 0.7) | < 0.001 | 0.33 (0.0, 0.5) | 0.002 |
| CT Gas Trapping (%) | 0.44 (0.3, 0.5) | < 0.001 | −0.01 (−0.1, 0.1) | 0.990 |
| Airway Wall Area, (%) | 2.51 (1.8, 3.1) | < 0.001 | 0.95 (0.3, 1.5) | 0.002 |
SGRQ = St George’s Respiratory Questionnaire; BMI = Body mass index; FEV1 = Forced expiratory volume in the first second; CT = Computed tomography. Multivariable regression model adjusted for CT scanner type.
CT measures and 6MWD
The relationship between CT metrics and the 6MWD is shown in Table 3. On univariate analysis, the Jacobian measure was significantly associated with distance walked (β=770.1, 95%CI= 600.0 to 940.1; p<0.001); this association was maintained after multivariable adjustment (β=321.15, 95%CI= 134.1 to 508.1; p<0.001).
Table 3.
Univariate and multi-variate association of mean Jacobian determinant measure with six minute distance walked (6MWD)
| Parameter | Univariate Regression | Multivariable Regression | ||
|---|---|---|---|---|
| Regression co-efficient β (95%CI) | P value | Regression co-efficient β (95%CI) | P value | |
| Mean Jacobian determinant | 770.10 (600.0, 940.1) | < 0.001 | 321.15 (134.1, 508.1) | < 0.001 |
| Age (years) | −2.75 (−7.4, 1.9) | 0.251 | −3.52 (−7.7, 0.6) | 0.097 |
| African American race | −331.10 (−431.6, −230.5) | < 0.001 | −290.51 (−385.6, −195.3) | < 0.001 |
| Female sex | −74.66 (−151.8, 2.49) | 0.057 | −31.00 (−103.6, 41.6) | 0.402 |
| BMI (kg/m2) | −7.07 (−13.6, −0.5) | 0.035 | −10.79 (−16.6, 41.6) | < 0.001 |
| FEV1 (L) | 315.72 (270.7, 360.6) | < 0.001 | 204.08 (136.2, 271.9) | < 0.001 |
| Smoking pack-years | −1.18 (−2.6, 0.2) | 0.115 | −2.14 (−3.3, −0.9) | < 0.001 |
| CT Emphysema (%) | −8.19 (−11.3, −5.0) | < 0.001 | −7.26 (−11.8, −2.6) | 0.001 |
| CT Gas Trapping (%) | −7.10 (−9.0, −5.1) | < 0.001 | 2.95 (−0.3, 6.2) | 0.081 |
| Airway Wall Area (%) | −40.24 (−52.3, −28.2) | < 0.001 | −12.03 (−23.5, −0.5) | 0.040 |
BMI = Body mass index. FEV1 = Forced expiratory volume in the first second. CT = Computed tomography. Multivariable regression model adjusted for CT scanner type.
CT measures and BODE index
Table 4 shows the relationships between CT metrics and BODE index. The Jacobian determinant was significantly associated with the BODE index on univariate analysis (β= −1.77, 95%CI= −2.04 to −1.51; p<0.001), and after adjustment for age, sex, race, smoking pack-years, CT emphysema, CT gas trapping, airway wall area percent, and CT scanner type (β= −0.4, 95%CI= −0.8 to −0.01; p = 0.039).
Table 4.
Univariate and multivariable associations of mean Jacobian determinant measure with BODE index
| Parameter | Univariate Regression | Multivariable Regression | ||
|---|---|---|---|---|
| Regression co-efficient β (95%CI) | P value | Regression co-efficient β (95%CI) | P value | |
| Mean Jacobian determinant | −1.77 (−2.044, −1.507) | < 0.001 | −0.41 (−0.803, −0.019) | 0.039 |
| Age (years) | −0.004 (−0.010, 0.002) | 0.189 | −0.04 (−0.014, 0.001) | 0.054 |
| African American race | 0.22 (0.083, 0.350) | 0.001 | 0.16 (−0.008, 0.325) | 0.059 |
| Female sex | −0.01 (−0.112, 0.082) | 0.783 | 0.15 (0.040, 0.275) | 0.008 |
| Smoking pack-years | 0.002 (0.003, 0.004) | 0.013 | 0.00 (0.001, 0.005) | 0.001 |
| CT Emphysema (%) | 0.02 (0.021, 0.029) | < 0.001 | 0.01 (0.003, 0.018) | 0.003 |
| CT Gas Trapping (%) | 0.02 (0.023, 0.028) | < 0.001 | 0.01 (0.009, 0.020) | < 0.001 |
| Airway Wall Area (%) | 0.08 (0.064, 0.102) | < 0.001 | 0.07 (0.050, 0.089) | < 0.001 |
BODE index = BMI, Airflow Obstruction, Dyspnea and Exercise capacity; BMI = Body mass index. CT = Computed tomography. Multivariable regression model adjusted for CT scanner type.
CT measures and mortality
We had follow-up data for 441 of the 490 participants for a median of 6.8 years (interquartile range 6.6 to 6.9). Of these, 99 (22.4%) died on follow-up. On univariate analyses, all CT measures were associated with all-cause mortality; unadjusted hazards ratio (HR) for CT emphysema 1.03 (95%CI 1.02 to 1.05; p<0.001), CT gas trapping 1.03 (95%CI 1.02 to 1.04; p<0.001), WA% 1.08 (95%CI 1.01 to 1.15; p<0.001) and Jacobian determinant 13.16 (95%CI 4.52 to 38.46; p<0.001). After adjustment for age, pack-years of smoking, FEV1, CT gas trapping, WA% and CT scanner type, CT emphysema was not associated with mortality (adjusted HR = 1.01, 95%CI 0.98 to 1.04; p =0.446). WA% and CT gas trapping were also not independently associated with mortality (adjusted HR = 1.05, 95%CI 0.96 to 1.14; p=0.315 and 1.01, 95%CI 0.98 to 1.04; p=0.424, respectively). After adjustment for age, pack-years of smoking, FEV1, CT emphysema, CT gas trapping, WA% and CT scanner type, the Jacobian determinant approached statistical significance for association with mortality (adjusted HR = 4.26, 95%CI = 0.93 to 19.23; p = 0.064).
Discussion
We demonstrated a strong relationship between the Jacobian determinant mean, a biomechanical elasticity measure of regional parenchymal volume change, and important patient outcomes including dyspnea, respiratory quality of life, functional capacity and the BODE index, and mortality. On multivariable analyses, we found that the effect size of a unit change in the Jacobian determinant is stronger than the effect sizes of static single-volume CT measures of COPD such as emphysema percentage, gas trapping and airway wall thickness, thus providing novel and independent information applicable to COPD phenotyping and prognosis.
It is well established that there is, at best, a modest correlation between FEV1, the primary measure of disease severity in COPD, and clinical outcomes such as respiratory health-related quality of life and dyspnea,19,20 and FEV1 does not fully explain the morbidity associated with COPD. In this regard, our findings extend the results of other recent studies that demonstrated a relationship between CT metrics of COPD and clinically relevant outcomes. Although lung function impairment is correlated with poor functional outcomes, SGRQ is influenced by a number of factors that are not fully explained by FEV1 such as cough and exacerbations. Grydeland and colleagues demonstrated that CT indices of emphysema and airway disease improved the prediction of respiratory symptoms over spirometry alone.4 Gietema et al. showed that both airway wall thickness and emphysema are independently associated with respiratory-quality of life, 6 and Martinez et al. reported that there was a stronger association between SGRQ and airway wall thickness than between SGRQ and CT emphysema.5 On the other hand, they also found that the BODE index was influenced more by emphysema than by airway wall thickness. Other studies have also found significant associations between measures of emphysema and airflow obstruction, exercise tolerance and dyspnea.2,3,7,8,21
The possible reasons for why the Jacobian determinant shows independent associations with outcomes merits discussion. FEV1 is a global measure of lung function impairment and is influenced by both airway narrowing and decreased lung elastic recoil associated with emphysema. However, in a given patient, it is usual to see multiple subtypes of emphysema such as centrilobular and panlobular emphysema with differential impact on lung function.22–24 The degree of CT emphysema does not translate linearly into airflow obstruction,3,10 and it is likely that different types and distribution patterns of emphysema contribute differentially to airflow obstruction.22–24 Although we did not study emphysema subtypes, the mean Jacobian determinant, by offering information of regional volume change with respiration, likely reflects a more direct physiologic link between structural lung disease and the lung mechanics reflected by spirometry. Previous studies found that imaging metrics offered marginal additional, albeit independent information, over that offered by spirometry in the prediction of respiratory quality of life. However, we showed that CT-based metrics derived from image-matching offer information that are not only independent and additive, but with effect sizes greater than FEV1 for all the outcomes studied. In addition, dyspnea contributes significantly to respiratory quality of life as well as reduction in functional capacity, and even patients with relatively preserved FEV1 can experience significant dyspnea and hence a poorer quality of life. This could be due to factors other than FEV1 such as poorer diaphragmatic position due to resting as well as dynamic hyperinflation, both of which might be reflected better by changes in regional volume change than by static single-volume CT measures of emphysema and airway disease. Our findings provide new insight into the complex pathophysiological basis and the heterogeneity of causes of changes in dyspnea and SGRQ. These findings are pertinent as dyspnea and SGRQ are frequently used as outcome measures in clinical trials of pharmacologic and non-pharmacologic therapies, once again highlighting the importance of phenotyping COPD patients.
We also showed that the Jacobian estimate of local lung volume change was significantly associated with the BODE index which predicts all-cause and respiratory-specific mortality in COPD.17 The association between mean Jacobian determinant and mortality approached statistical significance. This is a novel finding and adds to the findings of previous studies which demonstrated a relationship between CT emphysema and both the BODE index and mortality.5,9,25 Our findings are aligned with those of Martinez et al who found that CT emphysema was not associated with mortality,26 but are on contrast to those of Johannessen et al who found that patients with more severe emphysema are higher mortality compared to those with mild emphysema.9 It is unclear whether the poorer mechanics are a more sensitive reflector of underlying emphysema that has been shown to be independently associated with poor outcomes and mortality,27 or if the affected lung mechanics have an independent role in disease progression and mortality. Of note, lung volume reduction surgery improves symptoms and mortality in a subset of patients,28 and it is plausible that the benefits of lung volume reduction are largely due to improved lung elasticity in the ipsilateral preserved lobe.29
One of the limitations of our study is that the CT scans were not spirometrically controlled.30,31 As varying respiratory effort can affect the reproducibility of image-registration metrics, participants were coached to maximum inhalation and end expiration. As this was a multicenter trial, a number of different scanners were used for image acquisition; however, we adjusted for scanner variability. For calculating the Jacobian determinant, CT scans were obtained at only two volumes. Although this limited our ability to assess regional differences in lung mechanics along the entire spectrum of lung inflation and deflation,32 our metrics are applicable to clinically obtained scans without the excessive radiation risks that would incurred in acquiring dynamic scans. We did not have mortality data in some participants and this could have introduced some selection bias, however we had survival data on most participants. Our study was strengthened by the inclusion of participants enrolled in a large well characterized cohort of current and former smokers that included a high proportion of African Americans.
In conclusion, biomechanical metrics of local lung expansion and contraction offer better prediction of respiratory quality of life, the BODE index and mortality, and offer additional prognostic information beyond traditional measures of lung function and static single-volume CT metrics. Traditional CT measures have been used to phenotype COPD, and the implications of these phenotyping metrics have been assessed by correlating with relevant clinical outcomes. Thus, the Jacobian determinant, by offering additional information on lung disease in COPD, and by showing additional associations with clinically relevant outcomes, can add to our ability to phenotype COPD patients based on the complex pathophysiological heterogeneity that extends beyond lung function measures alone.
Supplementary Material
What is the key question?
Traditional metrics of lung disease such as spirometry and static single-volume CT images are used to explain respiratory morbidity in patients with chronic obstructive pulmonary disease (COPD). However, there is substantial discordance in individual patients between these metrics and respiratory morbidity. Can biomechanical measures of local lung expansion and contraction offer additional prognostic information in COPD?
What is the bottom line?
We demonstrate that biomechanical metrics of local lung expansion and contraction offer additional information beyond traditional measures of lung function and static single-volume CT metrics in the prediction of respiratory morbidity and all-cause mortality.
Why read on?
Independent prognostic information offered by biomechanical measures will help improve prognostication and phenotyping patients with COPD.
Acknowledgments
Funding Source: This study was supported by the COPDGene study (NIH Grant Numbers R01 HL089897 and R01 HL089856), 1K23HL133438-01 (SPB), R01 HL112986 (EAH) and R01 HL079406 (JMR).
Footnotes
Author Contributions: Study concept and design: Bhatt, Bodduluri and Reinhardt
Acquisition, analysis, or interpretation of data: All authors
Drafting of the manuscript: Bodduluri and Bhatt
Critical revision of the manuscript for important intellectual content: All authors
Statistical analysis: Bodduluri and Bhatt
Study supervision: All authors
Trial Registration: ClinicalTrials.gov: Identifier: NCT00608764
References
- 1.Han MK. Clinical correlations of computed tomography imaging in chronic obstructive pulmonary disease. Ann Am Thorac Soc. 2013;10(Suppl):S131–7. doi: 10.1513/AnnalsATS.201303-046AW. [DOI] [PubMed] [Google Scholar]
- 2.Schroeder JD, McKenzie AS, Zach JA, et al. Relationships between airflow obstruction and quantitative CT measurements of emphysema, air trapping, and airways in subjects with and without chronic obstructive pulmonary disease. AJR Am J Roentgenol. 2013;201(3):W460–70. doi: 10.2214/AJR.12.10102. [DOI] [PMC free article] [PubMed] [Google Scholar]
- 3.Bhatt SP, Sieren JC, Dransfield MT, et al. Comparison of spirometric thresholds in diagnosing smoking-related airflow obstruction. Thorax. 2014;69(5):409–14. doi: 10.1136/thoraxjnl-2012-202810. [DOI] [PMC free article] [PubMed] [Google Scholar]
- 4.Grydeland TB, Dirksen A, Coxson HO, et al. Quantitative computed tomography measures of emphysema and airway wall thickness are related to respiratory symptoms. Am J Respir Crit Care Med. 2010;181(4):353–9. doi: 10.1164/rccm.200907-1008OC. [DOI] [PubMed] [Google Scholar]
- 5.Martinez CH, Chen YH, Westgate PM, et al. Relationship between quantitative CT metrics and health status and BODE in chronic obstructive pulmonary disease. Thorax. 2012;67(5):399–406. doi: 10.1136/thoraxjnl-2011-201185. [DOI] [PMC free article] [PubMed] [Google Scholar]
- 6.Gietema HA, Edwards LD, Coxson HO, et al. Impact of emphysema and airway wall thickness on quality of life in smoking-related COPD. Respir Med. 2013;107(8):1201–9. doi: 10.1016/j.rmed.2013.04.016. [DOI] [PubMed] [Google Scholar]
- 7.Diaz AA, Bartholmai B, San Jose Estepar R, et al. Relationship of emphysema and airway disease assessed by CT to exercise capacity in COPD. Respir Med. 2010;104(8):1145–51. doi: 10.1016/j.rmed.2010.02.023. [DOI] [PMC free article] [PubMed] [Google Scholar]
- 8.Spruit MA, Watkins ML, Edwards LD, et al. Determinants of poor 6-min walking distance in patients with COPD: the ECLIPSE cohort. Respir Med. 2010;104(6):849–57. doi: 10.1016/j.rmed.2009.12.007. [DOI] [PubMed] [Google Scholar]
- 9.Johannessen A, Skorge TD, Bottai M, et al. Mortality by level of emphysema and airway wall thickness. Am J Respir Crit Care Med. 2013;187(6):602–8. doi: 10.1164/rccm.201209-1722OC. [DOI] [PubMed] [Google Scholar]
- 10.Bhatt SP, Bodduluri S, Newell JD, et al. CT-derived Biomechanical Metrics Improve Agreement Between Spirometry and Emphysema. Acad Radiol. 2016 doi: 10.1016/j.acra.2016.02.002. [DOI] [PMC free article] [PubMed] [Google Scholar]
- 11.Bodduluri S, Newell JD, Jr, Hoffman EA, et al. Registration-based lung mechanical analysis of chronic obstructive pulmonary disease (COPD) using a supervised machine learning framework. Acad Radiol. 2013;20(5):527–36. doi: 10.1016/j.acra.2013.01.019. [DOI] [PMC free article] [PubMed] [Google Scholar]
- 12.Regan EA, Hokanson JE, Murphy JR, et al. Genetic epidemiology of COPD (COPDGene) study design. Copd. 2010;7(1):32–43. doi: 10.3109/15412550903499522. [DOI] [PMC free article] [PubMed] [Google Scholar]
- 13.Vestbo J, Hurd SS, Agusti AG, et al. Global strategy for the diagnosis, management, and prevention of chronic obstructive pulmonary disease: GOLD executive summary. Am J Respir Crit Care Med. 2013;187(4):347–65. doi: 10.1164/rccm.201204-0596PP. [DOI] [PubMed] [Google Scholar]
- 14.Jones PW, Quirk FH, Baveystock CM. The St George’s Respiratory Questionnaire. Respir Med. 1991;85(Suppl B):25–31. doi: 10.1016/s0954-6111(06)80166-6. discussion 33–7. [DOI] [PubMed] [Google Scholar]
- 15.Mahler DA, Wells CK. Evaluation of clinical methods for rating dyspnea. Chest. 1988;93(3):580–6. doi: 10.1378/chest.93.3.580. [DOI] [PubMed] [Google Scholar]
- 16.Polkey MI, Spruit MA, Edwards LD, et al. Six-minute-walk test in chronic obstructive pulmonary disease: minimal clinically important difference for death or hospitalization. Am J Respir Crit Care Med. 2013;187(4):382–6. doi: 10.1164/rccm.201209-1596OC. [DOI] [PubMed] [Google Scholar]
- 17.Celli BR, Cote CG, Marin JM, et al. The body-mass index, airflow obstruction, dyspnea, and exercise capacity index in chronic obstructive pulmonary disease. N Engl J Med. 2004;350(10):1005–12. doi: 10.1056/NEJMoa021322. [DOI] [PubMed] [Google Scholar]
- 18.Ding K, Cao K, Fuld MK, et al. Comparison of image registration based measures of regional lung ventilation from dynamic spiral CT with Xe-CT. Med Phys. 2012;39(8):5084–98. doi: 10.1118/1.4736808. [DOI] [PMC free article] [PubMed] [Google Scholar]
- 19.Westwood M, Bourbeau J, Jones PW, et al. Relationship between FEV1 change and patient-reported outcomes in randomised trials of inhaled bronchodilators for stable COPD: a systematic review. Respir Res. 2011;12:40. doi: 10.1186/1465-9921-12-40. [DOI] [PMC free article] [PubMed] [Google Scholar]
- 20.Oga T, Nishimura K, Tsukino M, et al. Longitudinal deteriorations in patient reported outcomes in patients with COPD. Respir Med. 2007;101(1):146–53. doi: 10.1016/j.rmed.2006.04.001. [DOI] [PubMed] [Google Scholar]
- 21.Castaldi PJ, San Jose Estepar R, Mendoza CS, et al. Distinct quantitative computed tomography emphysema patterns are associated with physiology and function in smokers. Am J Respir Crit Care Med. 2013;188(9):1083–90. doi: 10.1164/rccm.201305-0873OC. [DOI] [PMC free article] [PubMed] [Google Scholar]
- 22.Kim WD, Eidelman DH, Izquierdo JL, et al. Centrilobular and panlobular emphysema in smokers. Two distinct morphologic and functional entities. Am Rev Respir Dis. 1991;144(6):1385–90. doi: 10.1164/ajrccm/144.6.1385. [DOI] [PubMed] [Google Scholar]
- 23.Saetta M, Kim WD, Izquierdo JL, et al. Extent of centrilobular and panacinar emphysema in smokers’ lungs: pathological and mechanical implications. Eur Respir J. 1994;7(4):664–71. doi: 10.1183/09031936.94.07040664. [DOI] [PubMed] [Google Scholar]
- 24.Sverzellati N, Lynch DA, Pistolesi M, et al. Physiologic and Quantitative Computed Tomography Differences between Centrilobular and Panlobular Emphysema in Copd. Chronic obstructive pulmonary diseases (Miami, Fla) 2014;1(1):125–32. doi: 10.15326/jcopdf.1.1.2014.0114. [DOI] [PMC free article] [PubMed] [Google Scholar]
- 25.Haruna A, Muro S, Nakano Y, et al. CT scan findings of emphysema predict mortality in COPD. Chest. 2010;138(3):635–40. doi: 10.1378/chest.09-2836. [DOI] [PubMed] [Google Scholar]
- 26.Martinez FJ, Foster G, Curtis JL, et al. Predictors of mortality in patients with emphysema and severe airflow obstruction. Am J Respir Crit Care Med. 2006;173(12):1326–34. doi: 10.1164/rccm.200510-1677OC. [DOI] [PMC free article] [PubMed] [Google Scholar]
- 27.Oelsner EC, Hoffman EA, Folsom AR, et al. Association between emphysema-like lung on cardiac computed tomography and mortality in persons without airflow obstruction: a cohort study. Ann Intern Med. 2014;161(12):863–73. doi: 10.7326/M13-2570. [DOI] [PMC free article] [PubMed] [Google Scholar]
- 28.Fishman A, Martinez F, Naunheim K, et al. A randomized trial comparing lung-volume-reduction surgery with medical therapy for severe emphysema. N Engl J Med. 2003;348(21):2059–73. doi: 10.1056/NEJMoa030287. [DOI] [PubMed] [Google Scholar]
- 29.Scharf SM, Rossoff L, McKeon K, et al. Changes in pulmonary mechanics after lung volume reduction surgery. Lung. 1998;176(3):191–204. doi: 10.1007/pl00007602. [DOI] [PubMed] [Google Scholar]
- 30.Fuld MK, Grout RW, Guo J, et al. Systems for lung volume standardization during static and dynamic MDCT-based quantitative assessment of pulmonary structure and function. Acad Radiol. 2012;19(8):930–40. doi: 10.1016/j.acra.2012.03.017. [DOI] [PMC free article] [PubMed] [Google Scholar]
- 31.Iyer KS, Grout RW, Zamba GK, et al. Repeatability and Sample Size Assessment Associated with Computed Tomography-Based Lung Density Metrics. Chronic obstructive pulmonary diseases (Miami, Fla) 2014;1(1):97–104. doi: 10.15326/jcopdf.1.1.2014.0111#sthash.nxTDeRi7.dpuf. [DOI] [PMC free article] [PubMed] [Google Scholar]
- 32.Jahani N, Yin Y, Hoffman EA, et al. Assessment of regional non-linear tissue deformation and air volume change of human lungs via image registration. J Biomech. 2014;47(7):1626–33. doi: 10.1016/j.jbiomech.2014.02.040. [DOI] [PMC free article] [PubMed] [Google Scholar]
Associated Data
This section collects any data citations, data availability statements, or supplementary materials included in this article.