Abstract
Despite the global prevalence of gastric disease, there are few adequate models to study the fundus epithelium of the human stomach. We differentiated human pluripotent stem cells (PSCs) into gastric organoids containing fundic epithelium by first identifying and then recapitulating key events in embryonic fundus development. We found that disruption of Wnt/β-catenin signaling in mouse embryos led to conversion of fundic to antral epithelium, while β-catenin activation in hPSC-derived foregut progenitors promoted the development of human fundic-type gastric organoids (hFGOs). We then used hFGOs to identify temporally distinct roles for multiple signaling pathways in epithelial morphogenesis and differentiation of fundic cell types, including chief cells and functional parietal cells. While hFGOs are a powerful new model for studying the development of the human fundus and its lineages, they also represent a critical new model system to study the molecular basis of human gastric physiology, pathophysiology, and drug discovery.
Introduction
Recently, considerable progress has been made in the development of three-dimensional in vitro organoid systems1,2. Organoids have proven to be powerful experimental models that combine architectural complexity and cellular diversity with the tractability and scalability of traditional cell culture methods. Organoid generation through directed differentiation of pluripotent stem cells (PSCs; comprising both embryonic stem cells and induced PSCs) offers several advantages over other approaches including an unlimited source of starting material, no requirement for surgical acquisition of tissue, and ease of genetic manipulations. Further, PSC-based methods permit direct investigation of mechanisms underlying normal and aberrant human development3. However, differentiating PSCs into specific organoid types depends on a robust molecular knowledge of normal organ development. For some organs, such as the stomach, there are large gaps in our understanding of molecular pathways that drive embryonic development.
The stomach is one of the most structurally diverse organs among mammals4. In humans, the gastric mucosa generally consists of two types of epithelial glands5,6. Located in the more proximal anatomic domains – the corpus and fundus – of the stomach, oxyntic glands comprise acid-secreting parietal cells, protease-producing chief cells, mucus-producing cells, and endocrine cells. Antral-type glands, located in the more distal antrum and pylorus, contain mostly mucous and endocrine cells. In order to simplify the anatomic- and species-specific systems of nomenclature, we will use the terms ‘fundus’ and ‘antrum’ to broadly describe these two histologic types of gastric epithelia. We previously developed a method to direct the differentiation of hPSCs into three-dimensional gastric tissue (human gastric organoids; hGOs) that contained a pure antral epithelium with normal antral cell types7. While the antral hGOs (hAGOs) are a robust system for studying antral lineage allocation and host-microbe interactions in the stomach, they do not allow for studies of fundic biology and disease. More recently, Noguchi et. al. successfully differentiated mouse ESCs into organoids comprising various types of mouse gastric tissue8. However, this approach used mouse ESC aggregation and spontaneous differentiation resulting in organoids that were heterogeneous, evidenced by the presence of stratified epithelia. Moreover, species differences make the mouse stomach suboptimal for modeling human gastric disease9. Thus, a robust and efficient PSC-derived model of the human fundus epithelium would represent a significant advance in the field of gastric biology.
Embryonic organ development is guided by a series of instructive cues between neighboring tissues10,11, and differentiation of hPSCs into specific lineages has relied heavily on use of these signals to direct differentiation in vitro. We previously identified a step-wise differentiation approach to generate hAGOs, whereby hPSCs were differentiated into definitive endoderm, patterned to posterior foregut, then specified into presumptive antral epithelium7. We hypothesized that the fundus and antrum derive from a common population of posterior foregut progenitors, which could be directed toward the fundic lineage if provided with the appropriate signals. However, given that the mechanisms that drive fundus development in vivo were not previously known, we first had to identify signaling pathways that pattern the embryonic stomach along the proximal-distal axis.
Embryonic stomach pattern formation
To aid investigation of the pathways that regulate fundus specification during embryonic development, we analyzed mouse embryos to identify molecular markers that could distinguish between presumptive fundus, antrum and forestomach. At E14.5 we found that Sox2 was expressed in all foregut organ lineages while Gata4 was restricted to the glandular stomach epithelium. Within the Gata4+ domain, Pdx1 was specific to the presumptive antral region (Extended Data Figure 1a); thus, the embryonic fundus domain is Sox2+Gata+Pdx1−. Further, we analyzed published microarray datasets (GSM326648-GSM32665012 and GSM80809-GMS8081613) and dissected regions of the E14.5 foregut to demonstrate that expression of the transcription factors Irx2, Irx3, and Irx5 was greater than ten-fold enriched in the embryonic fundus compared to antrum (Extended Data Figure 1b–c), indicating that their expression can further distinguish between regions of the glandular gastric epithelium.
At the molecular level, the presumptive fundic and antral domains of the stomach were already established by E10.5 (Figure 1a). At that point in development, the canonical Wnt signaling pathway was active in the proximal stomach but exhibited little or no activity in the distal stomach14, as shown using the Wnt reporter mouse strain Axin2-lacZ (Figure 1b). While the regulation of Wnt/β-catenin signaling is known to play a role in establishing the pyloric-duodenal boundary14,15, its role in gastric epithelial patterning had not been investigated. To determine whether Wnt/β-catenin signaling was functionally required for establishing the fundus in vivo, we deleted β-catenin (Ctnnb1) in the foregut epithelium using Shh-cre (Shh-cre;β-cateninfl/fl = cKO). Disruption of Wnt/β-catenin signaling resulted in the loss of fundic identity, demonstrated by ectopic Pdx1 expression in the fundus at E10.5 (Figure 1c). Ectopic Pdx1 was initially restricted to the ventral half of the fundic epithelium, consistent with previously reported recombination activity using this Shh-cre line16, but it then expanded over time to include a majority of the proximal stomach and greater curvature by E14.5 (Extended Data Figure 2a). Additionally, expression of the fundus markers Irx2, Irx3, and Irx5 were dramatically reduced in the cKO embryos (Extended Data Figure 2b). Collectively, these data support the conclusion that epithelial Wnt/β-catenin signaling regulates gastric pattern formation, as it is required for the initial specification of fundus identity while repressing antral fate in the embryonic mouse stomach.
Figure 1. Wnt/β-catenin signaling is required for specification of the embryonic fundus in mice.
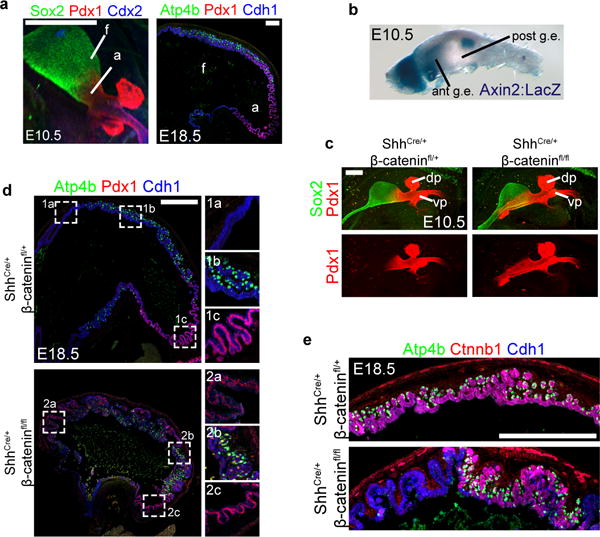
a, Pdx1 and Sox2 were expressed in the antrum (a), whereas Pdx1 was absent in the fundus (f), identified by Atp4b-expressing parietal cells at E18.5. b, X-gal staining of an E10.5 foregut from an Axin2:LacZ reporter embryo showed that Wnt activity was restricted to the anterior domain of the stomach but excluded from the posterior stomach. c, Deletion of β-catenin in the gastric epithelium caused an anterior expansion of Pdx1 into the fundic region of the stomach. d, In E18.5 Shh-cre;β-cateninfl/fl (cKO) embryos, Pdx1 was expressed throughout the stomach, except in some remaining patches of parietal cell-containing epithelium. Insets 1a-c and 2a-c show boxed regions in control and cKO stomach, respectively. e, In the cKO stomach, Ctnnb1 exhibited mosaic deletion, and parietal cells only differentiated in Ctnnb1-sufficient epithelium. Scale bars, 250 μm (a), 200 μm (c), and 500 μm (d and e).
To determine the impact of early Wnt/β-catenin-mediated patterning abnormalities on subsequent cytodifferentiation, we analyzed cKO embryos at E18.5. The stomach in cKO embryos was malformed and reduced in size at E18.5 (Figure 1d and Extended Data Figure 2c–d), suggestive of a role for Wnt/β-catenin in promoting stomach growth during late stages of development. Moreover, the cKO stomach was completely mis-patterned with ectopic Pdx1 expression throughout the proximal-most regions of the epithelium (Figure 1d). Parietal cells, a fundic cell type marked by expression of Atp4b, were reduced in the CKO stomach (Figure 1d) and completely absent in β-catenin deficient epithelium (Figure 1e). In contrast, the parietal cells that did develop were only observed in β-catenin-expressing epithelium (Figure 1e and Extended Data Figure 2d–e). Taken together, these in vivo data support a model by which Wnt/β-catenin signaling induces fundus specification and inhibits antral identity. Further, disruption of this early patterning coincides with subsequent cell autonomous loss of parietal cells, suggesting that cytodifferentiation is impaired secondary to developmental patterning defects.
Differentiation of fundic hGOs from hPSCs
We next investigated the role of Wnt/β-catenin signaling in establishing fundic-antral pattern of the developing human stomach. To model early stages of stomach differentiation, we started with a previously described protocol for differentiating hPSCs into antrum-like gastric organoids, which recapitulates the normal stages of early gastric development with high fidelity7. Starting with three-dimensional posterior foregut spheroids (SOX2+HNF1β+), we tested whether stimulation of Wnt/β-catenin signaling would direct posterior foregut epithelium into the fundic (SOX2+GATA+PDX1−) lineage rather than antrum (SOX2+GATA+PDX1+) during the gastric specification stage (Figure 2a). Indeed, activating β-catenin with the GSK3β inhibitor CHIR99021 (CHIR) for three days resulted in nearly complete repression of PDX1 at day 9, accompanied by significantly increased expression of IRX2, IRX3, and IRX5 (Figure 2b–c). Importantly, SOX2 and GATA4 levels were unaffected by CHIR treatment, confirming that spheroids retained their gastric identity. Thus, CHIR exposure resulted in formation of SOX2+GATA+PDX1− epithelium with increased IRX expression, a signature consistent with the presumptive fundic epithelium.
Figure 2. β-catenin activation promotes fundus development from human foregut progenitor spheroids.
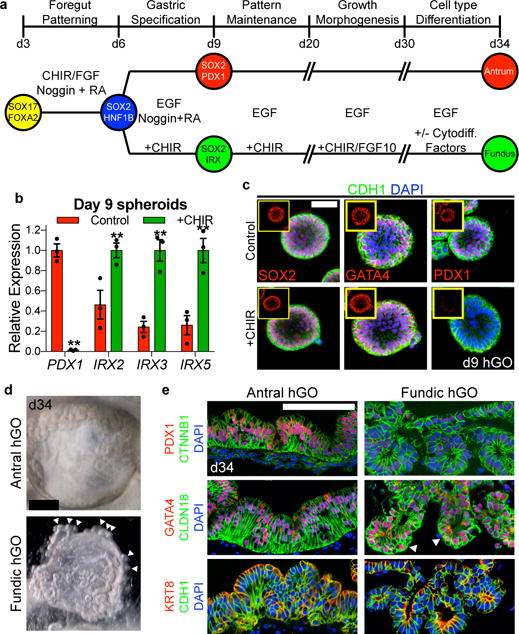
a, Schematized diagram of differentiation protocol for both fundic and antral hGOs. b, c, At day 9, CHIR-treated organoids exhibited reduction in PDX1, increase in IRX2, IRX3, and IRX5, and no change in gastric markers SOX2 or GATA4. *, p<0.05; two-tailed Student’s t-test; n=3 biological replicates, data representative of 4 independent experiments. d, hFGOs grew comparably to hAGOs, but also exhibited glandular budding morphogenesis (white arrowheads). e, Both hGOs contained epithelium that expressed CDH1, KRT8, and CTNNB1, as well as gastric markers GATA4 and CLDN18. hAGOs exhibited nearly ubiquitous PDX1 expression while hFGOs did not. Scale bars, 50 μm (c), 500 μm (d) and 100 μm (e). Error bars represent s.e.m.
We then sought to determine whether CHIR-treated spheroids would further develop into more mature hGOs containing a fundus-like epithelium. Interestingly, a three-day pulse of CHIR from days 6–9 was not sufficient to irreversibly specify a fundic identity, as the hGOs ultimately reverted to a PDX1+ antral phenotype at later stages. However, continued Wnt stimulation via CHIR treatment through at least day 29 led to stable induction of fundic gene expression (Extended Data Figure 3a). This was consistent with the prolonged activity of Wnt/β-catenin signaling during embryonic stomach development in vivo. Although previous studies indicated that ectopic Wnt activation in the embryonic stomach promoted intestinal fate14,15, CHIR-treated hGOs did not exhibit a significant increase in intestinal markers CDX2, MUC2, CCK, or SCT (Extended Data Figures 3e and 4a–b). We further demonstrated that CDX2 remained suppressed despite Wnt/β-catenin activation due to concomitant inhibition of BMP signaling, as replacing Noggin with BMP4 led to robust expression of the intestinal transcription factor (Extended Data Figure 4c).
Once regional domains are established in early development, the primitive gastric epithelium undergoes periods of growth, glandular morphogenesis, and differentiation of definitive cell types. We previously showed that hAGOs underwent a similar progression of morphologic and cellular development7. CHIR-treated hFGOs grew at a similar rate and efficiency compared to hAGOs, as 75–90% of all spheroids plated grew into organoids (Extended Data Figure 3d). At day 20, both types of hGOs contained epithelia that expressed the gastric SOX2/GATA4 signature in >90% of cells, while PDX1 was restricted to hAGOs (87.1 ± 8.4% in hAGOs and 3.9 ± 2.0% in hFGOs, p=3.07×10⁻⁶; Extended Data Figure 3e). The organoids maintained their respective gastric identities throughout their development (Extended Data Figure 3b–c). By day 34, hFGOs and hAGOs comprised CDH1+CTNNB1+KRT8+ polarized, columnar epithelia that ubiquitously expressed the gastric-specific17 claudin CLDN18 (Figure 2e and Extended Data Figure 4d), as well as comparable undifferentiated mesenchymal cells (Extended Data Figure 5b). One notable difference was that hFGOs had a distinctive architecture with organized glands that bud from the organoid epithelium (Figure 2d–e and Extended Data Figure 5a), while hAGOs had complex folding and primitive gland-like organization but rarely glandular buds7. Thus, the novel Wnt/β-catenin dependent mechanism of specifying fundus is conserved in humans and can be manipulated to generate three-dimensional hFGOs with a glandular epithelium that molecularly resembles the developing fundus.
Region-specific gastric cytodifferentiation
Differentiated antral gastric cell types were first detected in hAGOs around day 27 and then increased by day 347, analogous to the first few weeks of postnatal development in the mouse stomach18. At day 34, hFGOs contained both MUC5AC+ surface mucous cells and MUC6+ mucous neck cells as expected, similar to the hAGOs (Figure 3a–b and Extended Data Figure 6a). hFGOs also formed a variety of endocrine cell types (Figure 3c), but expression of the hormone GAST was specific to hAGOs while GHRL was enriched 10-fold in hFGOs (Figure 3d), consistent with the normal gastroendocrine pattern19. To functionally define the region-specific competence of hGOs, we used an inducible system to over-express the proendocrine transcription factor NEUROG3. Expression of NEUROG3 in both hGO subtypes resulted in robust expression of the pan-endocrine marker SYP, as well as the common gastric hormones SST and GHRL (Extended Data Figure 6c). However, only the hAGOs and not hFGOs were competent to give rise to GAST-expressing G-cells (Figure 3e and Extended Data Figure 6c), consistent with the antrum-specific distribution of G-cells in the human stomach19.
Figure 3. Differentiation of mucous and endocrine cell lineages in hGOs.
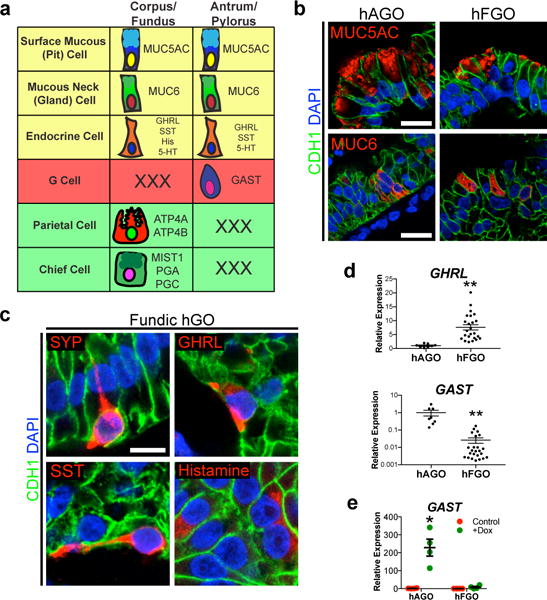
a, Schematic of the shared and distinct lineages found in fundic and antral glands of the stomach. b, Both antral and fundic hGOs contained MUC5AC-positive surface mucous cells and MUC6-positive mucous neck cells. c, d, hFGOs contained endocrine cells expressing the pan-endocrine marker SYP. Diverse hormone cell types were identified in hFGOs, including GHRL-, SST-, and histamine-expressing endocrine cells. The antral-specific G-cell marker GAST was expressed in hAGOs but not hFGOs; conversely, GHRL was enriched in hFGOs. **, p<0.01; two-tailed Student’s t-test; n=8 and 24 biological replicates in hAGOs and hFGOs respectively, data representative of 6 independent experiments. e, hAGOs, but not hFGOs, were competent to give rise to antral-specific GAST-expressing endocrine cells in response to expression of the pro-endocrine transcription actor NEUROG3 (+dox). *, p<0.01; two-tailed Student’s t-test; n=4 biological replicates, data representative of 3 independent experiments. Error bars represent s.e.m.
Chief cells, the fundus-specific secretory lineage, reside in the base of oxyntic glands and have been proposed as a type of reserve stem cell20. hFGOs exhibited epithelial expression of the chief cell-specific21 transcription factor MIST1 (Figure 4a), had 100–1,000-fold increases in transcripts for the proenzymes PGA5 and PGC (Figure 4c), and contained significantly increased pepsinogen content measured by ELISA (Figure 4e). However the transcript levels were less than 1% those found in the adult human stomach (Extended Data 6d) and pepsinogen-positive cells were only rarely detectable by immunohistochemistry (Figure 4b–c). Consistent with this, zymogen granule-containing cells22 were identified by TEM (Figure 4d) but were rare. In contrast, cells with a more immature mucous granule pattern were abundant (Extended Data Figure 6b). Since chief cells in vivo do not exhibit robust pepsinogen expression for the first few weeks of life (Extended Data Figure 7a–b), we conclude that the chief cells were present in hFGOs but were immature. hFGOs therefore represent a robust platform to dissect the intrinsic and extrinsic mechanisms that regulate chief cell maturation.
Figure 4. Formation of chief cells in hFGOs.
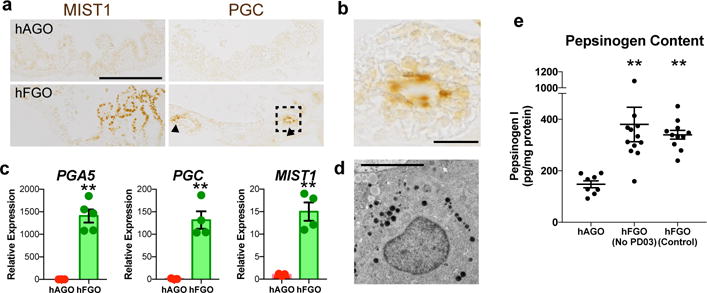
a, hFGOs had a both MIST1 and Pepsinogen C (PGC) positive cells. b, High magnification of boxed region in panel (a) showing a gland with a cluster of cells with apical PGC staining. c, hFGOs had significantly increased expression of chief cell markers PGA5 (1,000-fold), PGC (100-fold), and MIST1 (>10-fold) as compared to hAGOs. **, p<0.05; two-tailed Student’s t-test. n=3 biological replicates, data representative of 4 independent experiments. d, Transmission electron micrograph of an hFGO cell containing dense zymogen granules, indicative of a chief cell. e, Pepsinogen protein content in hFGOs as compared to hAGOs in the presence or absence of the MEK inhibitor (PD03). **, p<0.0001 compared to hAGOs, two-tailed Student’s t-test, n=8, 12, and 11 biological replicates in hAGOs, control hFGOs and hFGOs (no PD03), respectively. Scale bars, 200 μm (a), 25 μm (b), and 10 μm (d). Error bars represent s.e.m.
Pathways controlling parietal cell differentiation
At baseline, hFGOs contained only a small number of parietal cells (PCs; Figure 5a–b), the defining cell type of fundic glands that acidify the gastric lumen via the proton pump (consisting of ATP4A and ATP4B subunits). Identification of efficient methods to increase PC populations has remained elusive due to a lack of understanding of the signaling mechanisms that drive their development. We therefore used PSC-derived hFGOs as a platform to functionally screen candidate signaling pathways for a role in regulating PC differentiation. For screening, we exposed day 30 hFGOs to signaling agonists or antagonists for two days and analyzed PC differentiation at day 34. While the majority of signaling manipulations had no appreciable effect, transient inhibition of the MEK pathway with PD0325901 (PD03) resulted in substantial up-regulation of both ATP4A and ATB4B (Extended Data Figure 8a). Further, while BMP4 alone did not affect PC gene expression, it could enhance the effect of PD03 (data not shown). Thus, a two-day pulse of PD03/BMP4 was sufficient to induce rapid and robust expression of PC markers ATP4A, ATP4B and GIF (Figure 5a–b and Extended Data Figure 8d). Interestingly, this effect was not observed by simply removing EGF or FGF from the culture medium (Extended Data Figure 8b), suggesting that there are likely endogenous signaling interactions upstream of MEK/ERK that are responsible for limiting PC differentiation in hFGO cultures. Further, PD03/BMP4 treatment only affected the PC lineage (Extended Data Figure 8e), and was unable to induce PCs in hAGOs (Extended Data Figure 8c), further emphasizing that early patterning of the gastric epithelium defines its ultimate differentiation potential.
Figure 5. Identification of pathways that drive differentiation of functional parietal cells in hFGOs.
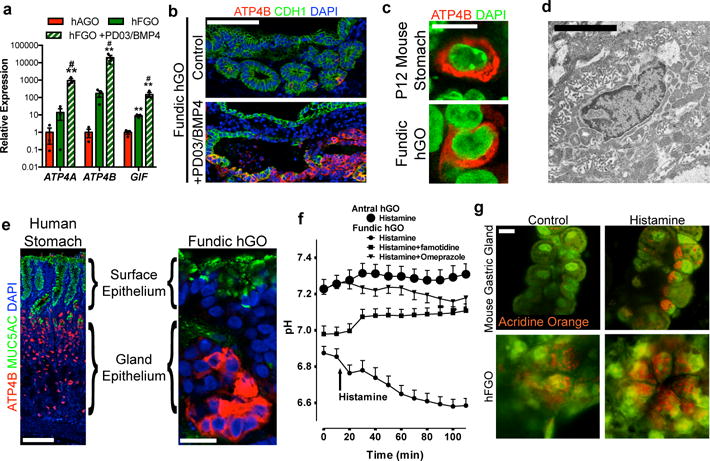
a, Expression of parietal cell genes ATP4, ATP4B, and GIF exhibited 10–100-fold increase in hFGOs compared to antral at baseline, but was dramatically increased by exposing hFGOs to a two-day pulse of PD03/BMP4. **, p<0.05 compared to hAGOs; #, p<0.05 compared to control hFGOs, two-tailed Student’s t-test, n=4 biological replicates, data representative of 15 independent experiments. b, Stimulated differentiation of ATP4B-expressing parietal cells following treatment with PD03/BMP4. c, hFGO-derived parietal cells resembled those found in the maturing mouse fundic epithelium in vivo. d, Transmission electron micrograph of an hFGO cell with canalicular structure reminiscent of parietal cells. e, The epithelium of human fundic glands and hFGO epithelium were organized into MUC5AC-expressing cells in the surface epithelium and ATP4B-expressing parietal cells in the glandular units. f, Analysis of luminal pH in organoids in response to histamine by luminal injection of SNARF-5F. The luminal pH in hFGOs rapidly dropped, while hAGOs exhibited no response. The acidification was blocked by pretreating the organoids with either famotidine or omeprazole. n=9, 9, 7, and 4 biological replicates in hFGOs (histamine), hFGOs (histamine and famotidine), hFGOs (histamine and omeprazole), and hAGOs (histamine), respectively; data representative of three independent experiments. g, Histamine induced acridine orange (AO) dye accumulation in a canalicular-type pattern in isolated mouse gastric glands and in hFGOs after 60 minutes. Scale bars, 100 μm (b), 10 μm (c), 10 μm (d), 100 μm (e; human fundus), 20 μm (e; hFGO), and 10 μm (g). Error bars represent s.e.m.
At day 34 hFGO epithelia exhibited comparable organization to the human stomach, with mucous cells lining the surface domain and PCs concentrated in the glandular portion (Figure 5e). Moreover, parietal cell morphology closely resembled maturing parietal cells in vivo (Figure 5c). Given their resemblance to PCs in vivo and their tubulovesicular ultrastructure as seen on TEM (Figure 5d), we hypothesized that the PCs in hFGOs would exhibit the ability to secrete acid in response to appropriate stimuli. Measured using a pH sensitive dye (SNARF5F) with real time confocal microscopy (Extended Data Figure 9a), hFGOs produced a swift and marked decrease in luminal pH in response to histamine that was blocked by either the H2 antagonist famotidine or the H+K+-ATPase antagonist omeprazole (Figure 5f and Extended Data Figure 9b). To visualize the cellular response to histamine, hGOs were cultured with the fluorescent dye acridine orange (AO), which shifts to an orange color when sequestered in acidic compartments23. Similar to isolated mouse gastric glands, AO accumulated in acidified cellular vesicles in hFGO glands in response to histamine (Figure 5g and Extended Data Figure 9c–d). These data indicate that the PCs underwent appropriate changes in secretory canalicular structure in response to acid-inducing stimuli.
In vivo, differentiated gastric cell lineages are thought to derive from a common pool of undifferentiated stem or progenitor cells. Here we have demonstrated the ability to alter the relative proportions of cell types in hFGOs, either through genetic means (NEUROG3-mediated regulation of endocrine cells) or by manipulation of extrinsic signaling pathways (PD03/BMP4 for PCs). These observations led to the hypothesis that hFGOs might contain a population of gastric stem cells analogous to those that have been isolated from the adult stomach. Indeed, we found that dissociated day 34 hFGOs could be passaged serially to give rise to new organoids (Extended Data Figure 10a–b). Re-growth of organoids from passaged hFGOs was dependent on high Wnt and high FGF culture medium, similar to what is used to grow primary gastric tissue organoids24,25. Following two rounds of passaging, hFGOs maintained expression of lineage markers MUC5AC, MUC6, PGC, and GHRL; however, they did not contain PCs and were refractory to PD03/BMP4-mediated induction of the parietal lineage (Extended Data Figure 10c–d). This finding was similar to what has been observed in adult stem cell-derived gastric organoids, which do not robustly produce PCs despite being derived from the bona fide oxyntic mucosa20,26. Thus it will be important to identify conditions that preserve PC competence in long-term cultures of hGOs and adult gastric organoids.
In summary, this is one of the first examples in which combined in vivo and in vitro discovery-based studies have been directly applied towards the differentiation of hPSCs into a new tissue type. We have defined a novel function of Wnt/β-catenin signaling in specifying the fundic domain during stomach development in mice, and used Wnt modulation as the mechanistic basis to direct differentiation of hPSCs into three-dimensional human fundic organoids. In both mouse and human, Wnt-mediated fundus specification was required for the subsequent formation of PCs. The fundus-specific manipulations at each stage of this directed differentiation protocol were essential to robust PC induction (Extended Data Figure 8f), emphasizing the importance of methodically reproducing the embryonic signaling environment. Previous reports identified that the mesenchymal factor Barx1 indirectly acts to repress Wnt signaling and that helps to prevent intestinal gene expression in the stomach14,15. Given that the current study identified an epithelial Wnt/β-catenin function, and the previous work identified a mesenchymal pathway, it seems likely that Wnt/β-catenin may have distinct roles in the epithelium versus mesenchyme. For example, the mesenchymal role for Wnt/β-catenin could modulate other signaling pathways such as BMP27, which our data show synergizes with Wnt to promote intestinal specification from early endoderm (7 and Extended Data Figure 4c) The human gastric organoid systems might be useful, in combination with animal models, to dissect how these signaling pathways interact in the mesenchyme and epithelium to coordinate early embryonic gastrointestinal development.
Pathways that control differentiation of gastric progenitor cells into distinct lineages are also lacking. We demonstrated the utility of this new hGO platform to identify that MEK/ERK signaling potently represses parietal cell specification. Consistent with these findings, transgenic activation of MEK/MAPK-dependent pathways led to loss of parietal cells in vivo28,29. Therefore, hGOs are a new and tractable human model system to identify and study signaling mechanisms involved in normal cellular homeostasis in the fundus and antrum. Further, aberrant regulation of developmental programs may also contribute to gastric disease, as corpus/fundus pathology is often associated with parietal cell atrophy30–32, antral-type histology33, and even misexpression of Pdx134. Thus targeting of these pathways could have clinical utility, as Choi et. al. recently demonstrated that pharmacologic inhibition of MEK was sufficient to restore normal parietal cell differentiation in a mouse model of metaplasia35. Additionally, having now established both antral- and fundic-type hGOs, it is possible to study how these human gastric tissues interact physiologically, differentially respond to infection and injury, and respond to pharmacologic treatments.
Methods
Mouse experiments
The following genetic mouse strains were obtained from The Jackson Laboratory, housed at Cincinnati Children’s Hospital Research Foundation animal facility, and maintained according to IACUC protocol (0B09074): Axin2:LacZ (stock no. 009120), Shh:Cre (stock no. 005622), and β-cateninfloxed (stock no. 004152). Timed matings, with the morning the vaginal plug was observed being denoted as E0.5, were used to generate embryos at various stages that were harvested for either wholemount staining or tissue dissection. At least two litters of embryos were analyzed at each developmental stage examined. Both male and female embryos were analyzed.
Pluripotent stem cell culture
Human embryonic stem cell line WA01 (H1; obtained from WiCell) was supplied by the Pluripotent Stem Cell Facility at Cincinnati Children’s Hospital Medical Center. Cell identity was confirmed by short tandem repeat analysis (Microsatellite STR Analysis; Applied Biosystems), and cells were routinely tested for mycoplasma contamination (MycoAlert Mycoplasma Detection Kit; Lonza). Pluripotent cells were maintained in feeder-free conditions on HESC-qualified Matrigel (BD Biosciences) in mTesR1 media (Stem Cell Technologies). Colonies were passaged every four days using dispase (Invitrogen).
Differentiation of posterior foregut spheroids
The protocol for directed differentiation of gastric organoids was adapted from our previous protocol7, and Supplementary Table 1 contains the complete list of media and growth factors for each stage. For differentiation, hPSCs were dissociated into single cells using Accutase (Stem Cell Technologies) and plated into 24-well plates at a density of roughly 200,000 cells per well in mTesR1 with Y-27632 (10 μM; Stemgent). The following day, cells were differentiated into definitive endoderm (DE) by adding Activin A (100 ng/ml; Cell Guidance Systems) in RPMI 1640 media (Invitrogen) for three days. Media was also supplemented with NEAA (1×; Gibco) and defined FBS (dFBS; Invitrogen) at 0%, 0.2%, and 2.0% on days 1, 2, and 3, respectively. Additionally, BMP4 (50 ng/ml; R&D Systems) was added on the first day. Subsequently, DE was differentiated to posterior foregut endoderm by exposing cells to CHIR99021 (2 μM; Stemgent), FGF4 (500 ng/ml; R&D Systems), and Noggin (200 ng/ml; R&D systems) for three days in RPMI 1640 supplemented with NEAA and 2.0% dFBS. Retinoic acid (2 μM; Sigma Aldrich) was added for the final day. Media was changed every day. This process resulted in the spontaneous formation of three-dimensional posterior foregut spheroids.
Three-dimensional culture of foregut spheroids-gastric organoids
Posterior foregut spheroids were collected and transferred to a three-dimensional culture system as previously described36. Briefly, spheroids were suspended in 50 μl Matrigel (BD Biosciences) and plated as a droplet into 24-well plates. The matrigel was allowed to solidify for 10 minutes in the tissue culture incubator, then overlayed with basic gut media (BGM) containing growth factors and/or small molecule agonsists. BGM consisted of Advanced DMEM/F12 media (Gibco) supplemented with N2 (1×; Invitrogen), B27 (1×; Invitrogen), HEPES (10 μM; Gibco), L-glutamine, penicillin/streptomycin, and EGF (100 ng/ml; R&D Systems). During days 6–9, spheroids were cultured with RA and noggin to specify the antral lineage. For fundic specification, CHIR was added during this stage. Antral hGOs were subsequently cultured in BGM with only EGF. Fundic hGOs were continuously exposed to CHIR from day 6–30. In addition, FGF10 (50 ng/ml; R&D Systems) was added to fundic hGOs from day 20–30 as it was shown to enhance the glandular morphogenesis driven by CHIR (data not shown). On day 20, organoids were collected and re-plated at a dilution of 1:10–1:20.
For screening experiments to identify factors that increase parietal cell differentiation, hFGOs were grown to day 30, then exposed for two days to individual signaling pathway agonists and antagonists: DAPT (1 μM; Stemgent), SB431542 (10 μM; Stemgent), BMP4 (50 ng/ml; R&D Systems), PD0325901 (2 μM; Stemgent), Gastrin (10 nM; Sigma Aldrich), Dexamethasone (50 nM; Sigma Aldrich), and Wnt5a (50 ng/ml; R&D Systems). Following treatment, hFGOs were grown for two more days to day 34, then analyzed by qPCR.
RNA isolation and qPCR
Total RNA was isolated using Nucleospin RNA II kit (Machery Nagel) and converted to cDNA as previously described7. qPCR was performed on Quantstudio 6 (Applied Biosystems) using Quantitect SYBR-Green master mix (Qiagen), and primer sequences are listed below.
Primer Sequences
Primers used for qPCR were the following: hATP4A, forward 5′-TGGTAGTAGCCAAAGCAGCC-3′, reverse 5′-TGCCATCCAGGCTAGTGAG-3′; hATP4B, forward 5′-ACCACGTAGAAGGCCACGTA-3′, reverse 5′-TGGAGGAGTTCCAGCGTTAC-3′; hAXIN2, forward 5′-CTGGTGCAAAGACATAGCCA-3′, reverse 5′-AGTGTGAGGTCCACGGAAAC-3′; hCCK, forward 5′-CGGTCACTTATCCTGTGGCT-3′, reverse 5′-CTGCGAAGATCAATCCAGCA-3′; hCDX2, forward 5′-CTGGAGCTGGAGAAGGAGTTTC-3′, reverse 5′-ATTTTAACCTGCCTCTCAGAGAGC-3′; hCHGA, forward 5′-TGACCTCAACGATGCATTTC-3′, reverse 5′-CTGTCCTGGCTCTTCTGCTC-3′; hGAPDH, forward 5′-CCCATCACCATCTTCCAGGAG-3′, reverse 5′-CTTCTCCATGGTGGTGAAGACG-3′; hGAST, forward 5′-CAGAGCCAGTGCAAAGATCA-3′, reverse 5′-AGAGACCTGAGAGGCACCAG-3′; hGATA4, forward 5′-TCCAAACCAGAAAACGGAAGC-3′, reverse 5′-GCCCGTAGTGAGATGACAGG-3′; hGHRL, forward 5′-GCTGGTACTGAACCCCTGAC-3′, reverse 5′-GATGGAGGTCAAGCAGAAGG-3′; hGIF, forward 5′-CATTTTCCGCGATATTGTTG-3′, reverse 5′-GCACAGCGCAAAAATCCTAT-3′; hIRX2, forward 5′-GTGGTGTGCGCGTCGTA-3′, reverse 5′-GGCGTTCAGCCCCTACC-3′; hIRX3, forward 5′-GGAGAGAGCCGATAAGACCA-3′, reverse 5′-AGTGCCTTGGAAGTGGAGAA-3′; hIRX5, forward 5′-GGTGTGTGGTCGTAGGGAGA-3′, reverse 5′-GCTACAACTCGCACCTCCA-3′; hMIST1, forward 5′-TGCTGGACATGGTCAGGAT-3′, reverse 5′-CGGACAAGAAGCTCTCCAAG-3′; hMUC2, forward 5′-TGTAGGCATCGCTCTTCTCA-3′, reverse 5′-GACACCATCTACCTCACCCG-3′; hMUC5AC, forward 5′-CCAAGGAGAACCTCCCATAT-3′, reverse 5′-CCAAGCGTCATTCCTGAG-3′; hMUC6, forward 5′-CAGCAGGAGGAGATCACGTTCAAG-3′, reverse 5′-GTGGGTGTTTTCCTGTCTGTCATC-3′; hPDX1, forward 5′-CGTCCGCTTGTTCTCCTC-3′, reverse 5′-CCTTTCCCATGGATGAAGTC-3′; hSCT, forward 5′-GGTTCTGAAACCATAGGCCC-3′, reverse 5′-GTCAGGGTCCAACATGCC-3′; hSOX2, forward 5′-GCTTAGCCTCGTCGATGAAC-3′, reverse 5′-AACCCCAAGATGCACAACTC-3′; mCdx2, forward 5′-TCTGTGTACACCACCCGGTA-3′, reverse 5′-GAAACCTGTGCGAGTGGATG-3′; mGata4, forward 5′-CCATCTCGCCTCCAGAGT-3′, reverse 5′-CTGGAAGACACCCCAATCTC-3′; mGapdh, forward 5′-TTGATGGCAACAATCTCCAC-3′, reverse 5′-CGTCCCGTAGACAAAATGGT-3′; mIrx1, forward 5′-AATAAGCAGGCGTTGTGTGG-3′, reverse 5′-CTCAGCCTCTTCTCGCAGAT-3′; mIrx2, forward 5′-AGCTGGTATGGATAGGCCG-3′, reverse 5′-GGCTTCCCGTCCTACGTG-3′; mIrx3, forward 5′-ATAAGACCAGAGCAGCGTCC-3′, reverse 5′-GTGCCTTGGAAGTGGAGAAA-3′; mIrx5, forward 5′-GGAGTGTGGTCGTAGGGAGA-3′, reverse 5′-GCTACAACTCGCACCTCCA-3′; mPdx1, forward 5′-ACGGGTCCTCTTGTTTTCCT-3′, reverse 5′-TGGATGAAATCCACCAAAGC-3′; mPitx1, forward 5′-GTCCATGGAGGTGGGGAC-3′, reverse 5′-GCTTAGGCGCCACTCTCTT-3′; mSox2, forward 5′-AAAGCGTTAATTTGGATGGG-3′, reverse 5′-ACAAGAGAATTGGGAGGGGT-3′; mTrp63, forward 5′- AGCTTCTTCAGTTCGGTGGA-3′, reverse 5′- CCTCCAACACAGATTACCCG-3′.
Immunofluorescent staining
Tissues were fixed in 4% paraformaldehyde overnight at 4°C, then washed thoroughly in PBS. For wholemount immunofluorescent staining, embryos were processed as previously described37. Briefly, they were permeabilized in Dent’s Bleach (4:1:1 EtOH: DMSO: 30% H2O2) for two hours at room temperature and rehydrated through series of methanol washes. Embryos were then blocked for one hour, incubated in primary antibody overnight at 4°C, washed in PBS, incubated in primary antibody overnight at 4°C, and thoroughly washed. For paraffin embedding, tissues were dehydrated through series of ethanol washes, washed in xylene, then embedded in paraffin. For staining, slides were deparaffinized and rehydrated. Antigen retrieval was performed in citrate buffer for 45 minutes in steamer. Primary antibodies were incubated overnight at 4°C. Following primary antibody, slides were washed in PBS then incubated with secondary antibody (at dilution of 1:500) for one hour at room temperature. Secondary antibodies (Jackson ImmunoResearch Laboratories) were made in donkey and conjugated to Alexa Fluor 488, 594, or 647.
Primary antibodies
Antibodies used for immunofluorescent staining are listed with antigen, host species, manufacturer and catalogue number, and dilution used for staining. Atp4b, rabbit, Santa Cruz sc84304, 1:500; Cdh1, goat, R&D Systems AF648, 1:500; Cdh1, mouse, BD Biosciences 610182, 1:500; Cdx2, mouse, Biogenex MU392A, 1:500, Cldn18, rabbit, Sigma HPA018446, 1:200; Ctnnb1, rabbit, Santa Cruz sc7190, 1:100; FoxF1, goat, R&D Systems F4798, 1:500, Gastrin, rabbit, Dako A0568, 1:1,000; Gata4, goat, Santa Cruz sc1237, 1:200; Gif, rabbit, Sigma HPA040774, 1:100; Ghrl, goat, Santa Cruz sc10368, 1:200; Histamine, rabbit, Immunostar 22939, 1:1,000; Krt8, rat, DSHB troma-1-s; 1:100; Mist1, rabbit, Sigma HPA047834, 1:200; Muc5ac, mouse, Abcam ab3649, 1:500; Muc6, mouse, Abcam ab49462, 1:100; Pdx1, goat, Abcam ab47383, 1:5,000; Pgc, sheep, Abcam ab31464, 1:10,000; Sst, goat, Santa Cruz sc7819, 1:100; Syp, guinea pig, Synaptic Systems 101004, 1:1,000; Vimentin, goat, Santa Cruz sc7557, 1:200
Imaging
Confocal imaging was performed on Nikon A1Rsi inverted confocal microscope. For wholemount imaging, embryos were dehydrated in methanol and cleared in Murray’s clear (2:1 benzyl benzoate: benzyl alcohol) just prior to imaging. After staining, slides were mounted with Fluoromount G (SouthernBiotech), and air-dried overnight at room temperature.
Transmission electron microscopy
For TEM, hGOs were processed as previously described7. Briefly, organoids were fixed in 3% glutaraldehyde, washed in 0.1 M sodium cacodylate buffer, and incubated for one hour 4% osmium tetroxide. They were subsequently washed then dehydrated in ethanol series, and finally embedded in propylene oxide/LX112. Tissue was then sectioned and stained with 2% uranyl acetate followed by lead citrate. Images were visualized on Hitachi transmission electron microscope.
Pepsinogen ELISA
ELISA was performed using the Human Pepsinogen I (PGI) ELISA Kit (Thermo Scientific, EHPGI) according to manufacturer’s instructions. Briefly, day 34 hGOs were collected and incubated in Cell Recovery Solution (Corning) for one hour at 4°C then washed in PBS. Organoids were lysed with RIPA buffer followed by vigorous vortexing at high velocity for 30 minutes at room temperature. Lysates were pelleted and supernatant was collected and stored at −80°C. For ELISA, the samples and standards were performed in technical replicates. The reactions were measured on μQuant microplate plate reader (Bio Tek). Absorbance at 450 nm was measured, and the 570 nm absorbance was subtracted.
Acid secretion assays
Acid secretion assays were performed as previously described (Schumacher et al., 2015). hGOs were grown in the chambered coverglass (Thermo Scientific) and the chamber was placed on an inverted confocal microscope (Zeiss LSM 710), and experiments were performed under 5% CO2 and 37°C conditions (incubation chamber, PeCon, Erbach, Germany).
Freshly isolated mouse gastric fundic glands or cultured hGO were incubated with acridine orange (10 μM), then acridine orange fluorescence was excited at 458 nm or 488 nm and images were collected at 600–650 nm (Red) or 500–550 nm (Green), respectively. On the other hand, to monitor hGOs luminal pH, the ratiometric pH sensitive dye, 5-(and-6)-carboxy SNARF-5F (5mM stock: EX 560 nm, EM 565–605 (Green) and 620–680 (Red) nm: Invitrogen) was microinjected (46–92 nl) into the lumen and monitored. Fluorescent dye also added into medium. Histamine (100 μM; Sigma) was added to media, while famotidine (100 μM; Sigma) or omeprazole (100 μM; Sigma) were pre-incubated at least 30 min before histamine. Images were analyzed using MetaMorph software (Molecular Devices, Downingtown, PA). Background corrected 620-680/565-605 nm ratio values were converted to pH using a standard curve.
Statistical analysis
Statistical significance was determined using unpaired Student’s T-test or one-way ANOVA with Dunnett’s multiple comparison post-hoc test. A p value of < 0.05 was considered significant.
Statistics and experimental reproducibility
No statistical analysis was used to determine experimental sample size, no specific method of randomization was used, and the investigators were not blinded during experiments. Statistical methods and measures are described in figure legends. The protocol for differentiation of fundic hGOs was successfully completed >20 times by seven independent users in the laboratory. In all cases, data shown are derived from a single experiment that is representative of multiple experiments.
Data Availability Statement
The source data for the figures 2, 3, 4, 5 and extended data figures 2, 4, 5, 6, 8, 9, and 10 can be found in the supplementary information.
Extended Data
Extended Data Figure 1. Defining molecular domains in the developing stomach in vivo.
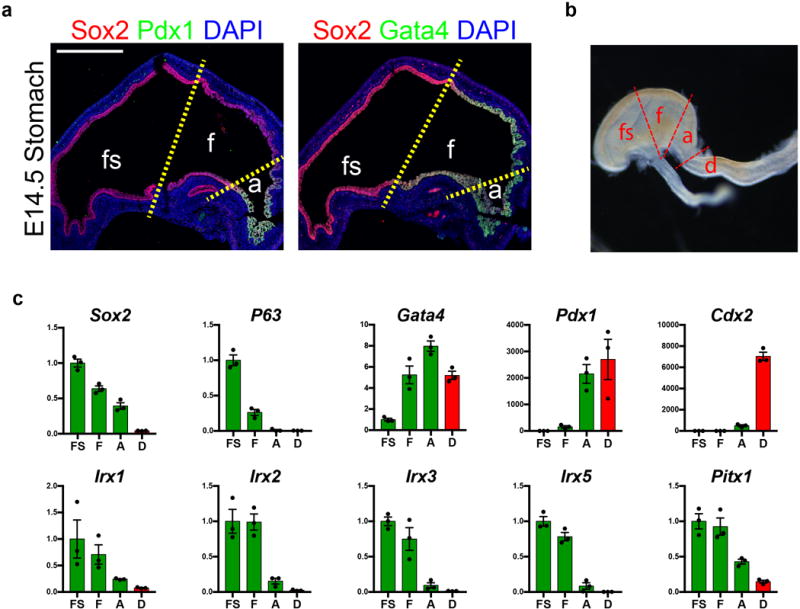
a, Analysis of Sox2, Pdx1, and Gata4 in the embryonic mouse stomach (E14.5) showed that the fundus (f) was Sox2+Gata4+Pdx1−, whereas the antrum (a) was Sox2+Gata4+Pdx1+. The forestomach (fs) expressed Sox2 but neither Gata4 nor Pdx1. b, Brightfield stereomicrograph showing dissected regions of the E14.5 mouse stomach that were analyzed by qPCR. fs, forestomach; f, fundus; a, antrum; d, duodenum. c, Dissected regions in b were analyzed by qPCR for known regionally expressed markers (Sox2, P63, Gata4, Pdx1, and Cdx2) to validate the accuracy of micro-dissection. qPCR analysis of the dissected E14.5 stomach regions showed that putative fundus markers Irx1, Irx2, Irx3, Irx5, and Pitx1 were enriched in the fundus compared to the antrum. n=4 biological replicates per dissected region. Scale bar, 500 μm. Error bars represent s.d.
Extended Data Figure 2. Analysis of β-catenin cKO embryos.
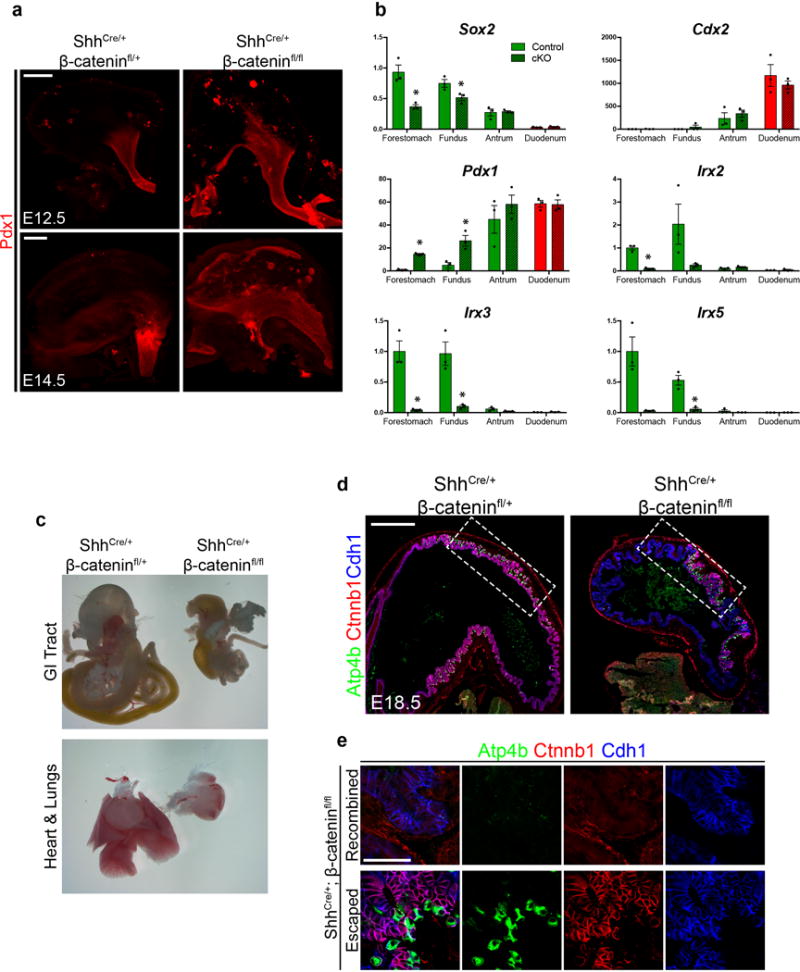
a, By E12.4 and E14.5, ectopic Pdx1 expression was observed throughout the dorsal gastric epithelium, as well as the most proximal gastric epithelium of the cKO embryo. b, qPCR analysis of dissected regions (as shown in Extended Data Figure 1b) of E14.5 cKO foregut showed significant up-regulation of Pdx1 in the fundus and forestomach domains. Conversely, Irx2, Irx3, and Irx5 were markedly reduced in these proximal regions. *, p<0.05; two tailed Student’s t-test n=3 biological replicates per dissected region for each genotype. c, Stereomicrographs of E18.5 dissected viscera demonstrated that cKO embryos exhibited lung agenesis as previously reported. The GI tract, particularly the stomach, was dramatically reduced in size. d, Immunofluorescent staining at E18.5 revealed mosaic deletion pattern of Ctnnb1. Boxed regions are shown in Figure 1e. e, In the E18.5 cKO stomach, recombined glands lacking Ctnnb1 staining did not contain parietal cells whereas robust parietal cell differentiation was observed in Ctnnb1-positive glands. Scale bars, 200 μm (a), 500 μm (d), and 50 μm (e). Error bars represent s.d.
Extended Data Figure 3. Stable induction of fundic fate in hGOs and efficiency of protocol.
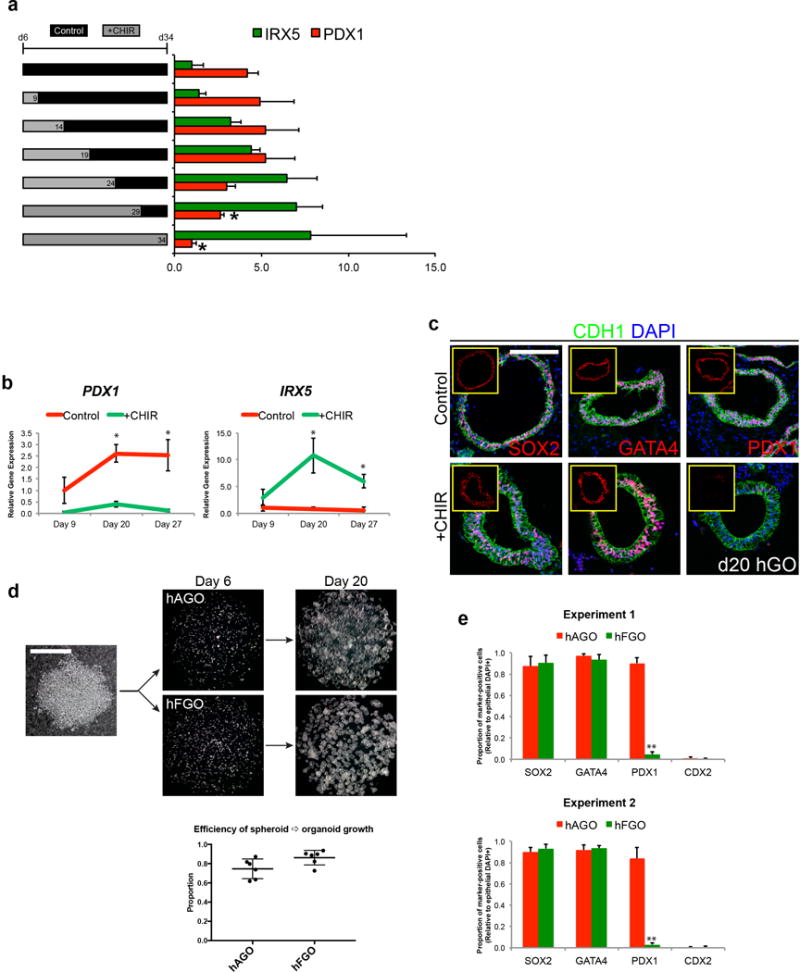
a, We investigated how long CHIR treatment was necessary to establish fundus identity. Brief CHIR treatment (d6-9) and subsequent growth of organoids in control growth medium until day 34 resulted in fundic organoids expressing the antral marker PDX1, suggesting that short CHIR treatment did not produce a stable fundic fate. We then tested whether longer exposures to CHIR were required to retain fundic fate and found that only continuous treatment through at least day 29 could maintain low expression of the antral marker PDX1. *, p<0.05 compared to control antral hGOs; two tailed Student’s t-test. n=3 biological replicates, data representative of 2 independent experiments. b, c, Over the course of the protocol, PDX1 remained low in CHIR-treated organoids, while IRX5 expression was persistently elevated. *, p<0.05; two-tailed Student’s t-test; n=3 biological replicates per timepoint. d, Conversion of d6 posterior foregut spheroids to early stage gastric organoids (d20) is greater than 80% efficient in both the hAGO and hFGO protocols. e, At d20, hFGO epithelium is ~90% GATA4+/SOX2+/PDX1- whereas hAGO epithelium is ~90% GATA4+/SOX2+/PDX1+. **, p<0.001, two-tailed Student’s t-test, n=4 biological replicates per experiment, two individual experiments shown. Scale bars, 100 μm (c) and 200 μm (d).
Extended Data Figure 4. BMP-dependence of Wnt/β-catenin activation to induce intestinal fate from foregut progenitors.
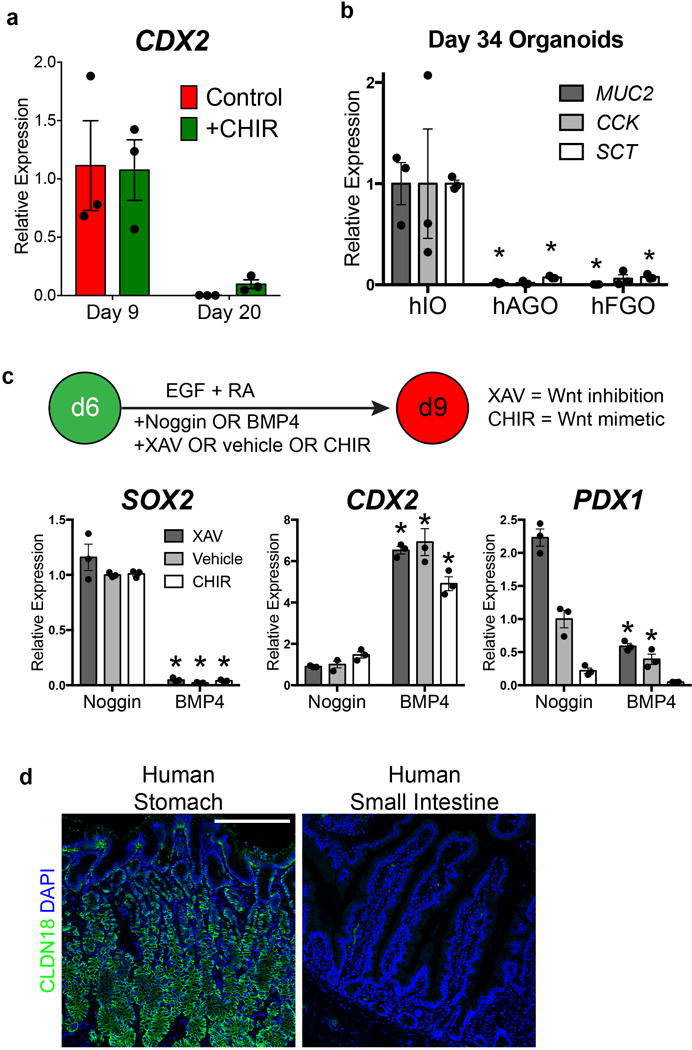
a, The intestine-specific transcription factor CDX2 was not significantly induced in CHIR-treated hGOs at either day 9 or day 20. b, Neither fundic nor antral hGOs expressed genes associated with intestinal cell types, including MUC2, CCK, and SCT, when compared to human intestinal organoids (hIOs). *, p<0.05 compared to hIO; two tailed Student’s t-test. n=3 biological replicates. c, Anterior-posterior fate is coordinately controlled by WNT and BMP activity. In the presence of the BMP inhibitor Noggin, all organoids maintained foregut (SOX2+) regardless of Wnt/β-catenin pathway activity; however in the presence of BMP4, all organoids were posteriorized (CDX2+). Activation of Wnt (CHIR) in a BMP inhibited state resulted in fundus pattern (SOX2+, PDX1−, CDX2−) where as activation of WNT (CHIR) and addition of BMP4 resulted in an intestinal fate (CDX2+). *, p<0.05 compared to analogous Noggin-treated condition; two tailed Student’s t-test. n=3 biological replicates. d, Immunofluorescent staining of human tissues revealed that CLDN18 was a gastric-specific epithelial marker that is not found in the intestine. Scale bar, 200 μm. Error bars represent s.e.m.
Extended Data Figure 5. hFGOs contain organized glands supported by associated mesenchymal layer.
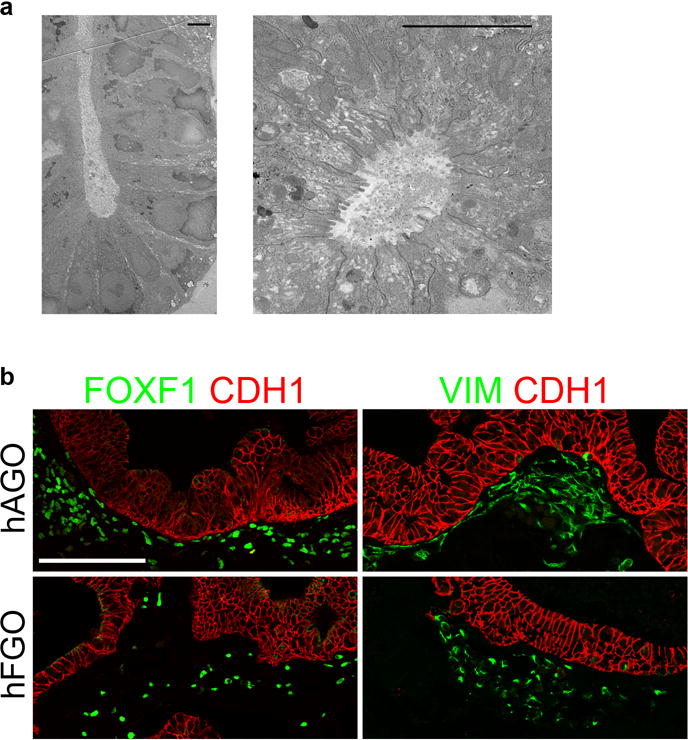
a, Transmission electron micrographs demonstrated that hFGO glands exhibited organized architecture with narrow apical membranes. b, Both hFGOs and hAGOs contained a supporting layer FOXF1+/VIM+ undifferentiated fibroblasts. Scale bars, 5 μm (a) and 100 μm (b).
Extended Data Figure 6. Region-specific cytodifferentiation in human gastric organoids.
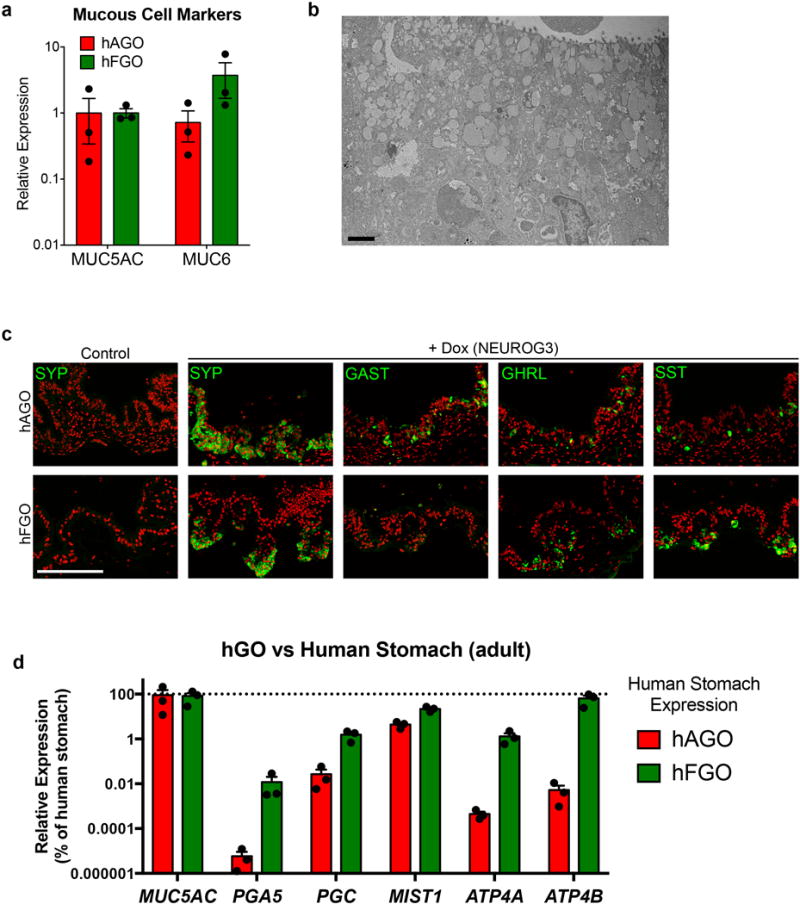
a, Antral and fundic hGOs exhibited comparable expression of mucous cell markers MUC5AC and MUC6. b, As shown in transmission electron micrograph, hFGOs contained abundant cells exhibiting granule pattern consistent with mucous neck cells, the precursors to differentiated chief cells. c, Exogenous expression of NEUROG3 in hGOs derived from NEUROG3-deficient hESC line induced robust differentiation of SYP-positive endocrine cells. While both hAGOs and hFGOs formed GHRL- and SST-expressing endocrine cells, specification of GAST+ G-cells was observed only in hAGOs. d, Expression comparison of cell lineage markers in hGOs and human gastric biopsy tissue. qPCR analyses demonstrated that hGOs exhibited comparable expression levels of several lineage markers (MUC5AC, ATP4B), while other genes were expressed at much lower levels (ATP4A, PGA5, and PGC) than found in the fully differentiated, mature human stomach. Scale bars, 5 μm (b) and 100 μm (c). Error bars represent s.d. (a) and s.e.m. (b).
Extended Data Figure 7. Analysis of murine chief cell development.
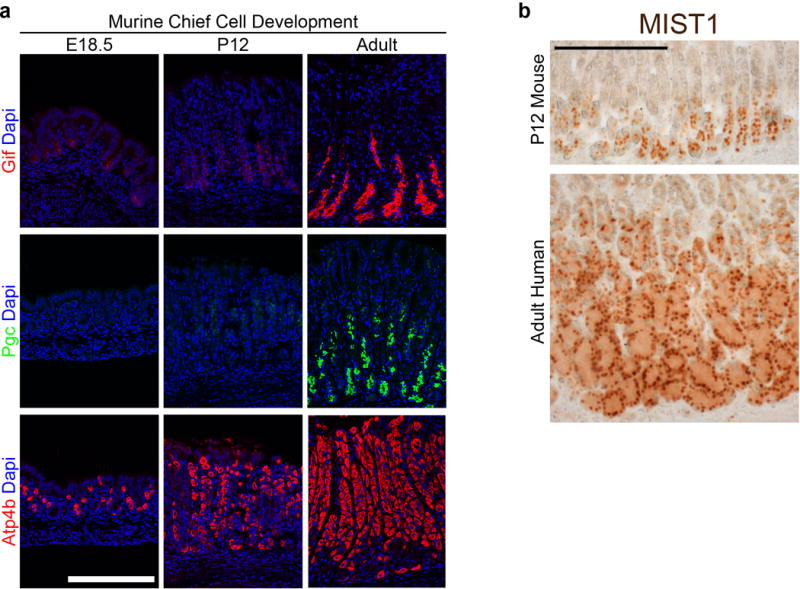
a, Unlike parietal cells, which expressed functional markers (Atp4b) as early as late embryonic stages, chief cell gene products were not detectable until much later stages of development. In the embryonic (E18.5) and juvenile (P12) stomach, Gif and Pgc were not yet expressed, indicating that chief cells mature much later in development than other lineages in the gastric epithelium. b, Despite the absence of Pgc, the P12 mouse stomach did contain abundant glandular cells expressing nuclear Mist1, a chief cell-specific marker. Thus, chief cells were indeed specified earlier but took several weeks to develop robust expression of terminal differentiation markers. Scale bars, 100 μm (a) and 200 μm (b).
Extended Data Figure 8. Screen for pathways that promote differentiation of parietal cells in fundic hGOs.
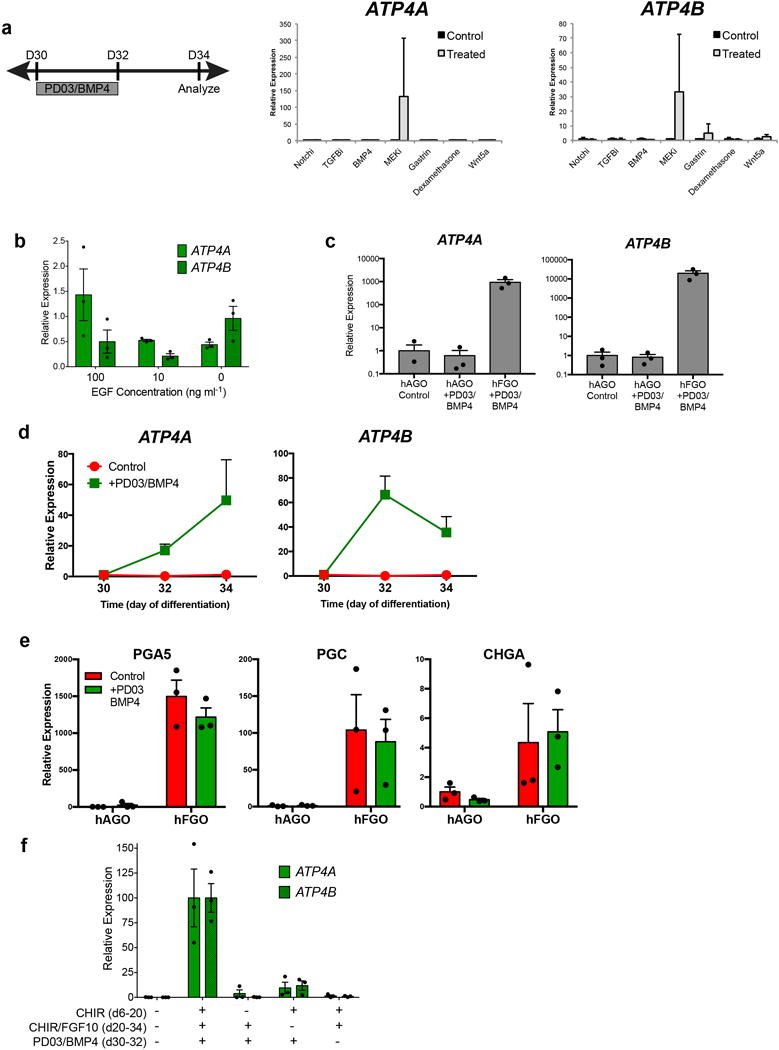
a, To test for growth factors/small molecules capable of inducing parietal cell differentiation, hFGOs were exposed for two days (30–32) to the indicated agonist or antagonist and then analyzed at day 34. In a screening experiment of different pathways, only MEK inhibition with PD03 was found to robustly induce expression of ATP4A/B. b, Reduction or removal of EGF from the culture medium was not sufficient to reproduce the effect of MEK inhibition. c, The ability of PD03/BMP4 to induce parietal cell development was exclusive to fundic hGOs, as antral hGOs did not express fundic markers in response to PD03/BMP4. d, Exposure to PD03/BMP4 rapidly increased expression of ATP4A and ATP4B in fundic hGOs. e, Induction of parietal cell generation with PD03/BMP4 did not significantly impact the differentiation of chief cells (PGA5 and PGC) and endocrine cells (CHGA). f, The manipulations at each stage of the hFGO differentiation protocol was required for robust parietal cell differentiation, as removal of any single step led to loss of ATP4A/B expression. Error bars represent s.d. (a–c) and s.e.m. (d–f).
Extended Data Figure 9. Live in vitro pH monitoring in gastric organoids.
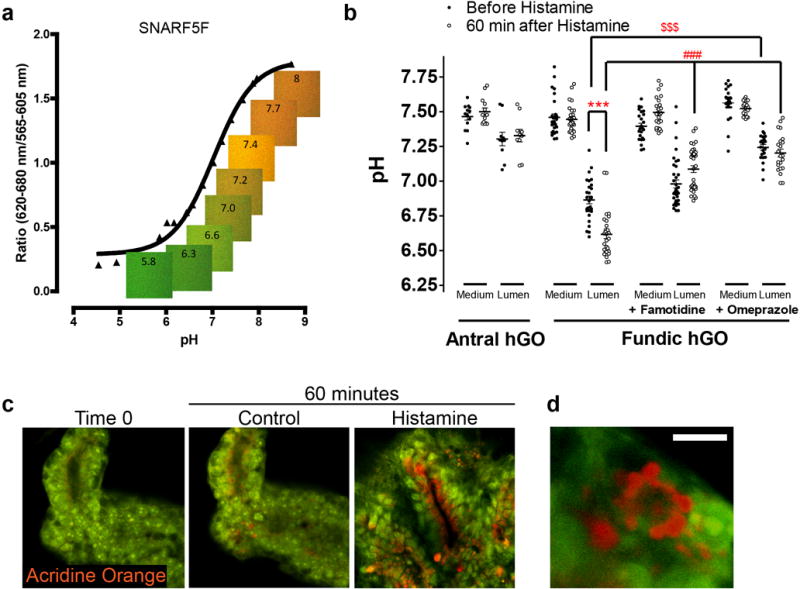
a, The dye SNAFR5F exhibits responsiveness over pH range of 5–8, which makes it well suited to detect physiologic changes in response to parietal cell-mediated acid secretion. b, Media and luminal pH measurements recorded before (closed circles) and 60 minutes following addition of histamine (open circles). Antral hGOs did not respond, while the fundic hGO luminal pH decreased in response to histamine. The acidification was inhibited by pre-treatment of organoids with either famotidine or omeprazole. Further, omeprazole was sufficient to raise the pH in fundic organoids prior to histamine exposure, suggesting a baseline acid secretion in the fundic organoids. Media pH did not change in any organoids. ***, p<0.001 compared to before histamine; $$$, p<0.001 compared to luminal pH without histamine; ###, p<0.001 compared to luminal pH with histamine; two tailed Student’s t-test. c, hFGOs contained parietal cell-dense glands in which acridine orange (AO) accumulated in nearly all of the cells lining the lumen of the gland. d, AO accumulation was observed in a canalicular-type pattern in parietal cells in hFGOs. Scale bars, 10 μm. Error bars represent s.d.
Extended Data Figure 10. Serial passaging of human gastric organoids.
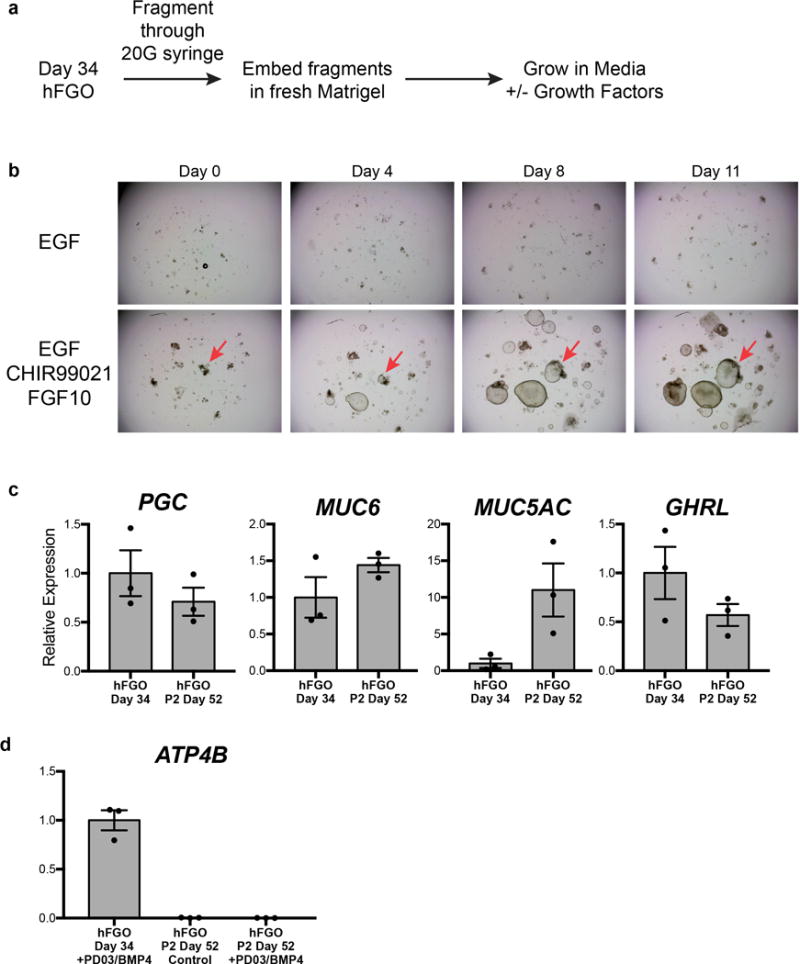
a, Schematic representation of experiments to determine the presence of gastric stem cells in hGOs. b, When fragments were grown in culture medium containing only EGF, they did not grow or expand to form new organoids. However, addition of CHIR and FGF10 to the culture medium was sufficient to support the growth of individual fragments into newly formed organoids. c, Following two passages, hFGOs still expressed genes consistent with a gastric phenotype, including PGC, MUC6, MUC5AC, and GHRL. This ability to undergo serial passaging with maintenance of gastric identity supports the conclusion that hFGOs contain cells with properties analogous to those of adult gastric stem cells. d, Although passaged hFGOs expressed markers associated with several differentiated gastric cell types, they did not express genes associated with parietal cells such as ATP4B. Further, differentiation of parietal cells could not be induced through MEK inhibition as they could prior to passaging. Error bars represent s.d.
Supplementary Material
Acknowledgments
We thank J. Whitsett and D. Sinner for providing Axin2-LacZ animals, as well as Y. Zavros, A. Zorn and members of the Wells and Zorn laboratories for reagents and feedback. This work was supported by National Institutes of Health grants R01DK092456, U19 AI116491, U18EB021780 (J.M.W.), R01DK102551 (M.H.M.), and NIGMS Medical Scientist Training Program T32 GM063483. We acknowledge core support from the Cincinnati Digestive Disease Center Award (P30 DK0789392), CCHMC Confocal Imaging Core, CCHMC Pluripotent Stem Cell Facility, and CCHMC Pathology Core.
Footnotes
Author Contributions
K.W.M. and J.M.W. conceived the study and experimental design, performed and analyzed experiments and co-wrote the manuscript. B.M., T.B., and J.T. were involved in identifying conditions to direct the differentiation of PSCs into gastric organoids. X.Z. generated and analyzed NEUROG3-expressing gastric organoids. J.M.S. and C.M.C generated and analyzed the Shh-Cre; β-catenin-floxed knockout animals. E.A. designed and performed experiments related to functionality of parietal cells and performed electron microscopic analysis. M.H.M. and J.M.W. acquired funding for this work.
Competing financial interests
The authors have no competing financial interests to declare.
References
- 1.Lancaster MA, Knoblich JA. Organogenesis in a dish: modeling development and disease using organoid technologies. Science. 2014;345:1247125–1247125. doi: 10.1126/science.1247125. [DOI] [PubMed] [Google Scholar]
- 2.Huch M, Koo BK. Modeling mouse and human development using organoid cultures. Development. 2015;142:3113–3125. doi: 10.1242/dev.118570. [DOI] [PubMed] [Google Scholar]
- 3.Zhu Z, Huangfu D. Human pluripotent stem cells: an emerging model in developmental biology. Development. 2013;140:705–717. doi: 10.1242/dev.086165. [DOI] [PMC free article] [PubMed] [Google Scholar]
- 4.Kim TH, Shivdasani RA. Stomach development, stem cells and disease. Development. 2016;143:554–565. doi: 10.1242/dev.124891. [DOI] [PMC free article] [PubMed] [Google Scholar]
- 5.Mills JC, Shivdasani RA. Gastric epithelial stem cells. Gastroenterology. 2011;140:412–424. doi: 10.1053/j.gastro.2010.12.001. [DOI] [PMC free article] [PubMed] [Google Scholar]
- 6.Hoffmann W. Current Status on Stem Cells and Cancers of the Gastric Epithelium. IJMS. 2015;16:19153–19169. doi: 10.3390/ijms160819153. [DOI] [PMC free article] [PubMed] [Google Scholar]
- 7.McCracken KW, et al. Modelling human development and disease in pluripotent stem-cell-derived gastric organoids. Nature. 2014;516:400–404. doi: 10.1038/nature13863. [DOI] [PMC free article] [PubMed] [Google Scholar]
- 8.Noguchi TAK, et al. Generation of stomach tissue from mouse embryonic stem cells. Nature Cell Biology. 2015;17:984–993. doi: 10.1038/ncb3200. [DOI] [PubMed] [Google Scholar]
- 9.Peek RM. Helicobacter pylori infection and disease: from humans to animal models. Disease Models & Mechanisms. 2008;1:50–55. doi: 10.1242/dmm.000364. [DOI] [PMC free article] [PubMed] [Google Scholar]
- 10.Zorn AM, Wells JM. Vertebrate Endoderm Development and Organ Formation. Annu Rev Cell Dev Biol. 2009;25:221–251. doi: 10.1146/annurev.cellbio.042308.113344. [DOI] [PMC free article] [PubMed] [Google Scholar]
- 11.Kraus MRC, Grapin-Botton A. Patterning and shaping the endoderm in vivo and in culture. Curr Opin Genet Dev. 2012;22:347–353. doi: 10.1016/j.gde.2012.05.002. [DOI] [PubMed] [Google Scholar]
- 12.Sherwood RI, Chen TYA, Melton DA. Transcriptional dynamics of endodermal organ formation. 2009;238:29–42. doi: 10.1002/dvdy.21810. [DOI] [PMC free article] [PubMed] [Google Scholar]
- 13.Roth RB, et al. Gene expression analyses reveal molecular relationships among 20 regions of the human CNS. Neurogenetics. 2006;7:67–80. doi: 10.1007/s10048-006-0032-6. [DOI] [PubMed] [Google Scholar]
- 14.Kim BM, Buchner G, Miletich I, Sharpe PT, Shivdasani RA. The stomach mesenchymal transcription factor Barx1 specifies gastric epithelial identity through inhibition of transient Wnt signaling. Developmental Cell. 2005;8:611–622. doi: 10.1016/j.devcel.2005.01.015. [DOI] [PubMed] [Google Scholar]
- 15.Kim BM, Woo J, Kanellopoulou C, Shivdasani RA. Regulation of mouse stomach development and Barx1 expression by specific microRNAs. Development. 2011;138:1081–1086. doi: 10.1242/dev.056317. [DOI] [PMC free article] [PubMed] [Google Scholar]
- 16.Rodriguez P, et al. BMP signaling in the development of the mouse esophagus and forestomach. Development. 2010;137:4171–4176. doi: 10.1242/dev.056077. [DOI] [PMC free article] [PubMed] [Google Scholar]
- 17.Lameris AL, et al. Expression profiling of claudins in the human gastrointestinal tract in health and during inflammatory bowel disease. Scand J Gastroenterol. 2013;48:58–69. doi: 10.3109/00365521.2012.741616. [DOI] [PubMed] [Google Scholar]
- 18.Keeley TM, Samuelson LC. Cytodifferentiation of the postnatal mouse stomach in normal and Huntingtin-interacting protein 1-related-deficient mice. Am J Physiol Gastrointest Liver Physiol. 2010;299:G1241–51. doi: 10.1152/ajpgi.00239.2010. [DOI] [PMC free article] [PubMed] [Google Scholar]
- 19.Choi E, et al. Cell lineage distribution atlas of the human stomach reveals heterogeneous gland populations in the gastric antrum. Gut. 2014;63:1711–1720. doi: 10.1136/gutjnl-2013-305964. [DOI] [PMC free article] [PubMed] [Google Scholar]
- 20.Stange DE, et al. Differentiated Troy+ chief cells act as reserve stem cells to generate all lineages of the stomach epithelium. Cell. 2013;155:357–368. doi: 10.1016/j.cell.2013.09.008. [DOI] [PMC free article] [PubMed] [Google Scholar]
- 21.Lennerz JKM, et al. The transcription factor MIST1 is a novel human gastric chief cell marker whose expression is lost in metaplasia, dysplasia, and carcinoma. Am J Pathol. 2010;177:1514–1533. doi: 10.2353/ajpath.2010.100328. [DOI] [PMC free article] [PubMed] [Google Scholar]
- 22.Ramsey VG, et al. The maturation of mucus-secreting gastric epithelial progenitors into digestive-enzyme secreting zymogenic cells requires Mist1. Development. 2007;134:211–222. doi: 10.1242/dev.02700. [DOI] [PubMed] [Google Scholar]
- 23.Lambrecht NWG, Yakubov I, Scott D, Sachs G. Identification of the K efflux channel coupled to the gastric H-K-ATPase during acid secretion. Physiological Genomics. 2005;21:81–91. doi: 10.1152/physiolgenomics.00212.2004. [DOI] [PubMed] [Google Scholar]
- 24.Schumacher MA, et al. The use of murine-derived fundic organoids in studies of gastric physiology. J Physiol (Lond) 2015;593:1809–1827. doi: 10.1113/jphysiol.2014.283028. [DOI] [PMC free article] [PubMed] [Google Scholar]
- 25.Barker N, et al. Lgr5(+ve) stem cells drive self-renewal in the stomach and build long-lived gastric units in vitro. Cell Stem Cell. 2010;6:25–36. doi: 10.1016/j.stem.2009.11.013. [DOI] [PubMed] [Google Scholar]
- 26.Bartfeld S, et al. In vitro expansion of human gastric epithelial stem cells and their responses to bacterial infection. Gastroenterology. 2015;148:126–136.e6. doi: 10.1053/j.gastro.2014.09.042. [DOI] [PMC free article] [PubMed] [Google Scholar]
- 27.Nielsen C, Murtaugh LC, Chyung JC, Lassar A, Roberts DJ. Gizzard Formation and the Role of Bapx1. Developmental Biology. 2001;231:164–174. doi: 10.1006/dbio.2000.0151. [DOI] [PubMed] [Google Scholar]
- 28.Goldenring JR, et al. Overexpression of transforming growth factor-alpha alters differentiation of gastric cell lineages. Dig Dis Sci. 1996;41:773–784. doi: 10.1007/BF02213134. [DOI] [PubMed] [Google Scholar]
- 29.Speer AL, et al. Fibroblast growth factor 10-fibroblast growth factor receptor 2b mediated signaling is not required for adult glandular stomach homeostasis. PLoS ONE. 2012;7:e49127. doi: 10.1371/journal.pone.0049127. [DOI] [PMC free article] [PubMed] [Google Scholar]
- 30.Goldenring JR, Nomura S. Differentiation of the gastric mucosa III. Animal models of oxyntic atrophy and metaplasia. AJP: Gastrointestinal and Liver Physiology. 2006;291:G999–1004. doi: 10.1152/ajpgi.00187.2006. [DOI] [PubMed] [Google Scholar]
- 31.Huh WJ, Coffey RJ, Washington MK. Ménétrier’s Disease: Its Mimickers and Pathogenesis. J Pathol Transl Med. 2016;50:10–16. doi: 10.4132/jptm.2015.09.15. [DOI] [PMC free article] [PubMed] [Google Scholar]
- 32.Park YH, Kim N. Review of atrophic gastritis and intestinal metaplasia as a premalignant lesion of gastric cancer. J Cancer Prev. 2015;20:25–40. doi: 10.15430/JCP.2015.20.1.25. [DOI] [PMC free article] [PubMed] [Google Scholar]
- 33.Weis VG, Goldenring JR. Current understanding of SPEM and its standing in the preneoplastic process. Gastric Cancer. 2009;12:189–197. doi: 10.1007/s10120-009-0527-6. [DOI] [PMC free article] [PubMed] [Google Scholar]
- 34.Nomura S, et al. Evidence for Repatterning of the Gastric Fundic Epithelium Associated With Ménétrier’s Disease and TGFα Overexpression. Gastroenterology. 2005;128:1292–1305. doi: 10.1053/j.gastro.2005.03.019. [DOI] [PubMed] [Google Scholar]
- 35.Choi E, Hendley AM, Bailey JM, Leach SD, Goldenring JR. Expression of Activated Ras in Gastric Chief Cells of Mice Leads to the Full Spectrum of Metaplastic Lineage Transitions. Gastroenterology. 2015;0 doi: 10.1053/j.gastro.2015.11.049. [DOI] [PMC free article] [PubMed] [Google Scholar]
- 36.McCracken KW, Howell JC, Spence JR, Wells JM. Generating human intestinal tissue from pluripotent stem cells in vitro. Nature Protocols. 2011;6:1920–1928. doi: 10.1038/nprot.2011.410. [DOI] [PMC free article] [PubMed] [Google Scholar]
- 37.Ahnfelt-Ronne J, et al. An Improved Method for Three-dimensional Reconstruction of Protein Expression Patterns in Intact Mouse and Chicken Embryos and Organs. Journal of Histochemistry and Cytochemistry. 2007;55:925–930. doi: 10.1369/jhc.7A7226.2007. [DOI] [PubMed] [Google Scholar]
Associated Data
This section collects any data citations, data availability statements, or supplementary materials included in this article.
Supplementary Materials
Data Availability Statement
The source data for the figures 2, 3, 4, 5 and extended data figures 2, 4, 5, 6, 8, 9, and 10 can be found in the supplementary information.


