Abstract
This work extends the spherical surface sampling algorithm in order to uniformly generate random directions within an elliptical cone. This has applications in Monte Carlo particle transport simulations, for example modeling asymmetric beam divergence or scattering interactions. Two methods are presented. The first obeys the strict boundary of the elliptical cone. The second relaxes this requirement, increasing the range of generated directions by up to 10% for elliptical cones of extreme eccentricity. However, the second method is able to generate directions beyond the equator.
Keywords: Monte Carlo, random direction, spherical sampling
1. Introduction
Isotropically sampling 3D directions (i.e. uniformly sampling points upon the surface of the unit sphere) is a common problem in Monte Carlo programs, with a surprising variety of solutions [1, 2, 3, 4, 5]. The optimal sampling algorithm [4, 5, 6] generates two independent uniform variates, ηx and ηy, over the domain (−1, 1) until they satisfy . The acceptance probability is π/4 ≈ 0.79. They are then transformed to Cartesian coordinates according to
| (1) |
This method maps points from the unit disk onto the surface of the unit sphere: (ηx, ηy) → (x, y, z). The transformation preserves the 2D polar angle as the 3D azimuthal angle, whilst the 2D radial distance directly determines the 3D z-coordinate.
This work extends the above algorithm in order to generate random directions within an elliptical cone. This means choosing an appropriate 2D shape from which to sample points (ηx, ηy), before they are transformed with (1). This technique could find applications in Monte Carlo particle transport simulations, such as those used in high energy physics, nuclear physics, medical physics, computer graphics rendering, and modeling of semiconductors and heat transfer. The author developed this algorithm to model asymmetric angular divergence of particle beams in the TOPAS simulation software for radiotherapy [7].
2. Methods
2.1. Geometric configuration
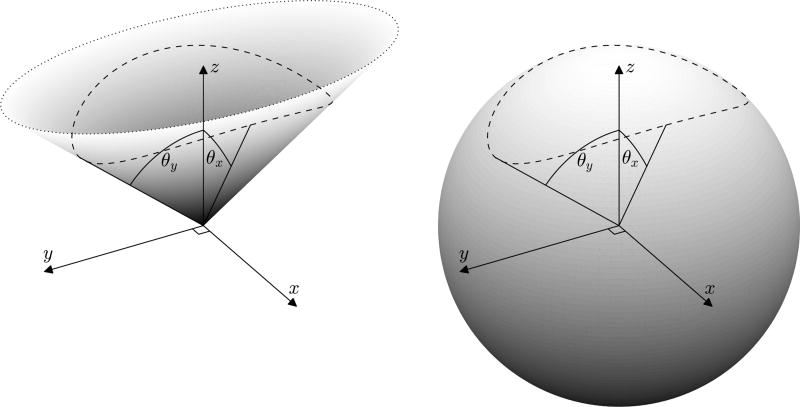
The goal is to uniformly generate random directions within the boundaries of an elliptical cone. This is equivalent to uniformly sampling the surface of the unit sphere enclosed by the dashed line in Figure 1. Precisely speaking, this is the surface of the unit sphere that is enclosed by the upper nappe of a right elliptical conical surface, whose apex coincides with the center of the sphere.
Figure 1.
The surfaces of an elliptical cone and the unit sphere, with their intersection drawn as a dashed line. The cone has θx= 30° and θy = 50°.
The elliptical cone is defined by the opening half-angles θx and θy, and is oriented such that these are subtended by the semi-major and semi-minor axes of the directrix. Sampled points must lie upon the surface of the unit sphere and within the conical surface, and therefore satisfy the following two relations:
| (2) |
| (3) |
where
| (4) |
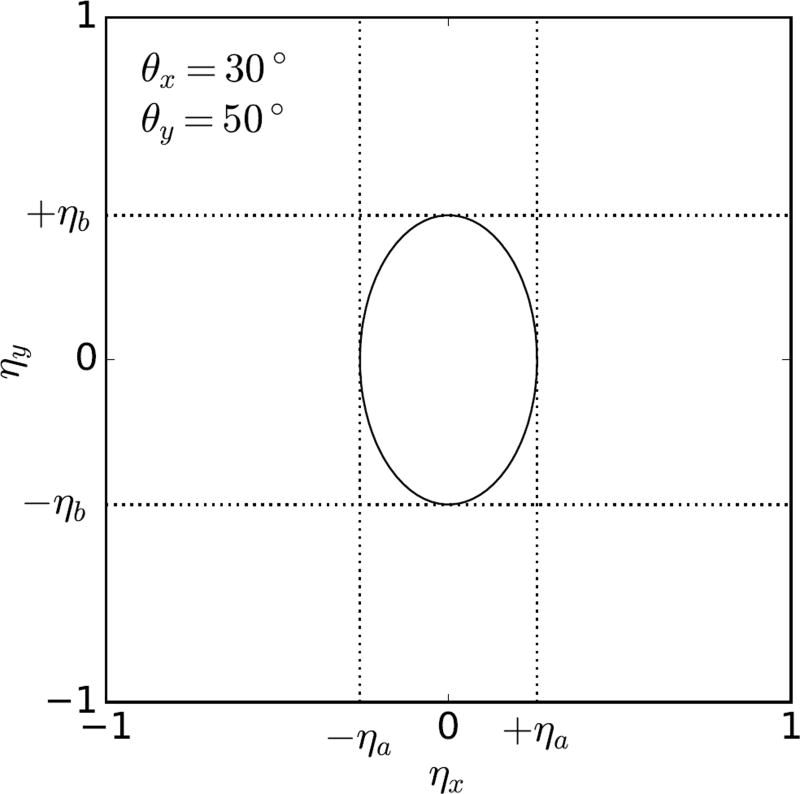
Considering the spherical sampling algorithm, it is clear that only a subdomain of the (ηx, ηy) coordinates will yield directions within the elliptical cone. This is explicitly demonstrated in Figure 2, which shows the (ηx, ηy) coordinates that map onto the dashed line of Figure 1. To achieve maximal acceptance probability, we sample ηx over (−ηa, ηa) and ηy over (−ηb, ηb), where
| (5) |
These expressions are derived by turning (3) into an equation and solving simultaneously with (2) at the boundary conditions. These are y = 0 and ηy = 0 for ηa, and x = 0 and ηx = 0 for ηb. Finally a substitution is made according to (1) and a half-angle trigonometric identity is applied.
Figure 2.
The solid line indicates the (ηx, ηy) coordinates that are transformed by (1) to the coordinates of an elliptical cone with θx = 30° and θy = 50° (shown in Figure 1).
2.2. Method 1: strict cone definition
Generate two random variates, ηx uniform on (−ηa, ηa) and ηy uniform on (−ηb, ηb). Select the pair if both the following criteria are met
| (6) |
Transform the selected variates to points on the sphere using (1). Selection criteria (6) enforce z > 0 and (3) before the coordinate transformation (1) is performed (which features a computationally expensive square-root function).
2.3. Method 2: relaxed cone definition
Generate two random variates, ηx uniform on (−ηa, ηa) and ηy uniform on (−ηb, ηb). Select the pair if
| (7) |
Transform the selected variates to points on the sphere using (1). Since the functional form of (7) is different from that of (6), it is apparent that the sampled points will not obey the strict cone definition of (3). The differences are discussed below.
3. Results and Discussion
The uniformity of these two sampling methods was evaluated as recommended by Knuth [6]. First, the θ-ϕ bounding box of the generating cone was divided into 20×20 bins, and those bins enclosed by the generating cone were selected. Then, the expected number of directions within each bin was computed, accounting for the solid angle subtended by each bin and the entire generating cone. A total of 105 directions were generated, such that the expected number in each bin was greater than 5. Pearson’s χ2 statistic quantified the agreement between the observed and expected number of directions generated within the bins. Excessively high (low) χ2 values indicate that the agreement is too poor (good) to be consistent with the uniform (random) generation of directions. The empirical distribution function of χ2 was measured by repeating this process 200 times. Finally, the empirical and theoretical χ2 distribution functions were compared using a Kolmogorov-Smirnov test. This two-level test demonstrated the uniformity of both methods (see Figure 3).
Figure 3.
Comparison of empirical (solid) and theoretical (dashed) χ2 distribution functions. The p-value of the Kolmogorov-Smirnov (KS) test is shown. (a) Both methods exhibit uniformity for θx = 30° and θy= 50° (geometry shown in Figure 1). The two methods have different degrees of freedom because their generating cones subtend different solid angles. (b) Method 2 exhibits uniformity for θx = 30° and θy = 150° (geometry shown in Figure 5).
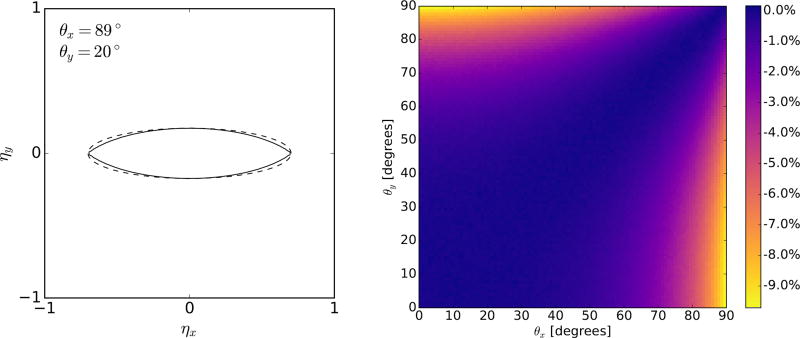
Method 2 does not strictly obey the elliptical cone definition (3). Although the difference in the generated range of directions is usually negligible, it can become appreciable for elliptical cones with extreme eccentricity. Figure 4a demonstrates this difference for θx = 89° and θy = 20°. The acceptance probability of method 2 is constant at π/4 ≈ 0.79, since it samples (ηx, ηy) points from an ellipse. However, Figure 4b shows that the acceptance probability of method 1 can decrease by up to 10%.
Figure 4.
(a) The difference in the domain of sampled (ηx, ηy) points of method 1 (solid) and method 2 (dashed). (b) The relative difference in acceptance probability of method 1 with respect to method 2.
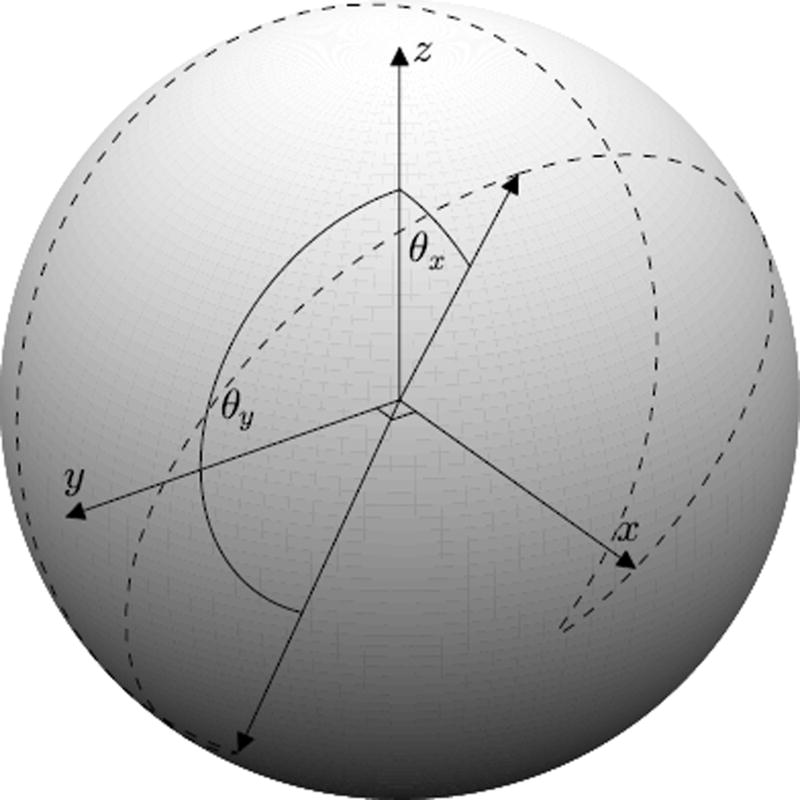
A benefit of disobeying the strict cone definition is that method 2 is able to support θx > 90° and/or θy > 90° (i.e. sample directions below the equator). This is not possible in method 1, since the cone is limited to a single hemisphere. Figure 5 displays an example of the resulting shape upon the surface of the unit sphere.
Figure 5.
The boundary (dashed line) to the directions generated by method 2 when θx = 30° and θy = 150°.
It is also possible to sample ηx and ηy from normal distributions with mean μ = 0 and a standard deviation σ of ηa and ηb respectively. The level sets of the probability density function f(ηx, ηy) are ellipses, and are transformed by (1) into level sets corresponding to boundaries that can be generated by method 2. For this reason, normal sampling is a natural extension to method 2. These ηa and ηb now correspond to the angular spread from the z-axis, instead of defining the boundary to generated directions. To constrain points to the surface of the unit sphere, the variates must satisfy . Considering the special case of a circular cone, where σ = ηa = ηb, the probability density function of the radial coordinate is
| (8) |
where A achieves normalization over the domain ηr ∈ [0, 1). In this case, it can be shown that the probability density function of the z coordinate, following transformation (1) is
| (9) |
and is defined over the domain z ∈ (−1, 1). The azimuthal coordinate would be distributed uniformly in this case.
4. Conclusions
We have developed two methods for uniformly sampling directions within an elliptical cone. The first method obeys the strict boundary of the elliptical cone. The second method slightly warps this boundary, increasing the range of accepted directions by up to 10% for elliptical cones of extreme eccentricity. However, the second method can generate directions beyond the equator.
Acknowledgments
This work was supported by National Cancer Institute grant U19CA21239. The author thanks Prof. H Paganetti and Dr Z Perko for feedback that improved the quality of the manuscript.
Footnotes
Publisher's Disclaimer: This is a PDF file of an unedited manuscript that has been accepted for publication. As a service to our customers we are providing this early version of the manuscript. The manuscript will undergo copyediting, typesetting, and review of the resulting proof before it is published in its final citable form. Please note that during the production process errors may be discovered which could affect the content, and all legal disclaimers that apply to the journal pertain.
References
- 1.Cook JM. Technical notes and short papers: Rational formulae for the production of a spherically symmetric probability distribution. Math. Tables Aids Comput. 1957;11:81–82. [Google Scholar]
- 2.Muller ME. A note on a method for generating points uniformly on n-dimensional spheres. Comm. Assoc. Comput. Mach. 1959;2:19–20. [Google Scholar]
- 3.Shao M-Z, Badler N. Spherical sampling by Archimedes’ Theorem, Tech. Rep. 184. University of Pennsylvania Department of Computer and Information Science; 1996. [Google Scholar]
- 4.Knop RE. Random vectors uniform in solid angle. Comm. Assoc. Comput. Mach. 1970;13:326. [Google Scholar]
- 5.Marsaglia G. Choosing a point from the surface of a sphere. Ann. Math. Stat. 1972;43:645–646. [Google Scholar]
- 6.Knuth DE. The Art of Computer Programming, Vol. 2: Seminumerical Algorithms. 3. Addison-Wesley; Reading, MA: 1998. [Google Scholar]
- 7.Perl J, Shin J, Schumann J, Faddegon B, Paganetti H. TOPAS: An innovative proton Monte Carlo platform for research and clinical applications. Medical Physics. 2012;39:6818. doi: 10.1118/1.4758060. [DOI] [PMC free article] [PubMed] [Google Scholar]


