

Abstract
Purpose
We combined a large longitudinal neuroimaging dataset that includes children who do and do not stutter and a whole-brain network analysis in order to examine the intra- and inter-network connectivity changes associated with stuttering. Additionally, we asked whether whole brain connectivity patterns observed at the initial year of scanning could predict persistent stuttering in later years.
Methods
A total of 224 high-quality resting state fMRI scans collected from 84 children (42 stuttering, 42 controls) were entered into an independent component analysis (ICA), yielding a number of distinct network connectivity maps (“components”) as well as expression scores for each component that quantified the degree to which it is expressed for each child. These expression scores were compared between stuttering and control groups’ first scans. In a second analysis, we examined whether the components that were most predictive of stuttering status also predicted persistence in stuttering.
Results
Stuttering status, as well as stuttering persistence, were associated with aberrant network connectivity involving the default mode network and its connectivity with attention, somatomotor, and frontoparietal networks. The results suggest developmental alterations in the balance of integration and segregation of large-scale neural networks that support proficient task performance including fluent speech motor control.
Conclusions
This study supports the view that stuttering is a complex neurodevelopmental disorder and provides comprehensive brain network maps that substantiate past theories emphasizing the importance of considering situational, emotional, attentional and linguistic factors in explaining the basis for stuttering onset, persistence, and recovery.
Keywords: Stuttering, resting state fMRI, intrinsic connectivity networks, default mode network, independent component analysis (ICA)
1. Introduction
Stuttering is a complex neurodevelopmental disorder (Smith & Weber, 2016) with a life-span incidence estimated at 8% (Yairi & Ambrose, 2013). The etiology of stuttering remains unclear, but growing evidence points to an interplay among genetic, epigenetic, and environmental factors that influence brain development, which in turn affect fluent speech production. The pathophysiological bases of stuttering likely arise during a critical period when children undergo vigorous development in speech and language, general cognition, motor control, and emotions. By carefully mapping the complex interactions between these developing systems, it might be possible to explain the mechanisms of stuttering onset, persistence, heterogeneity of symptoms, comorbidity, and severity.
Over the past two decades a large number of neuroimaging studies of stuttering have been conducted, which have greatly added to our knowledge. These studies, however, were mostly conducted in adults, leaving the developmental mechanisms of stuttering largely unexplored. Moreover, studying adults risks conflating causal and compensatory mechanisms, a point noted almost two decades ago by Ludlow (2000) in an editorial discussing seminal neuroimaging papers: “In the adult system it may be difficult to distinguish between mechanisms responsible for stuttering and those developed to compensate… As new technologies emerge which are non-invasive and have improved temporal resolution, studies in children who stutter during the critical period for speech development may provide understanding of how this dysfunctional system emerges.” (p. 1984)
Since that time, many pediatric studies have examined both functional and structural brain differences in young children who stutter (e.g. Arnold et al., 2011; Beal et al., 2011, 2015; Chang et al., 2008, 2015; Chang & Zhu 2013; Choo et al., 2012; Etchell et al., 2016; Jansson-Verkasalo et al., 2014; Kaganovic et al., 2010; Mohan & Weber-Fox 2015; Ozcan et al., 2009; Ozge et al., 2004; Sato et al. 2011; Sowman et al. 2014; Weber-Fox et al., 2008; Usler & Weber-Fox 2015; and for a systematic review see Etchell et al., 2016 in this special issue). Results from this body of work are mixed. Some studies report that both children and adults who stutter exhibit aberrant auditory-motor integration (Beal et al., 2010, 2011; Chang & Zhu, 2013; Jansson-Verkasalo et al., 2014) and possible deficiencies in the basal-ganglia thalamocortical loop (Lu et al., 2009, 2010; Chang & Zhu, 2013; Xuan et al., 2012), whereas others provide conflicting findings (e.g., right hemisphere increases in structural measures) in adults (De Nil et al., 2000; Foundas et al., 2003; Kikuchi, 2011; Preibisch et al., 2003) but not in children (Chang et al., 2008) and an absence of differences in lateralization of brain function during speech production in children who stutter (Sowman et al., 2014). Convergent findings from children and adults have been considered to reflect stuttering trait-associated differences in the brain that may be related to pathophysiology of stuttering. Results that conflict between adults and children on the other hand, are thought to reflect compensation- and adaptation- related changes in the adult brain that are not directly related to pathophysiology of stuttering. While studying children who stutter is a step in the right direction, there are three key limitations that are generally observed in this body of work.
1.1 Limitations of previous pediatric neuroimaging studies on stuttering
1.1.1 Small samples
Many previous studies of children who stutter use relatively small samples, typically under 30 participants. One reason is nearly all studies of developmental stuttering, including ours, were conducted with “pure” cases: researchers often take great care to exclude children comorbid for other neurodevelopmental conditions. Although such efforts are well intentioned, they may have also limited the generalizability of findings. For example, it has been estimated that between 4% (Arndt & Healey, 2001) and 26% (Riley & Riley, 2000) of all school-age stuttering children exhibit symptoms consistent with ADHD, and even more (~58%) have been reported to exhibit clinically relevant symptoms of ADHD as rated by parents (Donaher & Richels, 2012). Likewise, anxiety is a common comorbidity associated with stuttering (see Kefalianos et al., 2012 for a review). A meta-analysis of over 1300 adults who stutter reported elevated levels of trait anxiety and social anxiety relative to non-stuttering adults (Craig & Tran, 2014) and another study reported that adults who stutter have six times greater odds of suffering from an anxiety disorder than their fluent peers (Iverach et al., 2009). The high prevalence of comorbid disorders highlights the need to consider other aspects of stuttering beyond those directly related to speech, such as attention and emotion. Small sample sizes also make it difficult to examine within group factors relating to persistence and recovery, as well as sex differences. Finally, there is also the well-known problem of the increased risk of reporting a type II error, making it difficult to be confident about the results that such studies provide until findings can be replicated by larger studies and by independent research laboratories.
1.1.2 Locationist approaches
Most existing brain imaging studies of stuttering have adopted a locationist approach, focusing on certain a priori defined areas of interest or connections – guided through theoretical perspectives and/or previous findings. This likely leads to variable findings that may not adequately reflect the complex structural architecture and functional organization of the brain. No single area or areas seem to be affected in either developmental (see Cai et al., 2014 for a discussion) or neurogenic stuttering (Ludlow et al., 1987; Tani & Sakai, 2011; Theys et al., 2013). Additionally, this approach confines research by failing to examine regions that may be theoretically uninteresting based on current theory, but may in fact be important. For instance, despite considerable behavioral evidence showing children who stutter differ from their fluent peers on measures of emotional control (Jones et al., 2014; Ntourou et al., 2013; Zengin-Bolatkale et al., 2015), temperament (Eggers et al., 2010; Embrechts et al., 2000), inhibition (Choi et al., 2013), and attention (Eggers et al., 2010; Karrass et al., 2006; Piispala et al., 2016), there has been very little neuroimaging work focusing on these issues. Perhaps more crucially, the brain is not a set of isolated regions, but rather comprises intrinsically connected networks (ICNs) that underpin distinct but related functions (Fox et al., 2005; Seeley et al., 2007; Yeo et al., 2011). The locationist approach is poorly suited for elucidating network-spanning alterations.
1.1.3 Static approach
Most existing imaging studies of stuttering have also examined structural and functional differences at a single point in time. This is problematic because stuttering is a neurodevelopmental disorder: any subtle deficiencies in stuttering are likely to change dynamically with age and be influenced by interactions with other large-scale neural networks subserving cognitive, motor, and emotion functions. To properly understand the nuances of a disorder as complex as stuttering, there is a need to study brain differences in the same individuals over an extended period of time.
1.2 Pediatric imaging, resting state fMRI, and brain networks
Historically, most functional imaging studies have used active tasks: they examine brain activity during a behavioral paradigm in which participants are presented with stimuli (e.g., picture naming, sentence reading, and word generation) and are instructed to provide a response. While this approach is well-suited for examining neural activity in adults, practical difficulties make it less feasible for examining neural activity in children. For example, young children can have considerable difficulty remaining still for the duration of a behavioral paradigm and/or may not perform sufficiently well for their data to be usable, leading to significant data loss. Indeed, the success rates of scanning children between the ages of 4–6 years is so low that researchers recruit and estimated 20–40% more subjects to make up for data loss (Yerys et al., 2009). These authors also note there are significantly higher failure rates in clinical populations as compared to typically developing children.
To overcome these issues, some researchers have utilized passive tasks such as perceiving rhythmic and arrhythmic tones that do not require behavioral responses (e.g., Chang et al., 2016; Etchell et al., 2016). Another method, which will be the focus of this report, is resting state fMRI in which participants lie awake in the scanner relaxed with their eyes open (Thomason et al., 2011). This method is well-suited to examining brain activity in children because it can be done in a very short period of time and does not involve performance of a behavioral task.
Resting state fMRI (hereafter rsfMRI) analyses have enabled identification of intrinsically connected, large-scale neural networks such as the default mode network (DMN), and this network has substantial relevance to stuttering. The discovery of the DMN was due in part to the observation that even when the brain was not engaged in a specific task, it continued to consume about 20% of the body’s oxygen, demonstrating that it is neither inactive nor simply “doing nothing.” (Fox & Raichle, 2007). This finding generated a significant amount of interest and prompted researchers to consider what the brain was doing in the absence of a task (Greicius et al., 2002). A seminal meta-analyses identified a set of regions that displayed a remarkably consistent pattern: These regions were less active during cognitively demanding tasks but more active during passive/resting control conditions (Mazoyer et al., 2001; see also Spreng et al., 2009). This set of regions, termed the DMN (Raichle et al., 2001), consisted of the posterior cingulate, bilateral temporal parietal junction, medial prefrontal, bilateral superior frontal, inferior temporal, cerebellar tonsils, and bilateral parahippocampal regions (Fox et al., 2005).
Functionally, the DMN is associated with introspective activities that are thought to predominate during the resting state: mind wandering, prospection, theory of mind, and autobiographical memory (Christoff et al., 2009; Greicius et al., 2009; Mason et al., 2007; Spreng & Grady, 2010; and see Buckner et al. 2008 for a review and Spreng et al., 2009 for a meta-analysis). Several studies have shown that the DMN exhibits an antagonistic relationship and strong negative correlations (anticorrelations) with “task positive” intrinsic connectivity networks, including dorsal attention network (DAN), ventral attention networks (VAN), and frontoparietal network (FPN) (Figure 1). Connectivity within DMN and between DMN and task positive networks has been shown to influence behavioral performance on a given task (e.g., Daselaar et al. 2004; Kelly et al., 2008a; Poole et al., 2016). For instance, Poole et al. (2016) reported that greater intra-network connectivity within the DMN was predictive of better distractor (e.g., task irrelevant information) suppression, while greater inter-network connectivity between the DMN and attention networks was predictive of poorer distractor suppression. The relationship between networks involved in speech production and the DMN appears to be more complex. For instance, it has been shown that parts of DMN can exhibit varying levels of deactivation depending on the type of words being produced (Seghier & Price, 2012).
Figure 1.
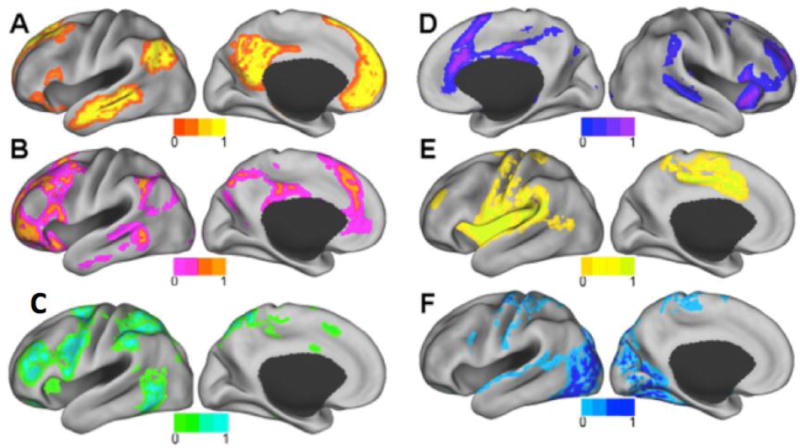
A–F. Resting state intrinsic connectivity networks (ICNs) examined in this study. A) Default mode network (DMN), B) Frontoparietal network (FPN), C) Dorsal attention network (DAN) D) Ventral attention network (VAN), E) Somatomotor network (SMN), F) Visual network (VN). Modified from Lee MH, Hacker CD, Snyder AZ, Corbetta M, Zhang D, et al. (2012) Clustering of Resting State Networks. PLoS ONE 7(7): e40370.
doi:10.1371/journal.pone.0040370.
The DMN undergoes significant change throughout the course of development (for reviews see Cao et al., 2016; Menon, 2013; Power et al., 2010). Whereas the DMN in adults exhibits strong intra-hemispheric connections and long distance connections, the DMN in children is incompletely connected (Fransson et al., 2007; Gao et al., 2009). Additionally, unlike the adult DMN, the child DMN is characterized by a partial (Fair et al., 2008) or complete (Kelly et al., 2009a) absence of anterior to posterior connections (see also Supekar et al., 2010). As children age, the DMN tends to increase connectivity within its component areas (i.e., intra-network connectivity). On the other hand, DMN shows increased segregation or anticorrelation with other intrinsic connectivity networks (i.e. inter-network connectivity) such as the DAN (Fox et al., 2005). Less segregation between networks that are normally well-differentiated during development may result in interference and inefficient coordination, which may in turn affect complex functions such as speech production and lead to neurodevelopmental disorders such as stuttering.
Resting state paradigms have been used in the context of stuttering (Chang & Zhu, 2013; Ingham et al., 2012; Joos et al., 2014; Lu et al., 2012; Lu et al., 2016; Xuan et al., 2012; Yang et al., 2016). The analysis methods used in these studies usually focused on specific regions of interest. More recently, whole-brain connectomic methods have emerged for better characterizing network structure and network changes in the brain (e.g. Allen et al., 2012; Fox et al., 2005; Kessler et al., 2016; Sripada et al., 2014). These methods have yet to be applied to childhood stuttering.
1.3 A preliminary investigation of whole brain intrinsic brain network connectivity in childhood stuttering
The motivation for the current paper was to address limitations of previous studies that have adopted “locationist” approaches, used small sample sizes (often excluding the influence of concomitant disorders), and have investigated single time points. Here we report a neuroimaging study in which 84 young children who do and do not stutter who were each scanned multiple times with rsfMRI over the course of 4–5 years. A whole-brain network analysis was performed to evaluate group differences in a comprehensive manner. We examined the brain’s intrinsic intra- and inter-network connectivity differences associated with stuttering. Furthermore, we examined whether whole brain connectivity patterns observed at the initial year of scanning could predict persistence or recovery from stuttering in later years. We hypothesized that children who stutter would differ markedly from typically developing children in 1) connectivity within the DMN and 2) connectivity between the DMN and other intrinsic connectivity networks such as somatomotor and attention networks, and 3) that patterns of network connectivity would predict recovery and persistence of stuttering.
2. Methods
2.1 Participants
Participants were recruited from an ongoing longitudinal neuroimaging study of developmental stuttering. Each participant was scanned 1 to 4 times, with each scan occurring approximately 12 months apart. At the time of the analysis for this study, 280 rsfMRI scans from 50 children who stutter (30 boys) and 45 controls (22 boys) were collected. Eight scans (2.9%) from eight subjects were excluded due to poor performance on the standardized language tests administered. Forty-eight scans (17.1%) from 33 participants were excluded due to potential contamination of movement artifacts in the rsfMRI data (the details of the exclusion criteria are presented in the data analysis section). In the final analysis, 224 high quality scans from 42 children who stutter (26 boys) and 42 controls (21 boys) were included. Additionally, final stuttering outcomes (persistence or recovery) could not be determined for 3 children who stutter due to attrition after their participation in the initial visit (e.g., family relocation); consequently the persistence logistic regression was based on 39 children who stutter. Participants’ ages at the initial visit ranged from 3.3 to 10.8 years, and the mean age was 6.5 with a standard deviation (SD) of 1.9 (for details, see Table 1). All procedures used in this study were approved by the Michigan State University Institutional Review Board. All children were paid a nominal remuneration and were given small prizes (e.g., stickers) for their participation in the experiment.
Table 1.
Demographics and behavioral scores of control and stuttering groups
| Controls, n=42 (21 boys) | Stuttering, n=42 (26 boys) | |||
|---|---|---|---|---|
| Mean (SD) | Range | Mean (SD) | Range | |
| Age at scanning (years) | 6.6 (2.0) | 3.3–10.8 | 6.4 (1.8) | 3.6–10.3 |
| SES | 6.3 (0.6) | 5.0–7.0 | 6.1 (0.8) | 4.0–7.0 |
| IQ | 114.6 (14.4) | 84–144 | 105.3 (14.7)a | 81–138 |
| PPVT | 118.5 (12.8) | 95–151 | 111.0 (15.7)a | 85–160 |
| EVT | 116.1 (14.1) | 90–149 | 106.9(11.7)a | 89–137 |
| GFTA | 105.1 (8.7) | 76–123 | 102.9 (8.0) | 77–119 |
| %SLD at the initial visit | N/A | N/A | 6.1 (4.0) | 1.1–22.5 |
| %SLD at the final visit | N/A | N/A | 4.3 (4.3) | 0.7–17.9 |
| SSI-4 at the initial visit | N/A | N/A | 21.2 (6.0)b | 13–37 |
| SSI-4 at the final visit | N/A | N/A | 20.2 (8.0)b | 11–39 |
Scores significantly lower in stuttering than controls (p<0.05)
Scores significantly higher in persistent than recovered (p<0.05)
SD = standard deviation; SES = socioeconomic status; IQ = intelligent quotient; PPVT = Peabody Picture vocabulary Test; EVT = Expressive Vocabulary Test; GFTA-2 = Goldman-Fristoe Test of Articulation; %SLD = percentage of stuttering-like disfluency; SSI-4 = Stuttering Severity Instrument Edition 4
2.2 Procedure
2.2.1 Speech, Language, Cognitive, and Motor Skills Evaluation
All participants were monolingual native North American English speakers without confirmed diagnosis of concomitant developmental disorders (e.g., dyslexia, ADHD, learning delay, psychiatric conditions). Such in/exclusion criteria were applied during the initial year of this longitudinal study; however we found that in subsequent years, 14.29% of the stuttering children went on to receive an ADHD diagnosis, 2.38% another developmental disorder, and 9.52% another psychiatric condition. The comparable percentages for controls were 2.38%, 2.38%, and 0% of that cohort, respectively. Each participant underwent careful screening to ensure normal speech and language developmental history except for the presence of stuttering in the experimental group. These tests included the Peabody Picture Vocabulary Test (PPVT-4; Dunn & Dunn, 2007), Expressive Vocabulary Test (EVT-2; Williams, 2007), Goldman-Fristoe Test of Articulation (Goldman, 2000), Wechsler Preschool and Primary Scale of Intelligence (WPPSI-III; for children 2:6–7:3; Wechsler, 2002), and Wechsler Abbreviated Scale of Intelligence (WASI; for children aged 7 and up; Wechsler, 1999). The scores of the standardized assessments are listed in Tables 1 and 2.
Table 2.
Demographics and behavioral scores of persistent and recovered groups
| Persistent, n=24 (16 boys) | Recovered, n=15 (9 boys) | |||
|---|---|---|---|---|
| Mean (SD) | Range | Mean (SD) | Range | |
| Age at scanning (years) | 6.6 (2.0) | 3.3–10.8 | 6.8 (1.7) | 3.6–10.3 |
| SES | 6.1 (0.9) | 4.0–7.0 | 6.2 (0.7) | 4.5–7.0 |
| IQ | 106.5 (15.8)a | 81–138 | 105.4 (13.1)d | 88–128 |
| PPVT | 109.1 (14.9)a | 87–160 | 116.4(16.1) | 85–147 |
| EVT | 106.4(12.2)a | 91–137 | 109.7(11.1) | 94–130 |
| GFTA | 101.0 (7.5) | 77–117 | 107.6 (6.4)c | 99–119 |
| %SLD at the initial visit | 6.7 (4.4) | 1.1–22.5 | 4.9 (3.0) | 1.8–12 |
| %SLD at the final visit | 6.0 (4.8)b | 1.8–17.9 | 1.6 (0.8) | 0.7–3.2 |
| SSI-4 at the initial visit | 21.2 (5.9)b | 13–37 | 16.4 (5.3) | 8–26 |
| SSI-4 at the final visit | 19.9 (7.9)b | 11–39 | 9.6 (2.2) | 6–13 |
Scores significantly lower in persistent than controls (p<0.05)
Scores significantly higher in persistent than recovered (p<0.05)
Scores significantly higher in recovered than persistent (p<0.05)
Scores significantly lower in recovered than controls (p<0.05)
SD = standard deviation; SES = socioeconomic status; IQ = intelligent quotient; PPVT = Peabody Picture Vocabulary Test; EVT = Expressive Vocabulary Test; GFTA-2 = Goldman-Fristoe Test of Articulation; SSI-4 = Stuttering Severity Instrument Edition 4; %SLD= percent stuttering-like disfluencies
Stuttering severity was assessed by collecting samples of spontaneous speech, elicited through storytelling and conversational tasks with a parent and a certified speech-language pathologist (SLP). These samples were video-recorded and analyzed off-line to calculate the percent occurrence of stuttering-like disfluencies (%SLD; Ambrose & Yairi, 1999). Stuttering severity was also measured using the Stuttering Severity Instrument Edition 4 (SSI-4; Riley, 2009). To ensure measurement reliability of the disfluency ratings, SSI-4 scores of a random subset (25.5%) of the speech samples were rated by a second independent SLP. The intraclass correlation (absolute agreement) between the two SLPs’ ratings was 0.96, indicating high reliability.
Of the total of 42 CWS entered into the study, 7 children scored below 3% SLD at the time of their initial testing. Of these, all but one exhibited a composite SSI score that placed them at “mild” or “moderate”. As an example, a child that scored 1.1% SLD received an SSI composite score of 20, placing her in the “moderate” stuttering severity range. Only one child’s SSI composite score was at “very mild” according to the SSI. SSI scores incorporate not only stuttering frequency, but the average duration of the three longest stuttering instances as well as any physical concomitants of stuttering. All children categorized as stuttering needed to score at least “very mild” on the SSI, in addition to the parent concerns and clinician reports indicating that the child indeed stutters.
Primarily based on yearly %SLD assessments and supplemented via SSI-4 scores of children who stutter, stuttering participants were further retrospectively categorized as recovered or persistent. Specifically, with very few exceptions (explained below), a child was considered recovered if the %SLD score was below 3% (see Buhr & Zebrowski, 2009; Yairi & Ambrose, 1992; 1999 for similar application of the 3% SLD criteria) and scored “very mild” or less in severity according to SSI at the second visit or thereafter. A child was categorized as persistent if his or her %SLD score was at or above 3% SLD at the second visit or thereafter, and the onset of stuttering had been at least 36 months prior to his most recent visit. Categorization of recovered and persistent status was also validated by clinician and parental reports as stuttering symptoms can fluctuate widely from day to day for children who stutter. If the child exhibited less than 3% SLD in his speech sample on the day of his/her visit, but parent report indicated that child was having a very mild day compared to his/her usual fluency level, and confirmed continued stuttering in the past 6 months, this child was retained in the persistent group.
On the other hand, if the child exhibited above 3% SLD that mostly comprised whole-word repetitions, exhibited very mild or less in severity according to SSI, and parent confirmed more than 6 months of continued fluency, we considered that child to have recovered. Using these criteria, we identified 15 children who recovered from stuttering (37 scans) and 24 children with persistent stuttering (63 scans). Three among the 42 children who stutter could not be categorized as either persistent or recovered, as data from only their first year visit was available due to attrition (e.g., family relocation). For controls, the inclusion criteria were as follows: never diagnosed with stuttering, no family history of stuttering, lack of parental concern for their child’s fluency, and the child’s %SLD score was < 3.
2.2.2 MRI data acquisition
During the rsfMRI scan, children lay supine with their eyes open. They were instructed to remain as still as possible. Preceding the MRI scanning session, all children were trained during a separate visit with a mock scanner to familiarize and desensitize them to the sights and sounds of the scanner and to practice being still inside the scanner bore (Chang & Zhu, 2015; Chang et al., 2016). To ensure that the child remained calm and to minimize the possibility of movement, an experimenter sat by the child throughout the duration of the scan. All MRI scans were acquired on a GE 3T Signa HDx MR scanner (GE Healthcare) with an 8-channel head coil. During each session, 180 T1-weighted 1-mm3 isotropic volumetric inversion recovery fast spoiled gradient-recalled images (3D IRFSPGR) (10 min scan time), with CSF suppressed, were obtained to cover the whole brain with the following parameters: time of echo = 3.8 ms, time 2332 ms, flip angle = 8°, field of view = 25.6 cm × 25.6 cm, matrix size = 256 × 256, slice thickness = 1 mm, and receiver bandwidth = 20.8 kHz.
2.2.3 rsfMRI
Thirty-six contiguous 3-mm axial slices were collected with a gradient-echo EPI sequence (7 min) in an interleaved order with TE = 27.7 ms, TR = 2.5 sec, flip angle = 80°, FOV = 22 cm, matrix size = 64×64, and 164 time points, with the first four data points discarded.
2.3 Analyses
2.3.1 Resting state fMRI data analysis
2.3.1.1 Preprocessing and Connectome Generation
Resting state functional images were corrected for slice acquisition times and realigned to the first volume to correct for motion using AFNI (https://afni.nimh.nih.gov/afni). Each data set was de-noised using a procedure that uses spatial independent component analysis (sICA) and pattern recognition algorithms to automatically separate and remove motion and physiological noise from signals originating from neuronal activity (Xu et al., 2014). This method has been demonstrated to be effective in removing artifact during continuous speech production as well as pediatric resting-state fMRI scans. The de-noised data sets were normalized to a standard space (ICBM152) using diffeomorphic image registration algorithm (DARTEL; Ashburner, 2007) implemented in SPM12 (http://www.fil.ion.ucl.ac.uk/spm/software/spm12/). Finally, images were smoothed with a Gaussian kernel of 6 mm full width at half maximum.
After the above preprocessing, connectomes were generated as described in our previous work (Kessler et al., 2014; 2016; Sripada et al., 2014). Briefly, first the data were linearly detrended. Then we carried out regressions to remove nuisance effects from each voxel’s time series including 24 motion parameters (6 original parameters estimated during realignment above plus their first derivatives and quadratic terms for each of these), and the first 5 principal components of each of CSF and white matter extracted from subject-specific masks using the segmented images from preprocessing above (Behzadi et al., 2007). Next, we band-pass filtered the data in the 0.01–0.10 Hz range to isolate the low-frequency signals of interest for resting state analysis. To further reduce the potential adverse effects of motions, motion scrubbing was performed via removal of individual frames from the times series that had a framewise displacement value greater than 0.5 (Power et al., 2012). Additionally, any scan which had more than half its time points removed by scrubbing was excluded from the analysis. Spatially averaged time series were extracted from each of 1101 ROIs placed in a regular 12-mm grid throughout the brain. Finally, Pearson’s correlation coefficients were calculated pairwise between time courses for each of the ROIs, producing a cross-correlation map with 605,550 non-redundant entries, and the values were transformed with Fisher’s r-to-z transform yielding a matrix of z-values for each subject.
2.3.1.2 Independent Component Analysis
We carried out a joint independent component analysis (ICA; Calhoun et al., 2006a; Calhoun et al., 2006b; Calhoun et al., 2009; Sui et al., 2011) that we have used in the past (Kessler et al., 2014; Kessler et al., 2016). The current analysis is applied to a single modality but still retains the method’s focus on identifying components that vary across scans. Additional details are provided in previous work (Kessler et al., 2014; 2016). In brief, the steps are as follows (see Figure 2). Regression-based cleansing across subjects is used to remove nuisance variation (linear and quadratic mean framewise displacement, handedness, and IQ) from each connection of the connectome. Although IQ, PPVT, and EVT were significantly lower in the persistent group relative to controls, we only included IQ in the regression model because these three measures were highly correlated (r > 0.7). After PCA-based dimensionality reduction (standard in ICA) with model order set at 15 (chosen heuristically to correspond with previous work [Kessler et al., 2014; 2016]), the FastICA algorithm was applied to these reduced data (Hyvärinen, 1999) to obtain component source maps and subject-specific expression scores (i.e., how much a given component is expressed in each subject). Components were thresholded at |z|>3 for display and nodes were grouped into the intrinsic connectivity network they belong to (based on the network parcellation of Yeo et al., 2011). The full, thresholded component maps are presented in the Appendix. Stability was assessed with ICASSO (Himberg et al., 2004) which was run 1000 times and indicated that most components were stable: 12 of the 15 components had high Iq ranging from 0.9149–.9973, two of the remaining three components (11,14) ranged from 0.8433–0.8485, and the remaining component (13) was substantially less reliable than the others (Iq= 0.7196).
Figure 2.
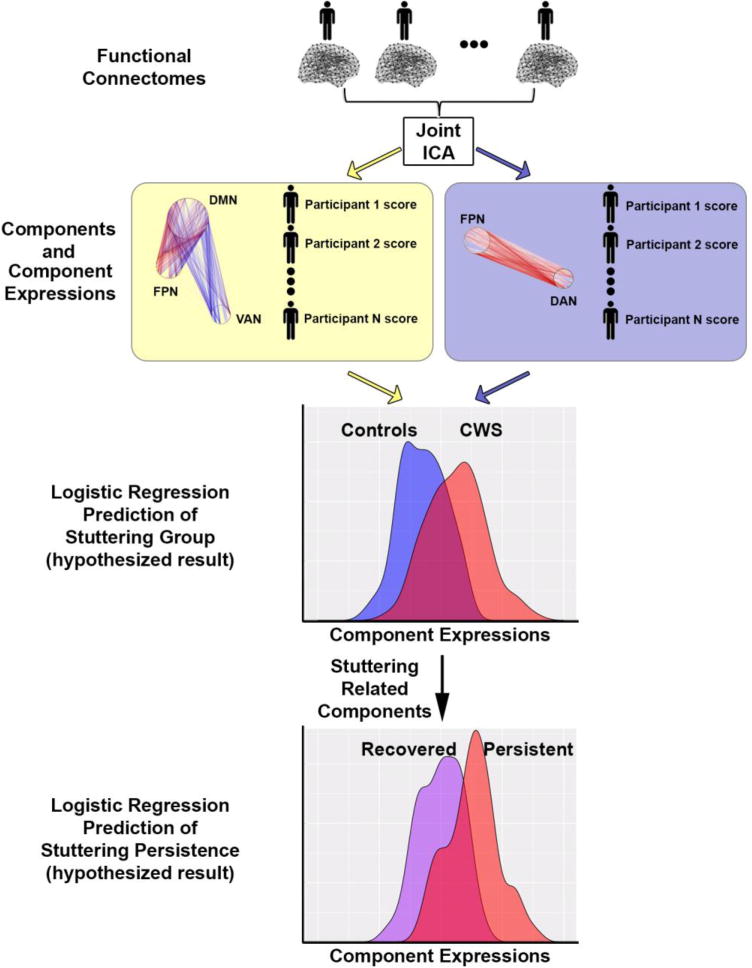
Schematic of ICA analysis stream used in this study. Resting state functional connectomes based on 224 scans (from 84 unique participants) entered into a joint ICA, which parses the connectomes into several cohesive components. The components reflect patterns of intra- and inter-connectivity across independent brain networks. Two illustrative examples of components are shown in the yellow and purple boxes. For each component, each participant was assigned an “expression score” that reflects the degree to which that component is expressed. All of these expression scores were then used as predictors of stuttering status in a multiple linear regression. In a secondary analysis, we examined whether the components that were most predictive of stuttering status also predicted persistence in stuttering. CWS, children who stutter. The density curves in the bottom sections of the figure are schematic hypothetical results, not based on real data. See text for more details.
Of note, we utilized the full dataset of scans (224) to increase the power of the ICA algorithm to identify reliable components. However, as mentioned in the introduction our primary goal for this study was to identify early markers that could predict later stuttering persistence, so the analyses discussed below only used data from the earliest scan from each of the 84 included participants. Additionally, given that the sign of components coming out of ICA is arbitrary, we chose to display all components such that increasing expression of the component is related to increased prediction of stuttering. Specifically, we ran the stuttering prediction regression model (described below) to determine the sign of the regression coefficient. For any components that had a negative coefficient, we multiplied them by −1 for results reporting and display.
2.3.1.3 Generating circle graph visualizations
The visualizations in Figures 3–5 examine the ICA component effects within pairs of networks. The procedure for generating these is discussed at length in Kessler et al. (2015). Briefly, the width of the arcs linking regions is proportional to the number of implicated connections between those regions, such that more heavily implicated regions will be connected by wider arcs. To enhance the readability of the circle graphs, arcs that represent <1% of the internetwork connections were omitted. In addition, any subregions in which both left and right sides participated in <1% of per-graph connections for all visualizations were omitted from graphs.
Figure 3.
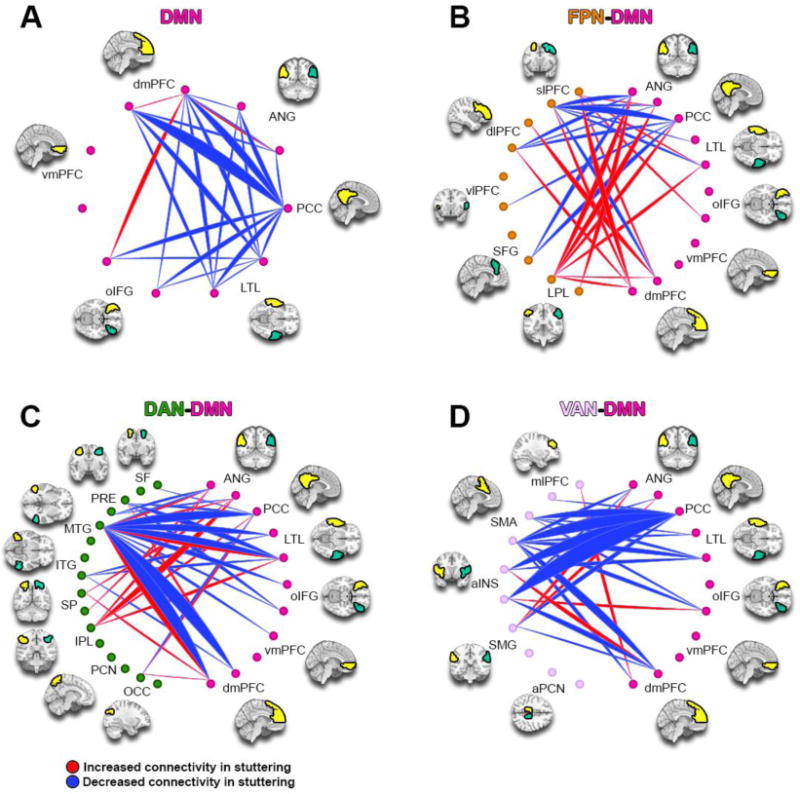
ICA Component 5. This component is more expressed in children who stutter, and predicted stuttering persistence. Red lines represent increased connectivity between regions, while blue lines represent decreased connectivity. The width of the arcs is proportional to the number of aberrant connections between regions. With the exception of PCC, all regions are presented bilaterally, with the left ROI first followed by the right ROI (counter-clockwise from the top of the figure). DMN: Default Mode Network; VAN: Ventral Attention Network: DAN: Dorsal Attention Network; FPN: Frontoparietal Network; see Table 5 for region abbreviations.
Figure 5.
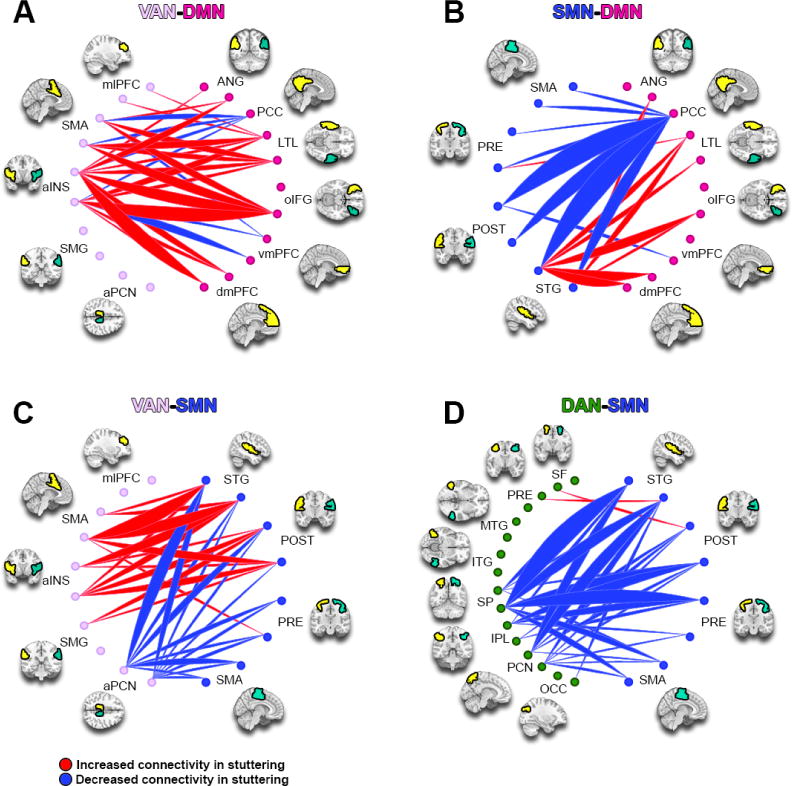
ICA Component 8. This component is more expressed in children who stutter. DAN: Dorsal Attention Network; SMN: Somatomotor Network; VAN: Ventral Attention Network; DMN: Default Mode Network. See methods and Figure 3 caption for full details.
2.3.1.4 Calculating effect of stuttering and predicting persistence in later years
As noted above, using our ICA-based method, we parsed the connectome into 15 cohesive components. Each participant received an expression score for each component, which reflects the extent to which the component is expressed in that participant’s connectome (Figure 2). To identify which components had significantly different expression as a function of stuttering diagnosis, we used a logistic multiple regression model with diagnosis (stuttering vs. control) as outcome, including sex and all 15 component expression scores as predictors. This model was compared to a model containing sex alone as a predictor to determine if the component expressions significantly improved the model. In a subsequent logistic regression model, using only those components that differentiated stuttering from controls (component expressions from the first model with p<0.05), we further examined whether component expressions predicted persistence of stuttering in later years among children who stutter. For this second regression we included component expressions for significant components as well as sex and age (linear and quadratic terms) as predictors, given their relevance to persistent stuttering (e.g., boys, and older children among children who stutter, are more likely to exhibit persistent stuttering; Yairi & Ambrose, 1999). This model was compared to a model with just sex and age (linear and quadratic) as predictors to determine if component expression significantly improved the model. Finally, in order to determine whether the effects we observed in the above analyses were specific to stuttering and not driven by comorbid attention or other psychiatric conditions, we performed two additional subset analyses. In each case we repeated the joint ICA component identification and subsequent regression models for stuttering and persistence when 1) removing all subjects with a comorbid ADHD diagnosis or subclinical attention problems (N=7) and 2) removing all subjects with any comorbid psychiatric diagnosis (N=9).
3. Results
3.1 Participant demographic data
Children with persistent stuttering (“persistent”), those recovered from stuttering (“recovered”), and typically developing fluent controls did not differ in mean age, socioeconomic status, or sex ratio. Compared with controls, the persistent group scored significantly lower on IQ, PPVT, and EVT (p < 0.05; Table 1), but the recovered group did not differ significantly from controls in any of these tests. Persistent and recovered groups differed significantly on the GFTA. Because of this group difference, we added GFTA as a nuisance variable in subsequent regression analyses (see below). The two stuttering groups did not differ on any other standardized test score, and did not differ in average chronological age or sex ratio. Stuttering severity measures were not included in the model because severity was used to define persistent and recovered groups. As expected, the difference in stuttering severity became highly significant based on measurements acquired at subsequent visits (p<0.01), indicating the divergence of symptoms between the stuttering groups with progressing age.
3.2 Intrinsic connectivity of large scale brain networks associated with stuttering that predict stuttering persistence
Our logistic regression model identified four components (5,7,8,15) that were significantly predictive of stuttering diagnosis (ps<0.05). This overall regression model (all 15 components plus sex) was significantly better than the sex alone model with a likelihood ratio test (χ215 = 36.02, p=0.0018). Of these, component 15 was found to be highly significantly related to nuisance variation (regression model with component expression as outcome and handedness, IQ, and linear and quadratic mean framewise displacement as predictors, F4,79 = 68.26, p <2.2×10⁻¹⁶), despite the pre-ICA cleansing, so it was dropped from the following model. We restricted our subsequent analyses to predict recovery/persistence with a logistic regression with the remaining 3 component expressions (5,7,8) as predictors. This overall model with component expressions plus sex and linear and quadratic age was significantly better than the model with just sex and linear and quadratic age (χ23 = 22.96, p = 0.000046), with component 5 being individually significant (p = 0.035). This component predicted whether a child would persist or recover in a direction consistent with the prediction of stuttering/non-stuttering status (i.e., increased expression of this component was associated with both presence and persistence of stuttering).
As noted in the behavioral analysis, there was a significant difference between persistent and recovered children in GFTA scores. Because of this, we ran a second logistic regression adding GFTA as a predictor to our previous model to determine if our conclusions would change. Inclusion of GFTA did not significantly increase the predictive value of this model (χ21 = 1. 2628, p = 0.26). Component 5 remained significant in this model (p = 0.049).
3.3 Component 5 showed decreased intra-network connectivity in DMN, and aberrant connectivity between DMN and task positive networks for stuttering children; this component also predicted persistent stuttering
Component 5 (Figure 3) showed an overall decreased intra-network connectivity for DMN associated with stuttering (and persistence); most components within this network showed decreases, with noted exceptions between the left inferior frontal gyrus (IFG -left dorsomedial prefrontal cortex (dmPFC), and between left dmPFC-left angular gyrus (Ang), where there was increased connectivity (Figure 3A).
Connectivity between the DMN and FPN showed overall increases, with notable involvement of the bilateral dmPFC, Ang, posterior cingulate cortex (PCC), and lateral temporal lobe (LTL) of the DMN and their connections to the lateral parietal lobule, superior frontal cortex, and dorsal lateral prefrontal cortex of the FPN (Figure 3B). In terms of inter-network connectivity between DMN and attention networks (DAN, VAN), the results showed both increases and decreases. For connections with DAN, there were hyper-connectivities involving the left inferior parietal lobe (IPL) and its connections with the bilateral angular gyrus and bilateral lateral temporal lobe (LTL), whereas there was vast hypo-connectivity involving the left MTG and its connections to the bilateral dmPFC, bilateral LTL, and PCC (Figure 3C). The connectivity between DMN and VAN showed overall greater hypo-connectivities, especially involving the PCC. However, there was increased connectivity between left anterior insula (aINS) and right dmPFC, between right aINS and left oIFG, and between bilateral Ang and the SMG (Figure 3D). For this component (5), increased component expression was significantly correlated with greater risk of persistent stuttering (Z = 2.11, p = 0.035).
3.4 Component 7 showed decreased connectivity between the dorsal attention and visual networks for stuttering children
Component 7 (Figure 4) showed overall decreased intra-network connectivity in the VN (Figure 4A) and between the VN-DAN that was associated with stuttering. The bulk of the hypoconnectivities occurring between the VN and DAN involved the left MTG of the DAN (Figure 4B). Connectivity between VN and DMN was primarily decreased, with the exception of connections involving DMN nodes left PCC and left dmPFC (Figure 4C).
Figure 4.
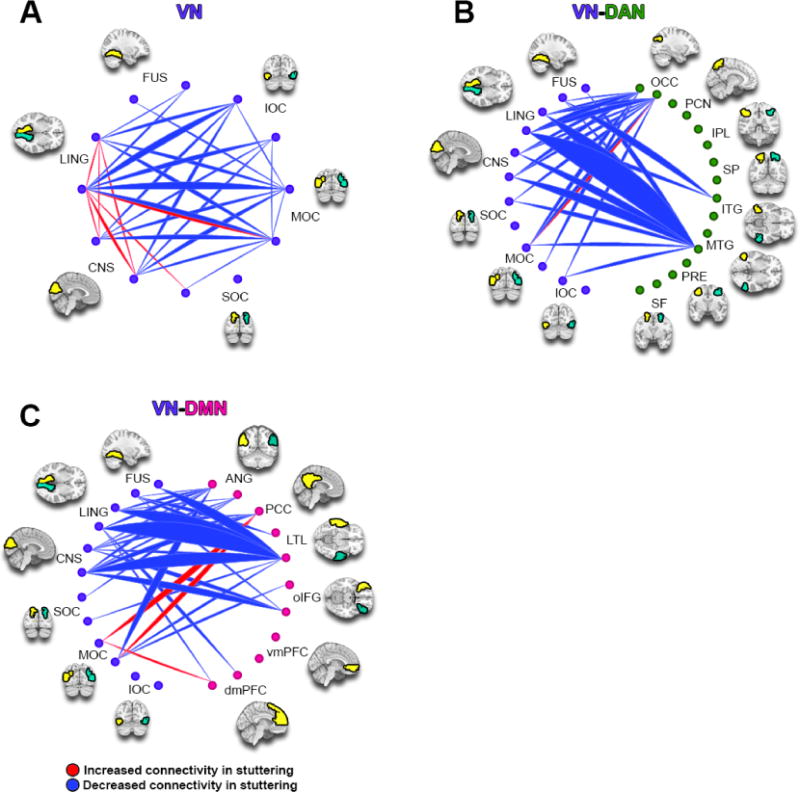
ICA Component 7. This component is more expressed in children who stutter than those who do not. VN: Visual Network; DAN: Dorsal Attention Network; DMN: Default Mode Network. See methods and Figure 3 caption for full details.
3.5 Component 8 showed increased inter-network connectivity between DMN and VAN, and mixed results between SMN and VAN; however SMN -DAN connectivity largely decreased in stuttering
In component 8 (Figure 5), the inter-network connectivity between DMN and VAN was predominantly heightened, except for connections between the left PCC-bilateral insula, bilateral SMA and right insula-bilateral ventromedial prefrontal cortex (vmPFC), where there were hypo-connectivities between the two networks (Figure 5A). Connectivity between DMN and SMN showed decreases involving the PCC node of the DMN; the connectivity involving the SMN node left STG however showed increased connectivity with many DMN regions (Figure 5B). Inter-network connectivity involving the SMN and attention networks showed interesting and contrasting patterns. The SMN-VAN exhibited predominantly hyper-connectivity among primarily SMA and insula but hypo-connectivity between precuneus and all SMN regions (Figure 5C), whereas the SMN-DAN connectivity was overall decreased (Figure 5D).
3.6 Subset Analysis without Comorbid Disorders
In the repeated analysis excluding participants with diagnosed ADHD or subclinical attention problems, all of the components that were significant in the previous stuttering diagnosis model (5,7,8, and 15) were significant in this model (Table 6), with component 15 still being related to nuisance measures and dropped from the subsequent model. The model with component expressions and sex was still significantly better than the model with sex alone (χ215 = 45.54, p=0.000062). In the persistence model, component 5 was still individually significant, and the overall model with expressions, sex, and linear and quadratic age was better than the model with sex and linear and quadratic age alone (χ23 = 24.54, p=0.000019).
Table 6.
Regression statistics for the logistic regressions predicting stuttering diagnosis and persistence in the original models (N=84/39) versus two subset analyses without 1) ADHD comorbidity (N=77/34); and 2) any psychiatric comorbidity (N=75/32).
| Component | Full Sample | No ADHD | No Comorbidity | |||
|---|---|---|---|---|---|---|
| Z value | p value | Z value | p value | Z value | p value | |
|
| ||||||
| Stuttering Diagnosis | ||||||
| 5 | 2.193 | 0.028* | 2.259 | 0.024* | 2.208 | 0.027* |
| 7 | 2.005 | 0.045* | 2.311 | 0.021* | 2.275 | 0.023* |
| 8 | 2.370 | 0.018* | 2.480 | 0.013* | 2.595 | 0.0095* |
| 15 | 2.544 | 0.011* | 2.995 | 0.0027* | 2.563 | 0.010* |
| Stuttering Persistence | ||||||
| 5 | 2.110 | 0.035* | 2.072 | 0.038* | 1.879 | 0.060 |
| 7 | 1.792 | 0.073 | 1.861 | 0.063 | 1.732 | 0.083 |
| 8 | −1.754 | 0.080 | −1.137 | 0.255 | −1.105 | 0.269 |
For the analysis excluding all participants with a comorbid psychiatric diagnosis all of the components that were significant in the original stuttering diagnosis model remained significant. The model with component expressions and sex was still significantly better than the model with sex alone (χ215 = 41.96, p=0.00023). In the persistence model, component 5 was no longer individually significant, however the overall model with expressions, sex, and linear and quadratic age was still significantly better than the model with sex and linear and quadratic age alone (χ23 = 24.19, p=0.000023).
4. Discussion
Abnormal connectivity within and between intrinsic connectivity networks (ICNs) is implicated in a host of neurodevelopmental disorders such as autism (Washington et al., 2014), attention-deficit/hyperactivity disorder (Sripada et al., 2014; Kessler et al., 2016), developmental dyslexia (Schurz et al., 2015), and other psychopathologies such as anxiety disorders and schizophrenia (see Broyd et al. 2009; Menon 2011; Whitfield-Gabrieli & Ford, 2012 for reviews; and see also Songua-Barke & Castellanos, 2007). Here we provide the first evidence supporting the presence of anomalous ICN architecture in stuttering children. The current study used whole brain ICA to compare inter and intra-network connectivity in a large sample of children who do and do not stutter and who were each scanned multiple times over a number of years. We found that children who stutter exhibit abnormal connectivity within default mode network (DMN) as well as between DMN and other ICNs (see Figure 6 for a summary). In addition, we showed these network changes predict whether stuttering subsequently resolves or persists. Based on these results we provide an updated view of possible pathomechanisms associated with childhood stuttering.
Figure 6.
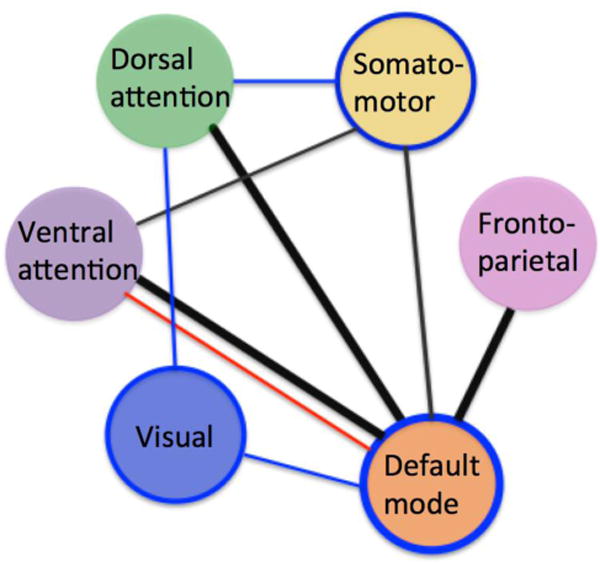
A summary of ICN relationships associated with stuttering and persistence. All lines indicate those connections expressed to a greater extent in stuttering children; the thick lines represent those connections further associated with stuttering persistence. Blue lines indicate decreased connectivity found in stuttering children relative to controls; red lines, increased connectivity. Black lines indicate anomalous connectivity in children who stutter relative to controls, showing both increases and decreases among specific nodes of each network. Those networks with blue border represent those networks with significant intra-network connectivity decreases in children who stutter relative to controls.
4.1 Anomalous connectivity within the DMN predicts persistent stuttering
We observed hypo-connectivity within DMN nodes in stuttering children (Figure 3A), particularly involving PCC, a major hub of the DMN involved in allocation of attention (Leech et al., 2011). The PCC is an important point of connection between DMN and other ICNs (Hagmann et al., 2008). Interestingly, recent work has demonstrated that administering the dopamine agonist L-DOPA reduces connectivity between right caudate and PCC as well as other regions within the DMN (Kelly et al., 2009b). There is some theoretical (Alm, 2004) and empirical (Civier et al., 2013; Wu et al., 1997) evidence that stuttering is associated with excess levels of dopamine in the basal ganglia. Taken together, these studies suggest the possibility that the aberrant connectivity of PCC found in the current study may be related to dopamine levels. Although we did not examine dopamine levels, or directly examine connections with the putamen, we observed reduced connectivity between PCC and inferior frontal gyrus (pars orbitalis), lateral temporal lobe, and dmPFC within the DMN in children who stutter and those who persist in stuttering. Our results therefore point to a role for PCC in stuttering, which in turn might be explained in terms of altered levels of dopamine.
The DMN undergoes development during childhood that generally leads to increased intra-network connectivity among DMN nodes, while increasing segregation with other ICNs (Fair et al., 2007, Kessler et al., 2016; see Menon, 2013 for a review). The overall decreased intra-network connectivity within the DMN in the present study (along with other inter-network patterns found in component 5) was associated with stuttering in general as well as stuttering persistence. This suggests that coherent development of DMN may be compromised in children who stutter. Aberrant development of the DMN may affect how this network interacts with other networks, leading to inappropriate DMN activity that interferes with task-related functions (Songua-Barke & Castellanos, 2007) such as speech motor control.
4.2 Anomalous connectivity between the DMN and other ICNs is predictive of persistent stuttering
Connectivity between DMN and other ICNs, such as DAN, was able to predict whether a child would exhibit persistent stuttering (versus recover) in later years. Hyper-connectivity of the left inferior parietal lobule (IPL) in DAN with multiple nodes of the DMN is particularly interesting. Simonyan and Fuertinger (2015) showed that the IPL and the cerebellum are significantly more active during speech production than at rest and concluded that these regions facilitated the transition from rest to speech. One explanation for the heightened connectivity found in stuttering children between left IPL and DMN may be related to inefficient transitioning from rest to speech. Indeed, people who stutter often have difficulty initiating speech movements as indicated by smaller motor evoked potentials in the left tongue motor representation of the motor cortex (Neef et al., 2015) and elevated motor thresholds as measured from the hand area of the motor cortex (Busan et al., 2013;see also Alm et al., 2013) relative to their fluent peers. It is also interesting to note that administration of dopamine antagonists increases the degree of anticorrelation of DMN and the inferior parietal regions (Cole et al., 2013). This may have particular relevance for stuttering. Dopamine antagonists, such as Olanzapine (Lavid et al., 1999; Maguire, 2004), Risperidone (Maguire et al., 2000) as well as other drugs (Stager et al., 2005), have been used to treat stuttering to enhance fluent speech (see for review Maguire et al. 2012). The current data provide potential brain network-based explanations for how dopamine antagonists may help achieve fluent speech in some speakers who stutter (i.e., they facilitate the transition of rest to an active state for the speech production network).
We also observed prominent hypo-connectivity between DMN and DAN, most of which involved left middle temporal gyrus (MTG), an important hub within DAN. The MTG undergoes significant changes between the ages of 3 and 5 (Xiao et al., 2016) during which time there is a decrease in the dominance of the right hemisphere and a shift to more bilateral organization. This is also the period when stuttering typically emerges (Yairi & Ambrose, 1992). MTG is a critical region involved in semantic access and association, including word retrieval and translating semantics (word meaning) to phonology (speech sounds; Price, 2012). The MTG is more active when attending to speech compared to passively listening to the same stimuli (Hugdahl et al., 2003). The right and left MTG (along with the STG, left IFG, and insula) are associated with lexical and non-lexical lip reading (Paulesu et al., 2003). Interestingly, in a group analysis, MTG was the only region of the brain to exhibit common activation between viewing silent speech and the auditory perception of speech (Hall et al., 2005). It is also more active when viewing moving rather than stationary lips (Calvert & Campbell, 2003), indicating that it has a role in visual attention to speech related stimuli. The aberrant connectivity of this region and DMN perhaps suggests deficiencies in attention processes that enable perception of subtle orofacial movements during the course of speech development in children who stutter.
We observed increased connectivity between DMN and two task positive networks, FPN and DAN, in component 5, and this component was found to predict persistent stuttering. These findings can be explained in terms of the default network interference model (Songua-Barke & Castellanos, 2007). During childhood, nodes within DMN increase connectivity with age, and at the same time DMN segregates from (i.e., exhibits increasing anticorrelations with) task-positive ICNs (Fair et al., 2009; Supekar et al., 2009). This segregation appears to support efficiency of task-positive networks, including those supporting attention and motor task performance. Diminished segregation might allow intrusion of DMN activity that causes inefficient functioning of task-positive processes (Zou et al., 2013) and behavioral variability (Kelly et al., 2008; Poole et al., 2016).
In addition, we found substantial connectivity increases between DMN-VAN in component 8 for children who stutter. This observation reflects aberrant connectivity patterns associated with stuttering regardless of eventual persistence or recovery. This finding may also go some way to explaining heterogeneity of stuttering symptoms, possibly as a result of difficulties in controlling the allocation of attention across networks.
4.3 Anomalous connectivity within and between ICNs associated with stuttering regardless of eventual persistence or recovery
4.3.1 A dissociation between the dorsal and ventral attention networks and their interaction with the somatomotor network
Another interesting result from the current study concerned inter-relationships between SMN, DAN, and VAN (component 8). Specifically, we observed an overall decrease in connectivity between SMN and DAN, but an increase in connectivity between SMN and VAN, the latter especially involving the anterior insula. This is intriguing because these attention networks are associated with different forms of attention control. Whereas DAN is associated with goal driven behavior and top-down control crucial for auditory attention, VAN is linked with attention to infrequent or unexpected events (Vossel et al., 2014). The dissociation of the two attention networks in their relationship with SMN suggests an imbalance in how attention processes regulate speech motor control. In the context of speech acquisition, such an imbalance might take the form of invalid or behaviorally irrelevant cues taking precedence over more important valid cues in guiding speech movements. For example, a child who stutters may pay more attention to facial expression or gestures than either voice or lip movement (we elaborate on this point below).
We observed hyper-connectivity of a major node of VAN–the anterior insula–and SMN. The left anterior insula has been established as a critical region supporting articulatory planning (Wise et al., 1999; Dronkers, 1996) as well as voluntary control of breathing (Ackermann & Riecker, 2010), which is highly relevant for phonation for speech and singing (Zarate et al., 2010). More relevant to its role in VAN, the anterior insula has been implicated in salience processing (i.e., detecting salient stimuli in the external environment) and in regulating shifts between introspective and extrospective modes of attention (Menon et al., 2010; Sridharan et al., 2008). Hyper-connectivity between anterior insula and SMN may therefore contribute to inefficiencies in utilizing attention during speech motor control in children. For example, aberrant salience attribution by anterior insula could produce excessive distractibility by situational stimuli; diminished anterior insula regulation of DMN might contribute to intrusion of DMN during speech production (resulting in disruptions during speech).
The observed increased connectivity involving VAN is in line with a large body of work demonstrating that children who stutter frequently meet the diagnostic criteria for attention disorders (Riley & Riley, 2000) or meet referral criteria for additional evaluation (Donaher & Richels, 2012) and have difficulty orienting attention (Eggers et al., 2012). Notably, orienting attention depends on one’s ability to select information from competing sensory inputs (Lepsien & Nobre, 2006) and is relevant to salience processing (Uddin, 2015). More generally, abnormal functioning of VAN corroborates a large body of work demonstrating that children who stutter exhibit poorer performance on cognitive tasks involving attention regulation (Felsenfeld et al., 2010; Piispala et al., 2016), inhibitory control (Eggers et al., 2013; see also Piispala et al., 2016), adaptability to change (Anderson et al., 2003), emotion (Jones et al., 2014; Karrass et al., 2006), and dual task conditions (Bosshardt, 2006; Smits-Bandstra & De Nil, 2009; Vasic & Wijnen, 2005). The current data largely support the view based on previous behavioral studies that have found that children who stutter may have a tendency to focus on less important sensory cues, in addition to being more sensitive to interference from increased attentional demands (Bajaj, 2007; Bosshardt, 2006). The current findings involving VAN may explain some of these observations, which could elucidate the basis for transient disruption in speech production that are affected by aberrant attention processes in children who stutter.
4.3.2 Anomalous connectivity involving the visual network
In one of the network components associated with stuttering (component 7, Figure 4), prominent decreases in connectivity within VN were observed. This might seem surprising as speech production is widely thought to be primarily an auditory and motor task; when learning to speak, the child attempts to generate motor movements to hit an auditory target (Hickok, 2012). This process relies heavily on auditory perception. This is evidenced by detrimental effects of hearing difficulty on the intelligibility of speech in children (e.g. Tobey et al., 1991) and deterioration in speech intelligibility following adult onset deafness (Waldstein, 1990). But auditory information is not the only sensory input; learning to speak also relies on visual perception of articulatory movements. Weikum et al., (2007) reported that 4–6 month old infants can discriminate between languages (French versus English) using visual cues only (i.e., silent videos showing articulations). Electrophysiological work shows that visual cues not only enhance auditory cues (e.g., Crosse et al., 2015; see Peelle & Sommers, 2015 for a review), but that they actually precede them (Strelnikov et al., 2015). In line with this reasoning, Venezia et al. (2016) propose that “exposure to visual speech during acquisition of speech production establishes the neural circuitry linking visually-perceived gestures to the speech motor system.” If visual information is used to facilitate speech acquisition, aberrant function of VN could interfere with this process. We speculate that a deficit in VN could render a child vulnerable to developing stuttering by introducing subtle deficiencies in linking visually perceived speech movements and auditory stimuli, in turn affecting his or her ability to produce fluent speech. However, since this network component was associated with a risk for stuttering and not strongly with persistent stuttering, any such deficit is most likely subtle and transient.
4.5 Implications for pathomechanisms of stuttering risk and persistence
We report the first whole brain connectomic study of stuttering, based on the largest ever longitudinally acquired rsfMRI dataset from children who do and do not stutter. The present findings support the view that stuttering is a complex neurodevelopmental disorder with multiple factors that dynamically interact to influence symptom onset, persistence, and recovery. Our results are particularly interesting in light of theoretical models that attempt to explain heterogeneity of stuttering and fluctuations in symptom severity over the course of a day, weeks, or months. A number of models of stuttering—the conditioned disintegration theory (Brutten & Shoemaker, 1967), the demands and capacities model (Starkweather & Gottwald, 1990), the dual diathesis stress model (Conture & Walden, 2012; Walden et al., 2012), the variable release threshold hypothesis (Brocklehurst et al., 2013), as well as other multifactorial models of stuttering (e.g. Packman, 2012; Smith, 1999) — all emphasize the importance of situational, emotional, attentional and linguistic factors that impinge upon a vulnerable speech motor system that may ultimately lead to moments of disfluent speech. The results from our study seem to corroborate these ideas and demonstrate that anomalous connectivity among networks that support attention, motor, perception, and emotion not only place individuals at risk for stuttering, but may influence whether a child persists or recovers from stuttering.
To date, most studies examining the neural bases of stuttering have focused on cortical and subcortical areas that have an established relationship in supporting speech production processes. These studies have led to insights into “neural signatures of stuttering” (Brown et al., 2004), stuttering trait (differences that are present in speakers who stutter regardless of speaking condition), and state (differences between stuttered versus fluent speaking in speakers who stutter) that could be linked to anomalous brain structure and function (Belyk et al., 2015; Budde et al., 2014; Neef et al., 2015). A limitation in taking such localization approaches, however, is that a comprehensive understanding of the neural mechanisms behind complex disorders such as stuttering is likely not found in one or several areas of the brain, or even several different connections among these areas. Rather, large-scale interactions among neural networks that include but are not necessarily limited to speech motor networks are likely involved. Furthermore, previous studies could not provide satisfactory explanations on the heightened rate of comorbidity with other neurodevelopmental conditions in stuttering, or the basis for the variability and heterogeneity of symptoms commonly found across individuals who stutter. In this study, using a novel whole brain connectomics approach, we were able to confirm anomalous intra-network connectivity within the somatomotor network (SMN) that include most of the speech motor related areas as have been reported in previous studies. Decreased network connectivity within the SMN was present in both persistent and recovered children, indicating this is a common risk factor regardless of eventual clinical outcome. There were important findings on inter-network connectivity involving the SMN and other networks, however, which provide new insights into neural mechanisms that differentiate those children who go on to develop persistent stuttering, versus those that recover.
More specifically, the present results point to aberrant connectivity of major ICNs, including those supporting internally directed mentation (DMN), attention and executive control (VAN, DAN, FPN), sensory/motor processes (SMN), and vision (VN) in stuttering children. Furthermore, the intra-network connectivity in DMN and its connections with attention and executive control networks predicted persistent stuttering. These results suggest that while stuttering children in general have abnormal connectivity in networks relevant to speech motor control (e.g., SMN), persistent stuttering seem to be associated with connectivity differences that primarily involve DMN and its connectivity with attention and executive control networks. According to the default network interference model (Songua-Barke & Castellanos, 2007), DMN intrudes on task positive networks and adds variability in performance of externally directed tasks. Normalized connectivity involving DMN and attention, executive control networks may mean that, relative to persistent children, these functions are better differentiated from DMN in recovered children. In future studies, these ideas will be explored in more detail in order to reveal large-scale brain connectivity differences that explain heterogeneity and variability of stuttering symptoms, and to delve deeper into the connectivity changes associated with recovery. Finally, these findings may help guide development of mechanism based treatment approaches in the future.
4.6 Caveats and future directions
The present study has several limitations. First, our results are primarily correlational. It is presently unclear what the etiological and causal relationships are between various observed network patterns (e.g., reduced within-DMN connectivity and reduced anti-correlations between DMN-DAN). These relationships will need to be explored in future studies using sophisticated analytic methods, such as dynamic causal modeling (Friston et al., 2003) and granger causality analysis (Roebroeck et al., 2005), that provide evidence of the causal influence of one brain region on another. Second, in the present study, the full dataset of scans (224) was used to increase the power of the ICA algorithm to identify reliable components that differentiated between stuttering and fluent groups. However, we did not interrogate the effects of other behavioral measures in modulating network connectivity across development. Instead, the goal for this initial investigation was to identify early markers (based on the initial scan of each child) that could predict later stuttering persistence. In future studies, we are planning to acquire more than twice the number of scans reported in this study, which will allow us to conduct detailed analyses of the biological factors (sex, age) and other behavioral and treatment factors that could potentially affect longitudinal trajectories of change.
The determination of whether a child was recovered was based on consideration of multiple data points, including speech sample analysis as well as parent and clinician reports. For example, to be considered “recovered”, children must have been exhibiting fluent speech for 6 or more months, in addition to having less than 3% SLD in their speech samples on the day of the assessment (and at or lower than “very mild” on SSI composite rating). These assessments took place every year for 3 years. This means that we had the opportunity to reassess the children’s fluency and revisit our judgment about persistence or recovery at any additional later time point. For the majority of the children, at least 2 additional time points after the initial visit were available for us to determine persistence vs. recovery, and thus we are confident about the assignment of children into persistent versus recovery groups. However, there is a small chance that some children in the persistent group could still grow out of stuttering, or that some children in the recovered group could relapse back into stuttering. While the chances that a change in persistent or recovery status could occur 3–4 years post stuttering-onset (which is the case for the majority of our children) is slim, we nevertheless plan to monitor these children in future years to confirm persistence versus recovery.
It is also possible that there is individual variability within the group of stuttering children in terms of connectivity among DMN and other ICNs, as was observed in this study. These differences can be explored in conjunction with detailed consideration of behavioral data across development, with the goal of finding objective network connectivity markers that predict individual trajectories. Identification of such network markers may lead to better diagnosis and the development of individualized treatments. We expect that such efforts would significantly contribute to better understanding of the complex neural mechanisms associated with childhood stuttering onset, persistence, and recovery.
Supplementary Material
Table 3.
Regression coefficients, statistics, and odds ratios for the logistic regression predicting stuttering diagnosis from the 15 component expressions derived from the ICA analysis. Components 5, 7, 8, and 15 were significantly related to stuttering diagnosis (ps<0.05).
| Component | Coefficient | Z value | p-value | Odds Ratio |
|---|---|---|---|---|
|
| ||||
| 1 | 0.637 | 1.904 | 0.057 | 1.890 |
| 2 | 0.091 | 0.227 | 0.820 | 1.096 |
| 3 | 0.335 | 0.846 | 0.398 | 1.398 |
| 4 | 0.163 | 0.413 | 0.680 | 1.177 |
| 5 | 1.045 | 2.193 | 0.028* | 2.844 |
| 6 | 0.804 | 1.768 | 0.077 | 2.234 |
| 7 | 1.208 | 2.005 | 0.045* | 3.347 |
| 8 | 1.054 | 2.370 | 0.018* | 2.870 |
| 9 | 0.030 | 0.082 | 0.935 | 1.030 |
| 10 | 0.227 | 0.583 | 0.560 | 1.255 |
| 11 | 0.192 | 0.598 | 0.550 | 1.212 |
| 12 | 0.785 | 1.140 | 0.254 | 2.193 |
| 13 | 0.062 | 0.183 | 0.855 | 1.064 |
| 14 | 0.637 | 1.689 | 0.091 | 1.892 |
| 15 | 2.983 | 2.544 | 0.011* | 19.743 |
Table 4.
Regression coefficients, statistics, and odds ratios for the logistic regression predicting stuttering persistence from the 3 retained significant components from the stuttering diagnosis regression. Component 5 was significantly related to stuttering persistence in a consistent direction (i.e. increased expression of component 5 predicted both presence and persistence of stuttering, ps<0.05).
| Component | Coefficient | Z value | p-value | Odds Ratio |
|---|---|---|---|---|
|
| ||||
| 5 | 4.021 | 2.110 | 0.035* | 55.796 |
| 7 | 3.501 | 1.792 | 0.073 | 33.143 |
| 8 | −1.633 | −1.754 | 0.080 | 0.195 |
Table 5.
List of intrinsic connectivity networks (ICN) and abbreviations for subregions used in figures, arranged by ICN.
| Network | Abbreviation | Region Name |
|---|---|---|
|
| ||
| Visual Network (VN) | FUS | Fusiform Gyrus |
| LING | Lingual Gyrus | |
| CNS | Cuneus | |
| SOC | Superior Occipital Cortex | |
| MOC | Middle Occipital Cortex | |
| IOC | Inferior Occipital Cortex | |
|
| ||
| Somatomotor Network (SMN) | SMA | Supplementary Motor Area |
| PRE | Precentral Gyrus | |
| POST | Postcentral Gyrus | |
| STG | Superior Temporal Gyrus | |
|
| ||
| Dorsal Attention Network (DAN) | SF | Superior Frontal |
| PRE | Precentral Gyrus | |
| MTG | Middle Temporal Gyrus | |
| ITG | Inferior Temporal Gyrus | |
| SP | Superior Parietal | |
| IPL | Inferior Parietal Lobule | |
| PCN | Precuneus | |
| OCC | Occipital Cortex | |
|
| ||
| Ventral Attention Network (VAN) | mlPFC | Middle Lateral Prefrontal Cortex |
| SMA | Supplementary Motor Area | |
| aINS | Anterior Insula | |
| SMG | Supramarginal Gyrus | |
| aPCN | Anterior Precuneus | |
|
| ||
| Frontoparietal Network (FPN) | slPFC | Superior Lateral Prefrontal Cortex |
| dlPFC | Dorsolateral Prefrontal Cortex | |
| vlPFC | Ventrolateral Prefrontal Cortex | |
| SFG | Superior Frontal Gyrus | |
| LPL | Lateral Parietal Lobule | |
|
| ||
| Default Mode Network (DMN) | dmPFC | Dorsomedial Prefrontal Cortex |
| vmPFC | Ventromedial Prefrontal Cortex | |
| oIFG | Orbital Inferior Frontal Gyrus | |
| LTL | Lateral Temporal Lobe | |
| PCC | Posterior Cingulate Cortex | |
| ANG | Angular Gyrus | |
Highlights.
-
–
We conducted a whole-brain network analysis based on resting state fMRI scans collected across multiple time points from children who do and do not stutter.
-
–
Using an independent component analysis that allows quantification of the “expression” of connectivity patterns across large-scale brain networks, we found evidence of aberrant connectivity involving the default mode and other networks in children who stutter.
-
–
Anomalous network connectivity patterns found in earlier scans were able to predict whether a child would persist in, or recover from, stuttering in later years.
Acknowledgments
The authors wish to thank all the children and parents who participated in this study. We also thank Kristin Hicks for her assistance in participant recruitment, behavioral testing, and help with MRI data collection, Scarlett Doyle for her assistance in MRI data acquisition, and Ashley Larva for her assistance in speech data analyses. This study was supported by the National Institute on Deafness and other Communication Disorders (NIDCD) (R01DC011277) to SC and the Matthew Smith Stuttering Research Fund to SC. The content is solely the responsibility of the authors and does not necessarily represent the official views of the NIDCD or the National Institutes of Health.
Abbreviations
- ADHD
Attention deficit hyperactivity disorder
- DMN
Default mode network
- DAN
dorsal attention network
- FPN
frontoparietal network
- GFTA
Goldman-Fristoe Test of Articulation
- ICA
independent component analysis
- ICN
intrinsic connectivity network
- rsfMRI
resting state functional magnetic resonance imaging
- SMN
somatomotor network
- VAN
ventral attention network
- VN
visual network
Footnotes
Publisher's Disclaimer: This is a PDF file of an unedited manuscript that has been accepted for publication. As a service to our customers we are providing this early version of the manuscript. The manuscript will undergo copyediting, typesetting, and review of the resulting proof before it is published in its final form. Please note that during the production process errors may be discovered which could affect the content, and all legal disclaimers that apply to the journal pertain.
References
- Ackermann H, Riecker A. The contribution(s) of the insula to speech production: a review of the clinical and functional imaging literature. Brain Structure and Function. 2010;214(5–6):419–433. doi: 10.1007/s00429-010-0257-x. [DOI] [PubMed] [Google Scholar]
- Allen EA, Damaraju E, Plis SM, Erhardt EB, Eichele T, Calhoun VD. Tracking whole-brain connectivity dynamics in the resting state. Cerebral cortex. 2012 doi: 10.1093/cercor/bhs352. bhs352. [DOI] [PMC free article] [PubMed] [Google Scholar]
- Alm PA. Stuttering and the basal ganglia circuits: a critical review of possible relations. Journal of communication disorders. 2004;37(4):325–369. doi: 10.1016/j.jcomdis.2004.03.001. [DOI] [PubMed] [Google Scholar]
- Alm PA, Karlsson R, Sundberg M, Axelson HW. Hemispheric lateralization of motor thresholds in relation to stuttering. PloS one. 2013;8(10):e76824. doi: 10.1371/journal.pone.0076824. [DOI] [PMC free article] [PubMed] [Google Scholar]
- Ambrose NG, Yairi E. Normative disfluency data for early childhood stuttering. Journal of Speech, Language, and Hearing Research. 1999;42(4):895–909. doi: 10.1044/jslhr.4204.895. [DOI] [PubMed] [Google Scholar]
- Anderson JD, Pellowski MW, Conture EG, Kelly EM. Temperamental characteristics of young children who stutter. Journal of Speech, Language, and Hearing Research. 2003;46(5):1221–1233. doi: 10.1044/1092-4388(2003/095). [DOI] [PMC free article] [PubMed] [Google Scholar]
- Arndt J, Healey EC. Concomitant disorders in school-age children who stutter. Language, Speech, and Hearing Services in Schools. 2001;32(2):68–78. doi: 10.1044/0161-1461(2001/006). [DOI] [PubMed] [Google Scholar]
- Arnold HS, Conture EG, Key AP, Walden T. Emotional reactivity, regulation and childhood stuttering: A behavioral and electrophysiological study. Journal of communication disorders. 2011;44(3):276–293. doi: 10.1016/j.jcomdis.2010.12.003. [DOI] [PMC free article] [PubMed] [Google Scholar]
- Ashburner J. A fast diffeomorphic image registration algorithm. Neuroimage. 2007;38(1):95–113. doi: 10.1016/j.neuroimage.2007.07.007. [DOI] [PubMed] [Google Scholar]
- Bajaj A. Working memory involvement in stuttering: Exploring the evidence and research implications. Journal of Fluency Disorders. 2007;32(3):218–238. doi: 10.1016/j.jfludis.2007.03.002. [DOI] [PubMed] [Google Scholar]
- Beal DS, Cheyne DO, Gracco VL, Quraan MA, Taylor MJ, De Nil L. Auditory evoked fields to vocalization during passive listening and active generation in adults who stutter. Neuroimage. 2010;52(4):1645–1653. doi: 10.1016/j.neuroimage.2010.04.277. [DOI] [PubMed] [Google Scholar]
- Beal DS, Quraan MA, Cheyne DO, Taylor MJ, Gracco VL, De Nil L. Speech-induced suppression of evoked auditory fields in children who stutter. Neuroimage. 2011;54(4):2994–3003. doi: 10.1016/j.neuroimage.2010.11.026. [DOI] [PMC free article] [PubMed] [Google Scholar]
- Beal DS, Lerch JP, Cameron B, Henderson R, Gracco VL, De Nil LF. The trajectory of gray matter development in Broca’s area is abnormal in people who stutter. Frontiers in human neuroscience. 2015;9 doi: 10.3389/fnhum.2015.00089. [DOI] [PMC free article] [PubMed] [Google Scholar]
- Behzadi Y, Restom K, Liau J, Liu TT. A component based noise correction method (CompCor) for BOLD and perfusion based fMRI. Neuroimage. 2007;37(1):90–101. doi: 10.1016/j.neuroimage.2007.04.042. [DOI] [PMC free article] [PubMed] [Google Scholar]
- Belyk M, Kraft SJ, Brown S. Stuttering as a trait or state - an ALE meta-analysis of neuroimaging studies. European Journal of Neuroscience. 2014 doi: 10.1111/ejn.12765. [DOI] [PubMed] [Google Scholar]
- Bosshardt HG. Cognitive processing load as a determinant of stuttering: Summary of a research programme. Clinical Linguistics & Phonetics. 2006;20(5):371–385. doi: 10.1080/02699200500074321. [DOI] [PubMed] [Google Scholar]
- Brocklehurst PH, Lickley RJ, Corley M. Revisiting bloodstein’s anticipatory struggle hypothesis from a psycholinguistic perspective: A variable release threshold hypothesis of stuttering. Journal of communication disorders. 2013;46(3):217–237. doi: 10.1016/j.jcomdis.2013.04.002. [DOI] [PubMed] [Google Scholar]
- Brown S, Ingham RJ, Ingham JC, Laird AR, Fox PT. Stuttered and fluent speech production: an ALE meta-analysis of functional neuroimaging studies. Human Brain Mapping. 2015;25(1):105–117. doi: 10.1002/hbm.20140. [DOI] [PMC free article] [PubMed] [Google Scholar]
- Broyd SJ, Demanuele C, Debener S, Helps SK, James CJ, Sonuga-Barke EJ. Default-mode brain dysfunction in mental disorders: a systematic review. Neuroscience & biobehavioral reviews. 2009;33(3):279–296. doi: 10.1016/j.neubiorev.2008.09.002. [DOI] [PubMed] [Google Scholar]
- Brutten EJ, Shoemaker DJ. The modification of stuttering 1967 [Google Scholar]; Buckner RL, Andrews-Hanna JR, Schacter DL. The brain’s default network. Annals of the New York Academy of Sciences. 2008;1124(1):1–38. doi: 10.1196/annals.1440.011. [DOI] [PubMed] [Google Scholar]
- Buckner RL, Andrews-Hanna JR, Schacter DL. The brain’s default network. Annals of the New York Academy of Sciences. 2008;1124(1):1–38. doi: 10.1196/annals.1440.011. [DOI] [PubMed] [Google Scholar]
- Buhr A, Zebrowski P. Sentence position and syntactic complexity of stuttering in early childhood: A longitudinal study. Journal of fluency disorders. 2009;34(3):155–172. doi: 10.1016/j.jfludis.2009.08.001. [DOI] [PMC free article] [PubMed] [Google Scholar]
- Budde KS, Barron DS, Fox PT. Stuttering, induced fluency, and natural fluency: A hierarchical series of activation likelihood estimation meta-analyses. Brain and Language. 2014;139(C):99–107. doi: 10.1016/j.bandl.2014.10.002. 2014. [DOI] [PMC free article] [PubMed] [Google Scholar]
- Busan P, D’Ausilio A, Borelli M, Monti F, Pelamatti G, Pizzolato G, Fadiga L. Motor excitability evaluation in developmental stuttering: a transcranial magnetic stimulation study. Cortex. 2013;49(3):781–792. doi: 10.1016/j.cortex.2011.12.002. [DOI] [PubMed] [Google Scholar]
- Cai S, Tourville JA, Beal DS, Perkell JS, Guenther FH, Ghosh SS. Diffusion imaging of cerebral white matter in persons who stutter: evidence for network-level anomalies. Frontiers in human neuroscience. 2014;8:54. doi: 10.3389/fnhum.2014.00054. [DOI] [PMC free article] [PubMed] [Google Scholar]
- Calhoun VD, Adali T, Giuliani NR, Pekar JJ, Kiehl KA, Pearlson GD. Method for multimodal analysis of independent source differences in schizophrenia: combining gray matter structural and auditory oddball functional data. Human brain mapping. 2006a;27(1):47–62. doi: 10.1002/hbm.20166. [DOI] [PMC free article] [PubMed] [Google Scholar]
- Calhoun VD, Adalı T, Kiehl KA, Astur R, Pekar JJ, Pearlson GD. A method for multitask fMRI data fusion applied to schizophrenia. Human brain mapping. 2006b;27(7):598–610. doi: 10.1002/hbm.20204. [DOI] [PMC free article] [PubMed] [Google Scholar]
- Calhoun VD, Liu J, Adalı T. A review of group ICA for fMRI data and ICA for joint inference of imaging, genetic, and ERP data. Neuroimage. 2009;45(1):S163–S172. doi: 10.1016/j.neuroimage.2008.10.057. [DOI] [PMC free article] [PubMed] [Google Scholar]
- Calvert GA, Campbell R. Reading speech from still and moving faces: the neural substrates of visible speech. Journal of Cognitive Neuroscience. 2003;15(1):57–70. doi: 10.1162/089892903321107828. [DOI] [PubMed] [Google Scholar]
- Cao M, Huang H, Peng Y, Dong Q, He Y. Toward Developmental Connectomics of the Human Brain. Frontiers in neuroanatomy. 2016;10 doi: 10.3389/fnana.2016.00025. [DOI] [PMC free article] [PubMed] [Google Scholar]
- Chang SE, Chow H, Wieland EA, McAuley JD. Relation between functional connectivity and rhythm discrimination in children who do and do not stutter. NeuroImage: Clinical. 2016;12:442–450. doi: 10.1016/j.nicl.2016.08.021. [DOI] [PMC free article] [PubMed] [Google Scholar]
- Chang SE, Erickson KI, Ambrose NG, Hasegawa-Johnson MA, Ludlow CL. Brain anatomy differences in childhood stuttering. Neuroimage. 2008;39(3):1333–1344. doi: 10.1016/j.neuroimage.2007.09.067. [DOI] [PMC free article] [PubMed] [Google Scholar]
- Chang SE, Zhu DC, Choo AL, Angstadt M. White matter neuroanatomical differences in young children who stutter. Brain. 2015;138(3):694–711. doi: 10.1093/brain/awu400. [DOI] [PMC free article] [PubMed] [Google Scholar]
- Chang SE, Zhu DC. Neural network connectivity differences in children who stutter. Brain. 2013;136(12):3709–3726. doi: 10.1093/brain/awt275. [DOI] [PMC free article] [PubMed] [Google Scholar]
- Choi D, Conture EG, Walden TA, Lambert WE, Tumanova V. Behavioral inhibition and childhood stuttering. Journal of fluency disorders. 2013;38(2):171–183. doi: 10.1016/j.jfludis.2013.03.001. [DOI] [PMC free article] [PubMed] [Google Scholar]
- Choo AL, Chang SE, Zengin-Bolatkale H, Ambrose NG, Loucks TM. Corpus callosum morphology in children who stutter. Journal of Communication Disorders. 2012;45(4):279–289. doi: 10.1016/j.jcomdis.2012.03.004. [DOI] [PMC free article] [PubMed] [Google Scholar]
- Christoff K, Gordon AM, Smallwood J, Smith R, Schooler JW. Experience sampling during fmri reveals default network and executive system contributions to mind wandering. Proceedings of the National Academy of Sciences. 2009;106(21):8719–8724. doi: 10.1073/pnas.0900234106. [DOI] [PMC free article] [PubMed] [Google Scholar]
- Civier O, Bullock D, Max L, Guenther FH. Computational modeling of stuttering caused by impairments in a basal ganglia thalamo-cortical circuit involved in syllable selection and initiation. Brain and language. 2013;126(3):263–278. doi: 10.1016/j.bandl.2013.05.016. [DOI] [PMC free article] [PubMed] [Google Scholar]
- Cole DM, Beckmann CF, Oei NY, Both S, van Gerven JM, Rombouts SA. Differential and distributed effects of dopamine neuromodulations on resting-state network connectivity. Neuroimage. 2013;78:59–67. doi: 10.1016/j.neuroimage.2013.04.034. [DOI] [PubMed] [Google Scholar]
- Conture E, Walden T. Dual diathesis-stressor model of stuttering. Theoretical issues of fluency disorders. 2012:94–127. [Google Scholar]
- Craig A, Tran Y. Trait and social anxiety in adults with chronic stuttering: Conclusions following meta-analysis. Journal of Fluency Disorders. 2014;40:35–43. doi: 10.1016/j.jfludis.2014.01.001. [DOI] [PubMed] [Google Scholar]
- Crosse MJ, Butler JS, Lalor EC. Congruent visual speech enhances cortical entrainment to continuous auditory speech in noise-free conditions. The Journal of Neuroscience. 2015;35(42):14195–14204. doi: 10.1523/JNEUROSCI.1829-15.2015. [DOI] [PMC free article] [PubMed] [Google Scholar]
- Daselaar S, Prince S, Cabeza R. When less means more: deactivations during encoding that predict subsequent memory. Neuroimage. 2004;23(3):921–927. doi: 10.1016/j.neuroimage.2004.07.031. [DOI] [PubMed] [Google Scholar]
- De Nil L, Kroll RM, Kapur S, Houle S. A positron emission tomography study of silent and oral single word reading in stuttering and nonstuttering adults. Journal of Speech, Language, and Hearing Research. 2000;43(4):1038–1053. doi: 10.1044/jslhr.4304.1038. [DOI] [PubMed] [Google Scholar]
- Donaher J, Richels C. Traits of attention deficit/hyperactivity disorder in school-age children who stutter. Journal of fluency disorders. 2012;37(4):242–252. doi: 10.1016/j.jfludis.2012.08.002. [DOI] [PubMed] [Google Scholar]
- Dunn DM, Dunn LM. Peabody picture vocabulary test: Manual. Pearson 2007 [Google Scholar]
- Dronkers N. A new brain region for coordinating speech articulation. Nature. 1996;384(6605):159–161. doi: 10.1038/384159a0. [DOI] [PubMed] [Google Scholar]
- Eggers K, De Nil L, Van den Bergh BR. Temperament dimensions in stuttering and typically developing children. Journal of Fluency Disorders. 2010;35(4):355–372. doi: 10.1016/j.jfludis.2010.10.004. [DOI] [PubMed] [Google Scholar]
- Eggers K, De Nil L, Van den Bergh BR. The efficiency of attentional networks in children who stutter. Journal of Speech, Language, and Hearing Research. 2012;55(3):946–959. doi: 10.1044/1092-4388(2011/10-0208). [DOI] [PubMed] [Google Scholar]
- Eggers K, De Nil L, Van den Bergh BR. Inhibitory control in childhood stuttering. Journal of fluency disorders. 2013;38(1):1–13. doi: 10.1016/j.jfludis.2012.10.001. [DOI] [PubMed] [Google Scholar]
- Embrechts M, Ebben H, Franke P, Van de Poel C, Bosshardt H, Yaruss J, Peters H. Temperament: A comparison between children who stutter and children who do not stutter. Proceedings of the Third World Congress on Fluency Disorders: Theory, research, treatment, and self-help. 2000:557–562. [Google Scholar]
- Etchell AC, Ryan M, Martin E, Johnson BW, Sowman PF. Abnormal time course of low beta modulation in non-fluent preschool children: A magnetoencephalographic study of rhythm tracking. Neuroimage. 2016;125:953–963. doi: 10.1016/j.neuroimage.2015.10.086. [DOI] [PubMed] [Google Scholar]
- Fair DA, Dosenbach NU, Church JA, Cohen AL, Brahmbhatt S, Miezin FM, Barch DM, Raichle ME, Petersen SE, Schlaggar BL. Development of distinct control networks through segregation and integration. Proceedings of the National Academy of Sciences. 2007;104(33):13507–13512. doi: 10.1073/pnas.0705843104. [DOI] [PMC free article] [PubMed] [Google Scholar]
- Fair DA, Cohen AL, Dosenbach NU, Church JA, Miezin FM, Barch DM, Raichle ME, Petersen SE, Schlaggar BL. The maturing architecture of the brain’s default network. Proceedings of the National Academy of Sciences. 2008;105(10):4028–4032. doi: 10.1073/pnas.0800376105. [DOI] [PMC free article] [PubMed] [Google Scholar]
- Fair DA, Cohen AL, Power JD, Dosenbach NU, Church JA, Miezin FM, Schlaggar BL, Petersen SE. Functional brain networks develop from a “local to distributed” organization. PLoS computational biology. 2009;5(5):e1000381. doi: 10.1371/journal.pcbi.1000381. [DOI] [PMC free article] [PubMed] [Google Scholar]
- Felsenfeld S, van Beijsterveldt CEM, Boomsma DI. Attentional regulation in young twins with probable stuttering, high nonfluency, and typical fluency. Journal of Speech, Language, and Hearing Research. 2010;53(5):1147–1166. doi: 10.1044/1092-4388(2010/09-0164). [DOI] [PubMed] [Google Scholar]
- Foundas AL, Corey DM, Angeles V, Bollich AM, Crabtree–Hartman E, Heilman KM. Atypical cerebral laterality in adults with persistent developmental stuttering. Neurology. 2003;61(10):1378–138. doi: 10.1212/01.wnl.0000094320.44334.86. [DOI] [PubMed] [Google Scholar]
- Fox MD, Snyder AZ, Vincent JL, Corbetta M, Van Essen DC, Raichle ME. The human brain is intrinsically organized into dynamic, anticorrelated functional networks. Proceedings of the National Academy of Sciences. 2005;102(27):9673–9678. doi: 10.1073/pnas.0504136102. [DOI] [PMC free article] [PubMed] [Google Scholar]
- Fox MD, Raichle ME. Spontaneous fluctuations in brain activity observed with functional magnetic resonance imaging. Nature Reviews Neuroscience. 2007;8(9):700–711. doi: 10.1038/nrn2201. [DOI] [PubMed] [Google Scholar]
- Fransson P, Ski old B, Horsch S, Nordell A, Blennow M, Lagercrantz H, Aden U. Resting-state networks in the infant brain. Proceedings of the National Academy of Sciences. 2007;104(39):15531–15536. doi: 10.1073/pnas.0704380104. [DOI] [PMC free article] [PubMed] [Google Scholar]
- Friston KJ, Harisson L, Penny W. Dynamic causal modelling. NeuroImage. 2003;19(4):1273–1302. doi: 10.1016/S1053-811(03)00202-7. [DOI] [PubMed] [Google Scholar]
- Gao W, Zhu H, Giovanello KS, Smith JK, Shen D, Gilmore JH, Lin W. Evidence on the emergence of the brain’s default network from 2-week-old to 2-year-old healthy pediatric subjects. Proceedings of the National Academy of Sciences. 2009;106(16):6790–6795. doi: 10.1073/pnas.0811221106. [DOI] [PMC free article] [PubMed] [Google Scholar]
- Goldman R. Fristoe m. Goldman-Fristoe test of articulation, 2 2000 [Google Scholar]; Gordon EM, Lee PS, Maisog JM, Foss-Feig J, Billington ME, VanMeter J, Vaidya CJ. Strength of default mode resting-state connectivity relates to white matter integrity in children. Developmental science. 2011;14(4):738–751. doi: 10.1111/j.1467-7687.2010.01020.x. [DOI] [PMC free article] [PubMed] [Google Scholar]
- Greicius MD, Krasnow B, Reiss AL, Menon V. Functional connectivity in the resting brain: a network analysis of the default mode hypothesis. Proceedings of the National Academy of Sciences. 2003;100(1):253–258. doi: 10.1073/pnas.0135058100. [DOI] [PMC free article] [PubMed] [Google Scholar]
- Greicius MD, Supekar K, Menon V, Dougherty RF. Resting-state functional connectivity reflects structural connectivity in the default mode network. Cerebral cortex. 2009;19(1):72–78. doi: 10.1093/cercor/bhn059. [DOI] [PMC free article] [PubMed] [Google Scholar]
- Hagmann P, Cammoun L, Gigandet X, Meuli R, Honey CJ, Wedeen VJ, Sporns O. Mapping the structural core of human cerebral cortex. PLoS Biol. 2008;6(7):e159. doi: 10.1371/journal.pbio.0060159. [DOI] [PMC free article] [PubMed] [Google Scholar]
- Hall DA, Fussell C, Summerfield AQ. Reading fluent speech from talking faces: typical brain networks and individual differences. Journal of Cognitive Neuroscience. 2005;17(6):939–953. doi: 10.1162/0898929054021175. [DOI] [PubMed] [Google Scholar]
- Hickok G. Computational neuroanatomy of speech production. Nature Reviews Neuroscience. 2012;13(2):135–145. doi: 10.1038/nrn3158. [DOI] [PMC free article] [PubMed] [Google Scholar]
- Himberg J, Hyvärinen A, Esposito F. Validating the independent components of neuroimaging time series via clustering and visualization. Neuroimage. 2004;22(3):1214–1222. doi: 10.1016/j.neuroimage.2004.03.027. [DOI] [PubMed] [Google Scholar]
- Hugdahl K, Thomsen T, Ersland L, Rimol LM, Niemi J. The effects of attention on speech perception: an fmri study. Brain and language. 2003;85(1):37–48. doi: 10.1016/s0093-934x(02)00500-x. [DOI] [PubMed] [Google Scholar]
- Hyvarinen A. Fast and robust fixed-point algorithms for independent component analysis. IEEE transactions on Neural Networks. 1999;10(3):626–634. doi: 10.1109/72.761722. [DOI] [PubMed] [Google Scholar]
- Ingham RJ, Grafton ST, Bothe AK, Ingham JC. Brain activity in adults who stutter: Similarities across speaking tasks and correlations with stuttering frequency and speaking rate. Brain and language. 2012;122(1):11–24. doi: 10.1016/j.bandl.2012.04.002. [DOI] [PMC free article] [PubMed] [Google Scholar]
- Iverach L, O’Brian S, Jones M, Block S, Lincoln M, Harrison E, Onslow M. Prevalence of anxiety disorders among adults seeking speech therapy for stuttering. Journal of anxiety disorders. 2009;23(7):928–934. doi: 10.1016/j.janxdis.2009.06.003. [DOI] [PubMed] [Google Scholar]
- Jansson-Verkasalo E, Eggers K, Jarvenpaa A, Suominen K, Van den Bergh B, De Nil L, Kujala T. Atypical central auditory speech-sound discrimination in children who stutter as indexed by the mismatch negativity. Journal of fluency disorders. 2014;41:1–11. doi: 10.1016/j.jfludis.2014.07.001. [DOI] [PubMed] [Google Scholar]
- Jones RM, Conture EG, Walden TA. Emotional reactivity and regulation associated with fluent and stuttered utterances of preschool-age children who stutter. Journal of communication disorders. 2014;48:38–51. doi: 10.1016/j.jcomdis.2014.02.001. [DOI] [PMC free article] [PubMed] [Google Scholar]
- Joos K, De Ridder D, Boey RA, Vanneste S. Functional connectivity changes in adults with developmental stuttering: a preliminary study using quantitative electroencephalography. Frontiers in human neuroscience. 2014;8 doi: 10.3389/fnhum.2014.00783. [DOI] [PMC free article] [PubMed] [Google Scholar]
- Kaganovich N, Wray AH, Weber-Fox C. Non-linguistic auditory processing and working memory update in pre-school children who stutter: an electrophysiological study. Developmental neuropsychology. 2010;35(6):712–736. doi: 10.1080/87565641.2010.508549. [DOI] [PMC free article] [PubMed] [Google Scholar]
- Karrass J, Walden TA, Conture EG, Graham CG, Arnold HS, Hartfield KN, Schwenk KA. Relation of emotional reactivity and regulation to childhood stuttering. Journal of communication disorders. 2006;39(6):402–423. doi: 10.1016/j.jcomdis.2005.12.004. [DOI] [PMC free article] [PubMed] [Google Scholar]
- Kefalianos E, Onslow M, Block S, Menzies R, Reilly S. Early stuttering, temperament and anxiety: Two hypotheses. Journal of Fluency Disorders. 2012;37(3):151–163. doi: 10.1016/j.jfludis.2012.03.002. [DOI] [PubMed] [Google Scholar]
- Kelly AC, Uddin LQ, Biswal BB, Castellanos FX, Milham MP. Competition between functional brain networks mediates behavioral variability. Neuroimage. 2008;39(1):527–537. doi: 10.1016/j.neuroimage.2007.08.008. [DOI] [PubMed] [Google Scholar]
- Kelly AC, Di Martino A, Uddin LQ, Shehzad Z, Gee DG, Reiss PT, Margulies DS, Castellanos FX, Milham MP. Development of anterior cingulate functional connectivity from late childhood to early adulthood. Cerebral Cortex. 2009a;19(3):640–657. doi: 10.1093/cercor/bhn117. [DOI] [PubMed] [Google Scholar]
- Kelly C, de Zubicaray G, Di Martino A, Copland DA, Reiss PT, Klein DF, Castellanos FX, Milham MP, McMahon K. L-dopa modulates functional connectivity in striatal cognitive and motor networks: a double-blind placebo-controlled study. The Journal of Neuroscience. 2009b;29(22):7364–7378. doi: 10.1523/JNEUROSCI.0810-09.2009. [DOI] [PMC free article] [PubMed] [Google Scholar]
- Kessler D, Angstadt M, Welsh RC, Sripada C. Modality-spanning deficits in attention-deficit/hyperactivity disorder in functional networks, gray matter, and white matter. The Journal of Neuroscience. 2014;34(50):16555–16566. doi: 10.1523/JNEUROSCI.3156-14.2014. [DOI] [PMC free article] [PubMed] [Google Scholar]
- Kessler D, Angstadt M, Sripada C. Growth Charting of Brain Connectivity Networks and the Identification of Attention Impairment in Youth. JAMA psychiatry. 2016;73(5):481–489. doi: 10.1001/jamapsychiatry.2016.0088. [DOI] [PMC free article] [PubMed] [Google Scholar]
- Kikuchi Y, Ogata K, Umesaki T, et al. Spatiotemporal signatures of an abnormal auditory system in stuttering. NeuroImage. 2011;55(3):891. doi: 10.1016/j.neuroimage.2010.12.083. [DOI] [PubMed] [Google Scholar]
- Lavid N, Franklin DL, Maguire GA. Management of child and adolescent stuttering with olanzapine: three case reports. Annals of Clinical Psychiatry. 1999;11(4):233–236. doi: 10.1023/a:1022365513865. [DOI] [PubMed] [Google Scholar]
- Lee MH, Hacker CD, Snyder AZ, Corbetta M, Zhang D, Leuthardt EC, Shimony JS. Clustering of resting state networks. PloS one. 2012;7(7):e40370. doi: 10.1371/journal.pone.0040370. [DOI] [PMC free article] [PubMed] [Google Scholar]
- Leech R, Kamourieh S, Beckmann CF, Sharp DJ. Fractionating the default mode network: distinct contributions of the ventral and dorsal posterior cingulate cortex to cognitive control. The Journal of Neuroscience. 2011;31(9):3217–3224. doi: 10.1523/JNEUROSCI.5626-10.2011. [DOI] [PMC free article] [PubMed] [Google Scholar]
- Lepsien J, Nobre AC. Cognitive control of attention in the human brain: Insights from orienting attention to mental representations. Brain research. 2006;1105(1):20–31. doi: 10.1016/j.brainres.2006.03.033. [DOI] [PubMed] [Google Scholar]
- Ludlow CL, Rosenberg J, Salazar A, Grafman J, Smutok M. Site of penetrating brain lesions causing chronic acquired stuttering. Annals of Neurolology. 1987;22(1):60–66. doi: 10.1002/ana.410220114. [DOI] [PubMed] [Google Scholar]
- Ludlow CL. Stuttering: dysfunction in a complex and dynamic system. Brain. 2000;123(10):1983–1984. doi: 10.1093/brain/123.10.1983. [DOI] [PubMed] [Google Scholar]
- Lu C, Ning N, Peng D, Ding G, Li K, Yang Y, Lin C. The role of large-scale neural interactions for developmental stuttering. Neuroscience. 2009;161(4):1008–1026. doi: 10.1016/j.neuroscience.2009.04.020. [DOI] [PubMed] [Google Scholar]
- Lu C, Peng D, Chen C, Ning N, Ding G, Li K, Yang Y, Lin C. Altered effective connectivity and anomalous anatomy in the basal ganglia-thalamocortical circuit of stuttering speakers. Cortex. 2010;46(1):49–67. doi: 10.1016/j.cortex.2009.02.017. [DOI] [PubMed] [Google Scholar]
- Lu C, Chen C, Peng D, You W, Zhang X, Ding G, Deng X, Yan Q, Howell P. Neural anomaly and reorganization in speakers who stutter a short-term intervention study. Neurology. 2012;79(7):625–632. doi: 10.1212/WNL.0b013e31826356d2. [DOI] [PubMed] [Google Scholar]
- Lu C, Long Y, Zheng L, Shi G, Liu L, Ding G, Howell P. Relationship between speech production and perception in people who stutter. Frontiers in human neuroscience. 2016;10 doi: 10.3389/fnhum.2016.00224. [DOI] [PMC free article] [PubMed] [Google Scholar]
- Maguire GA, Riley GD, Franklin DL, Gottschalk LA. Risperidone for the treatment of stuttering. Journal of clinical psychopharmacology. 2000;20(4):479–482. doi: 10.1097/00004714-200008000-00013. [DOI] [PubMed] [Google Scholar]
- Maguire GA, Riley GD, Franklin DL, Maguire ME, Nguyen CT, Brojeni PH. Olanzapine in the treatment of developmental stuttering: a double-blind, placebocontrolled trial. Annals of Clinical Psychiatry. 2004;16(2):63–67. doi: 10.1080/10401230490452834. [DOI] [PubMed] [Google Scholar]
- Maguire GA, Yeh CY, Ito BS. Overview of the diagnosis and treatment of stuttering. Journal of Experimental & Clinical Medicine. 2012;4(2):92–97. [Google Scholar]
- Mason MF, Norton MI, Van Horn JD, Wegner DM, Grafton ST, Macrae CN. Wandering minds: the default network and stimulus-independent thought. Science. 2007;315(5810):393–395. doi: 10.1126/science.1131295. [DOI] [PMC free article] [PubMed] [Google Scholar]
- Max L, Guenther FH, Gracco VL, Ghosh SS, Wallace ME. Unstable or insufficiently activated internal models and feedback-biased motor control as sources of dysfluency: A theoretical model of stuttering. Contemporary issues in communication science and disorders. 2004 Spring;31:105–122. [Google Scholar]
- Mazoyer B, Zago L, Mellet E, Bricogne S, Etard O, Houde O, Crivello F, Joliot M, Petit L, Tzourio-Mazoyer N. Cortical networks for working memory and executive functions sustain the conscious resting state in man. Brain research bulletin. 2001;54(3):287–298. doi: 10.1016/s0361-9230(00)00437-8. [DOI] [PubMed] [Google Scholar]
- Menon V, Uddin LQ. Saliency, switching, attention and control: a network model of insula function. Brain Structure and Function. 2010;214(5–6):655–667. doi: 10.1007/s00429-010-0262-0. [DOI] [PMC free article] [PubMed] [Google Scholar]
- Menon V. Large-scale brain networks and psychopathology: a unifying triple network model. Trends in cognitive sciences. 2011;15(10):483–506. doi: 10.1016/j.tics.2011.08.003. [DOI] [PubMed] [Google Scholar]
- Menon V. Developmental pathways to functional brain networks: emerging principles. Trends in Cognitive Sciences. 2013;17(12):627–640. doi: 10.1016/j.tics.2013.09.015. [DOI] [PubMed] [Google Scholar]
- Mohan R, Weber C. Neural systems mediating processing of sound units of language distinguish recovery versus persistence in stuttering. Journal of neurodevelopmental disorders. 2015;7(1):1. doi: 10.1186/s11689-015-9124-7. [DOI] [PMC free article] [PubMed] [Google Scholar]
- Neef NE, Anwander A, Friederici AD. The Neurobiological Grounding of Persistent Stuttering: from Structure to Function. Current Neurolology and Neuroscience Reports. 2015;15(9):579. doi: 10.1007/s11910-015-0579-4. [DOI] [PubMed] [Google Scholar]
- Neef NE, Hoang TL, Neef A, Paulus W, Sommer M. Speech dynamics are coded in the left motor cortex in fluent speakers but not in adults who stutter. Brain. 2015;138(3):712–725. doi: 10.1093/brain/awu390. [DOI] [PMC free article] [PubMed] [Google Scholar]
- Ntourou K, Conture EG, Walden TA. Emotional reactivity and regulation in preschool-age children who stutter. Journal of fluency disorders. 2013;38(3):260–274. doi: 10.1016/j.jfludis.2013.06.002. [DOI] [PMC free article] [PubMed] [Google Scholar]
- Özcan Ö, Altınayar S, Özcan C, Ünal S, Karlıdağ R. P50 sensory gating in children and adolescents with developmental stuttering. Klinik Psikofarmakoloji Bulteni-Bulletin Of Clinical Psychopharmacology. 2009;19(3):241–246. [Google Scholar]
- Özge A, Toros F, Çömelekoğlu Ü. The role of hemispheral asymmetry and regional activity of quantitative EEG in children with stuttering. Child psychiatry and human development. 2004;34(4):269–280. doi: 10.1023/B:CHUD.0000020679.15106.a4. [DOI] [PubMed] [Google Scholar]
- Packman A. Theory and therapy in stuttering: A complex relationship. Journal of fluency disorders. 2012;37(4):225–233. doi: 10.1016/j.jfludis.2012.05.004. [DOI] [PubMed] [Google Scholar]
- Paulesu E, Perani D, Blasi V, Silani G, Borghese N, De Giovanni U, Sensolo S, Fazio F. A functional-anatomical model for lipreading. Journal of Neurophysiology. 2003;90(3):2005–2013. doi: 10.1152/jn.00926.2002. [DOI] [PubMed] [Google Scholar]
- Peelle JE, Sommers MS. Prediction and constraint in audiovisual speech perception. Cortex. 2015;68:169–181. doi: 10.1016/j.cortex.2015.03.006. [DOI] [PMC free article] [PubMed] [Google Scholar]
- Piispala J, Kallio M, Bloigu R, Jansson-Verkasalo E. Delayed n2 response in go condition in a visual go/nogo erp study in children who stutter. Journal of Fluency Disorders. 2016;48:16–26. doi: 10.1016/j.jfludis.2016.02.001. [DOI] [PubMed] [Google Scholar]
- Poole VN, Robinson ME, Singleton O, Degutis J, Milberg WP, McGlinchey RE, Esterman M. Intrinsic functional connectivity predicts individual differences in distractibility. Neuropsychologia. 2016;86:176–182. doi: 10.1016/j.neuropsychologia.2016.04.023. [DOI] [PubMed] [Google Scholar]
- Power JD, Fair DA, Schlaggar BL, Petersen SE. The development of human functional brain networks. Neuron. 2010;67(5):735–748. doi: 10.1016/j.neuron.2010.08.017. [DOI] [PMC free article] [PubMed] [Google Scholar]
- Power JD, Barnes KA, Snyder AZ, Schlaggar BL, Petersen SE. Spurious but systematic correlations in functional connectivity MRI networks arise from subject motion. Neuroimage. 2012;59(3):2142–2154. doi: 10.1016/j.neuroimage.2011.10.018. [DOI] [PMC free article] [PubMed] [Google Scholar]
- Preibisch C, Neumann K, Raab P, Euler HA, von Gudenberg AW, Lanfermann H, Giraud AL. Evidence for compensation for stuttering by the right frontal operculum. Neuroimage. 2003;20(2):1356–1364. doi: 10.1016/S1053-8119(03)00376-8. [DOI] [PubMed] [Google Scholar]
- Price CJ. A review and synthesis of the first 20 years of PET and fMRI studies of heard speech, spoken language and reading. NeuroImage. 2012;62(2):816–847. doi: 10.1016/j.neuroimage.2012.04.062. [DOI] [PMC free article] [PubMed] [Google Scholar]
- Raichle ME, MacLeod AM, Snyder AZ, Powers WJ, Gusnard DA, Shulman GL. A default mode of brain function. Proceedings of the National Academy of Sciences. 2001;98(2):676–682. doi: 10.1073/pnas.98.2.676. [DOI] [PMC free article] [PubMed] [Google Scholar]
- Riley G. Stuttering severity instrument. 4th. Austin, TX: Pro-Ed; 2009. SSI-4. [Google Scholar]
- Riley GE, Riley J. A revised component model for diagnosing and treating children who stutter. Contemporary Issues in Communication Sciences and Disorders. 2000;27:188–199. [Google Scholar]
- Roebroeck A, Formisano E, Goebel R. Mapping directed influence over the brain using Granger causality and fMRI. NeuroImage. 2005;25(1):230–242. doi: 10.1016/j.neuroimage.2004.11.017. [DOI] [PubMed] [Google Scholar]
- Sato Y, Mori K, Koizumi T, Minagawa-Kawai Y, Tanaka A, Ozawa E, Wakaba Y, Mazuka R. Functional lateralization of speech processing in adults and children who stutter. Frontiers in Psychology. 2011;2:70. doi: 10.3389/fpsyg.2011.00070. [DOI] [PMC free article] [PubMed] [Google Scholar]
- Schurz M, Wimmer H, Richlan F, Ludersdorfer P, Klackl J, Kronbichler M. Resting-state and task-based functional brain connectivity in developmental dyslexia. Cerebral Cortex. 2014 doi: 10.1093/cercor/bhu184. bhu184. [DOI] [PMC free article] [PubMed] [Google Scholar]
- Seeley WW, Menon V, Schatzberg AF, Keller J, Glover GH, Kenna H, Reiss AL, Greicius MD. Dissociable intrinsic connectivity networks for salience processing and executive control. The Journal of neuroscience. 2007;27(9):2349–2356. doi: 10.1523/JNEUROSCI.5587-06.2007. [DOI] [PMC free article] [PubMed] [Google Scholar]
- Seghier ML, Price CJ. Functional heterogeneity within the default network during semantic processing and speech production. Frontiers in psychology. 2012;3:281. doi: 10.3389/fpsyg.2012.00281. [DOI] [PMC free article] [PubMed] [Google Scholar]
- Simonyan K, Fuertinger S. Speech networks at rest and in action: Interactions between functional brain networks controlling speech production. Journal of neurophysiology. 2015;113(7):2967–2978. doi: 10.1152/jn.00964.2014. [DOI] [PMC free article] [PubMed] [Google Scholar]
- Smith A. Stuttering: A unified approach to a multifactorial, dynamic disorder. Stuttering research and practice: Bridging the gap. 1999:27. [Google Scholar]
- Smith A, Weber C. Childhood Stuttering: Where Are We and Where Are We Going? Seminars in Speech Language. 2013;37(4):291–297. doi: 10.1055/s-0036-1587703. [DOI] [PMC free article] [PubMed] [Google Scholar]
- Smits-Bandstra S, De Nil L. Speech skill learning of persons who stutter and fluent speakers under single and dual task conditions. Clinical linguistics & phonetics. 2009;23(1):38–57. doi: 10.1080/02699200802394914. [DOI] [PubMed] [Google Scholar]
- Sonuga-Barke EJ, Castellanos FX. Spontaneous attentional fluctuations in impaired states and pathological conditions: a neurobiological hypothesis. Neuroscience & Biobehavioral Reviews. 2007;31(7):977–986. doi: 10.1016/j.neubiorev.2007.02.005. [DOI] [PubMed] [Google Scholar]
- Sowman PF, Crain S, Harrison E, Johnson BW. Lateralization of brain activation in fluent and non-fluent preschool children: a magnetoencephalographic study of picture-naming. Frontiers in human neuroscience. 2014;8 doi: 10.3389/fnhum.2014.00354. [DOI] [PMC free article] [PubMed] [Google Scholar]
- Spreng RN, Mar RA, Kim AS. The common neural basis of autobiographical memory, prospection, navigation, theory of mind, and the default mode: a quantitative metaanalysis. Journal of cognitive neuroscience. 2009;21(3):489–510. doi: 10.1162/jocn.2008.21029. [DOI] [PubMed] [Google Scholar]
- Spreng RN, Grady CL. Patterns of brain activity supporting autobiographical memory, prospection, and theory of mind, and their relationship to the default mode network. Journal of cognitive neuroscience. 2010;22(6):1112–1123. doi: 10.1162/jocn.2009.21282. [DOI] [PubMed] [Google Scholar]
- Sridharan D, Levitin DJ, Menon V. A critical role for the right fronto-insular cortex in switching between central-executive and default-mode networks. Proceedings of the National Academy of Sciences. 2008;105(34):12569–12574. doi: 10.1073/pnas.0800005105. [DOI] [PMC free article] [PubMed] [Google Scholar]
- Sripada CS, Kessler D, Angstadt M. Lag in maturation of the brain’s intrinsic functional architecture in attention-deficit/hyperactivity disorder. Proceedings of the National Academy of Sciences. 2014;111(39):14259–14264. doi: 10.1073/pnas.1407787111. [DOI] [PMC free article] [PubMed] [Google Scholar]
- Stager SV, Calis K, Grothe D, Bloch M, Berensen NM, Smith PJ, Braun A. Treatment with medications affecting dopaminergic and serotonergic mechanisms: Effects on fluency and anxiety in persons who stutter. Journal of Fluency Disorders. 2005;30(4):319–335. doi: 10.1016/j.jfludis.2005.09.004. [DOI] [PubMed] [Google Scholar]
- Starkweather CW, Gottwald SR. The demands and capacities model II: Clinical applications. Journal of Fluency Disorders. 1990;15(3):143–157. [Google Scholar]
- Strelnikov K, Foxton J, Marx M, Barone P. Brain prediction of auditory emphasis by facial expressions during audiovisual continuous speech. Brain topography. 2015;28(3):494–505. doi: 10.1007/s10548-013-0338-2. [DOI] [PubMed] [Google Scholar]
- Sui J, Pearlson G, Caprihan A, Adali T, Kiehl KA, Liu J, Calhoun VD. Discriminating schizophrenia and bipolar disorder by fusing fMRI and DTI in a multimodal CCA+ joint ICA model. Neuroimage. 2011;57(3):839–855. doi: 10.1016/j.neuroimage.2011.05.055. [DOI] [PMC free article] [PubMed] [Google Scholar]
- Supekar K, Musen M, Menon V. Development of large-scale functional brain networks in children. PLoS Biol. 2009;7(7):e1000157. doi: 10.1371/journal.pbio.1000157. [DOI] [PMC free article] [PubMed] [Google Scholar]
- Supekar K, Uddin LQ, Prater K, Amin H, Greicius MD, Menon V. Development of functional and structural connectivity within the default mode network in young children. Neuroimage. 2010;52(1):290–301. doi: 10.1016/j.neuroimage.2010.04.009. [DOI] [PMC free article] [PubMed] [Google Scholar]
- Tani T, Sakai Y. Analysis of five cases with neurogenic stuttering following brain injury in the basal ganglia. Journal of fluency disorders. 2011;36(1):1–16. doi: 10.1016/j.jfludis.2010.12.002. [DOI] [PubMed] [Google Scholar]
- Theys C, De Nil L, Thijs V, van Wieringen A, Sunaert S. A crucial role for the cortico-striato-cortical loop in the pathogenesis of stroke-related neurogenic stuttering. Human Brain Mapping. 2013;34(9):2103–2112. doi: 10.1002/hbm.22052. [DOI] [PMC free article] [PubMed] [Google Scholar]
- Thomason ME, Dennis EL, Joshi AA, Joshi SH, Dinov ID, Chang C, Glover GH. Resting-state fMRI can reliably map neural networks in children. Neuroimage. 2011;55(1):165–175. doi: 10.1016/j.neuroimage.2010.11.080. [DOI] [PMC free article] [PubMed] [Google Scholar]
- Tobey EA, Angelette S, Murchison C, Nicosia J, Sprague S, Staller SJ, Brimacombe JA, Beiter AL. Speech production performance in children with multichannel cochlear implants. Otology & Neurotology. 1991;12:165–173. [PubMed] [Google Scholar]
- Uddin LQ, Clare Kelly A, Biswal BB, Xavier Castellanos F, Milham MP. Functional connectivity of default mode network components: correlation, anticorrelation, and causality. Human brain mapping. 2009;30(2):625–637. doi: 10.1002/hbm.20531. [DOI] [PMC free article] [PubMed] [Google Scholar]
- Uddin LQ. Salience processing and insular cortical function and dysfunction. Nature Reviews Neuroscience. 2015;16(1):55–61. doi: 10.1038/nrn3857. [DOI] [PubMed] [Google Scholar]
- Usler E, Weber-Fox C. Neurodevelopment for syntactic processing distinguishes childhood stuttering recovery versus persistence. Journal of neurodevelopmental disorders. 2015;7(1):1–22. doi: 10.1186/1866-1955-7-4. [DOI] [PMC free article] [PubMed] [Google Scholar]
- Vasic N, Wijnen F. Stuttering as a monitoring deficit. In: Hartsuiker R, Bastiaanse R, Postma A, Wijnen F, editors. Phonological encoding and monitoring in normal and pathological speech. Hove, UK: Psychology Press; 2005. pp. 226–247. [Google Scholar]
- Venezia JH, Fillmore P, Matchin W, Isenberg AL, Hickok G, Fridriksson J. Perception drives production across sensory modalities: A network for sensorimotor integration of visual speech. Neuroimage. 2016;126:196–207. doi: 10.1016/j.neuroimage.2015.11.038. [DOI] [PMC free article] [PubMed] [Google Scholar]
- Vossel S, Geng JJ, Fink GR. Dorsal and ventral attention systems distinct neural circuits but collaborative roles. The Neuroscientist. 2014;20(2):150–159. doi: 10.1177/1073858413494269. [DOI] [PMC free article] [PubMed] [Google Scholar]
- Walden TA, Frankel CB, Buhr AP, Johnson KN, Conture EG, Karrass JM. Dual diathesis-stressor model of emotional and linguistic contributions to developmental stuttering. Journal of abnormal child psychology. 2012;40(4):633–644. doi: 10.1007/s10802-011-9581-8. [DOI] [PMC free article] [PubMed] [Google Scholar]
- Waldstein RS. Effects of postlingual deafness on speech production: implications for the role of auditory feedback. The Journal of the Acoustical Society of America. 1990;88(5):2099–2114. doi: 10.1121/1.400107. [DOI] [PubMed] [Google Scholar]
- Washington SD, Gordon EM, Brar J, Warburton S, Sawyer AT, Wolfe A, Gaillard WD. Dysmaturation of the default mode network in autism. Human brain mapping. 2014;35(4):1284–1296. doi: 10.1002/hbm.22252. [DOI] [PMC free article] [PubMed] [Google Scholar]
- Weber-Fox C, Spruill JE, Spencer R, Smith A. Atypical neural functions underlying phonological processing and silent rehearsal in children who stutter. Developmental Science. 2008;11(2):321–337. doi: 10.1111/j.1467-7687.2008.00678.x. [DOI] [PMC free article] [PubMed] [Google Scholar]
- Wechsler D. Wechsler Abbreviated Scale of Intelligence. Psychological Corporation; 1999. [Google Scholar]
- Wechsler WD. Weschler preschool and primary scale of intelligence–iii. San Antonio: Psychological Corporation; 2002. [Google Scholar]
- Weikum WM, Vouloumanos A, Navarra J, Soto-Faraco S, Sebastián-Gallés N, Werker JF. Visual language discrimination in infancy. Science. 2007;316(5828):1159–1159. doi: 10.1126/science.1137686. [DOI] [PubMed] [Google Scholar]
- Whitfield-Gabrieli S, Ford JM. Default mode network activity and connectivity in psychopathology. Annual review of clinical psychology. 2012;8:49–76. doi: 10.1146/annurev-clinpsy-032511-143049. [DOI] [PubMed] [Google Scholar]
- Williams KT. EVT-2: Expressive vocabulary test. Pearson Assessments 2007 [Google Scholar]
- Wise R, Greene J, Büchel C, Scott SK. Brain regions involved in articulation. The Lancet. 1999;353(9158):1057–1061. doi: 10.1016/S0140-6736(98)07491-1. [DOI] [PubMed] [Google Scholar]
- Wu JC, Maguire G, Riley G, Lee A, Keator D, Tang C, Fallon J, Najafi A. Increased dopamine activity associated with stuttering. Neuroreport. 1997;8(3):767–770. doi: 10.1097/00001756-199702100-00037. [DOI] [PubMed] [Google Scholar]
- Xiao Y, Zhai H, Friederici AD, Jia F. The development of the intrinsic functional connectivity of default network subsystems from age 3 to 5. Brain imaging and behavior. 2016;10(1):50–59. doi: 10.1007/s11682-015-9362-z. [DOI] [PubMed] [Google Scholar]
- Xu Y, Tong Y, Liu S, Chow HM, AbdulSabur NY, Mattay GS, Braun AR. Denoising the speaking brain: toward a robust technique for correcting artifact-contaminated fMRI data under severe motion. Neuroimage. 2014;103:33–47. doi: 10.1016/j.neuroimage.2014.09.013. [DOI] [PMC free article] [PubMed] [Google Scholar]
- Xuan Y, Meng C, Yang Y, Zhu C, Wang L, Yan Q, Lin C, Yu C. Resting-state brain activity in adult males who stutter. PloS one. 2012;7(1):e30570–e30570. doi: 10.1371/journal.pone.0030570. [DOI] [PMC free article] [PubMed] [Google Scholar]
- Yairi E, Ambrose N. A Longitudinal Study of Stuttering in Children: A Preliminary Report. Journal of Speech, Language, and Hearing Research. 1992;35(4):755–760. doi: 10.1044/jshr.3504.755. [DOI] [PubMed] [Google Scholar]
- Yairi E, Ambrose NG. Early Childhood Stuttering: Persistency and Recovery Rates. Journal of Speech, Language, and Hearing Research. 1999;42(5):1097–1112. doi: 10.1044/jslhr.4205.1097. [DOI] [PubMed] [Google Scholar]
- Yairi E, Ambrose N. Epidemiology of stuttering: 21st century advances. Journal of Fluency Disorders. 2013;38(2):66–87. doi: 10.1016/j.jfludis.2012.11.002. [DOI] [PMC free article] [PubMed] [Google Scholar]
- Yang Y, Jia F, Siok WT, Tan LH. Altered functional connectivity in persistent developmental stuttering. Scientific reports. 2016;6 doi: 10.1038/srep19128. [DOI] [PMC free article] [PubMed] [Google Scholar]
- Yeo BT, Krienen FM, Sepulcre J, Sabuncu MR, Lashkari D, Hollinshead M, Fischl B. The organization of the human cerebral cortex estimated by intrinsic functional connectivity. Journal of neurophysiology. 2011;106(3):1125–1165. doi: 10.1152/jn.00338.2011. [DOI] [PMC free article] [PubMed] [Google Scholar]
- Yerys BE, Jankowski KF, Shook D, Rosenberger LR, Barnes KA, Berl MM, Ritzl EK, VanMeter J, Vaidya CJ, Gaillard WD. The fmri success rate of children and adolescents: typical development, epilepsy, attention deficit/hyperactivity disorder, and autism spectrum disorders. Human brain mapping. 2009;30(10):3426–3435. doi: 10.1002/hbm.20767. [DOI] [PMC free article] [PubMed] [Google Scholar]
- Zarate JM. The neural control of singing. Frontiers in Human Neuroscience. 2013;7(237):1–12. doi: 10.3389/fnhum.2013.00237. [DOI] [PMC free article] [PubMed] [Google Scholar]
- Zengin-Bolatkale H, Conture EG, Walden TA. Sympathetic arousal of young children who stutter during a stressful picture naming task. Journal of fluency disorders. 2015;46:24–40. doi: 10.1016/j.jfludis.2015.07.005. [DOI] [PMC free article] [PubMed] [Google Scholar]
- Zou Q, Ross TJ, Gu H, Geng X, Zuo XN, Hong LE, Gao JH, Stein EA, Zang YF, Yang Y. Intrinsic resting-state activity predicts working memory brain activation and behavioral performance. Human brain mapping. 2013;34(12):3204–3215. doi: 10.1002/hbm.22136. [DOI] [PMC free article] [PubMed] [Google Scholar]
Associated Data
This section collects any data citations, data availability statements, or supplementary materials included in this article.